Reaching for Turbo: Aligning Perception with AMD’s Frequency Metrics
by Dr. Ian Cutress on September 17, 2019 10:00 AM ESTDetecting Turbo: Microseconds vs. Milliseconds
One of the biggest issues with obtaining frequency data is the actual process of monitoring. While there are some basic OS commands to obtain the frequency, it isn’t just as simple as reading a number.
How To Read A Frequency
As an outlay, we have to differentiate between the frequency of a processor vs. the frequency of a core. On modern PC processors, each core can act independently of each other in terms of frequency and voltage, and so each core can report different numbers. In order to read the value for each core, that core has to be targeted using an affinity mask that binds the reading to a particular core. If a simple ‘what’s the frequency’ request goes out to a processor without an affinity mask, it will return the value of the core to which that thread ends up being assigned. Typically this is the fastest core, but if there is already work being performed on a chip, that thread might end up on an idle core. If a request to find out ‘what is the current frequency of the processor’ is made, users could end up with a number of values: the frequency on a specific core, the frequency of the fastest core, or an average frequency of all the cores. To add more confusion to the matter, if the load on a core is taken into account, depending on the way the request is made, a core running at ‘50%’ load at peak frequency might end up returning a value of half frequency.
There are a multitude of programs that report frequency. Several of the most popular include:
- CPU-Z
- HWiNFO
- Intel XTU
- Intel Power Gadget
- Ryzen Master
- AIDA64
Some of these use similar methods to access frequency values, others have more intricate methods, and then the reporting and logging of each frequency value can have different effects on the system being tested.
I asked one of the main developers of these monitoring tools how they detect the frequency of a core. They gave me a brief overview – it’s not as simple as it turns out.
- Know the BCLK (~100 MHz) precisely. Normally this is done my measuring the APIC clock, but on modern systems that use internal clock references (Win 10 1803+) this causes additional interrupt bandwidth, and so often this value is polled rarely and cached.
- Detect the CPU Core multiplier by reading a single Model Specific Register based on the CPU. This has to be done in kernel mode, so there is additional overhead switching from user mode to kernel mode and back.
- This has to be repeated for each core by using an affinity mask, using a standard Win32 API call of SetCurrentThreadAffinityMask. As this is an API call, there is again additional overhead.
So the frequency of a single core here is measured by the base clock / BCLK and multiplying it by the Core Multiplier as defined in the registers for that core, all through an affinity mask. Typically BCLK is the same across all cores, but even that has some drift and fluctuations over time, so it will depend on how frequently you request that data.
Another alternative method is to apply a simple load – a known array of consistent instructions and to measure the number of cycles / length of time it takes to compute that small array. This method might be considered more accurate by some, but it still requires the appropriate affinity mask to be put in place, and actually puts in additional load to the system, which could cause erroneous readings.
How Quick Can Turbo Occur
Modern processors typically Turbo anywhere from 4 GHz to 5 GHz, or four to five billion cycles a second. That means each cycle at 5 GHz is equal to 0.2 nanoseconds, or 0.2 x 10⁻⁹ seconds. These processors don’t stay at that frequency – they adjust the frequency up or down based on the load requests, which helps manage power and heat. How quickly a processor can respond to these requests for a higher frequency has become a battleground in recent years.
How a processor manages its frequency all comes down to how it interacts with the operating system. In a pre-Skylake world, a processor would have a number of pre-defined ACPI power states, relating to performance (P), Device (D), and processor (C), based on if the processor was on, in sleep, or needed high frequency. P-states relied on a voltage-frequency scaling, and the OS could control P0 to P1 to P2 and beyond, with P1 being the guaranteed base frequency and any higher P number being OS controlled. The OS could request P0, which enabled the processor to enter boost mode. All of this would go through a set of OS drivers relating to power and frequency control; this came to be known as SpeedStep for Intel, and Cool’n’Quiet for AMD.
As defined in the ACPI specifications, with the introduction of UEFI control came CPPC, or Collaborative Processor Performance Control. Requiring CPU and OS support, with Skylake we saw Intel and Microsoft introduced a new ‘Speed Shift’ feature that put the control of the frequency modes of the processor back in the hands of the processor – the CPU could directly respond to the instruction density coming into the core and modify the frequency directly without additional commands. The end result of CPPC, and Speed Shift for Intel, was a much faster frequency response mechanism.
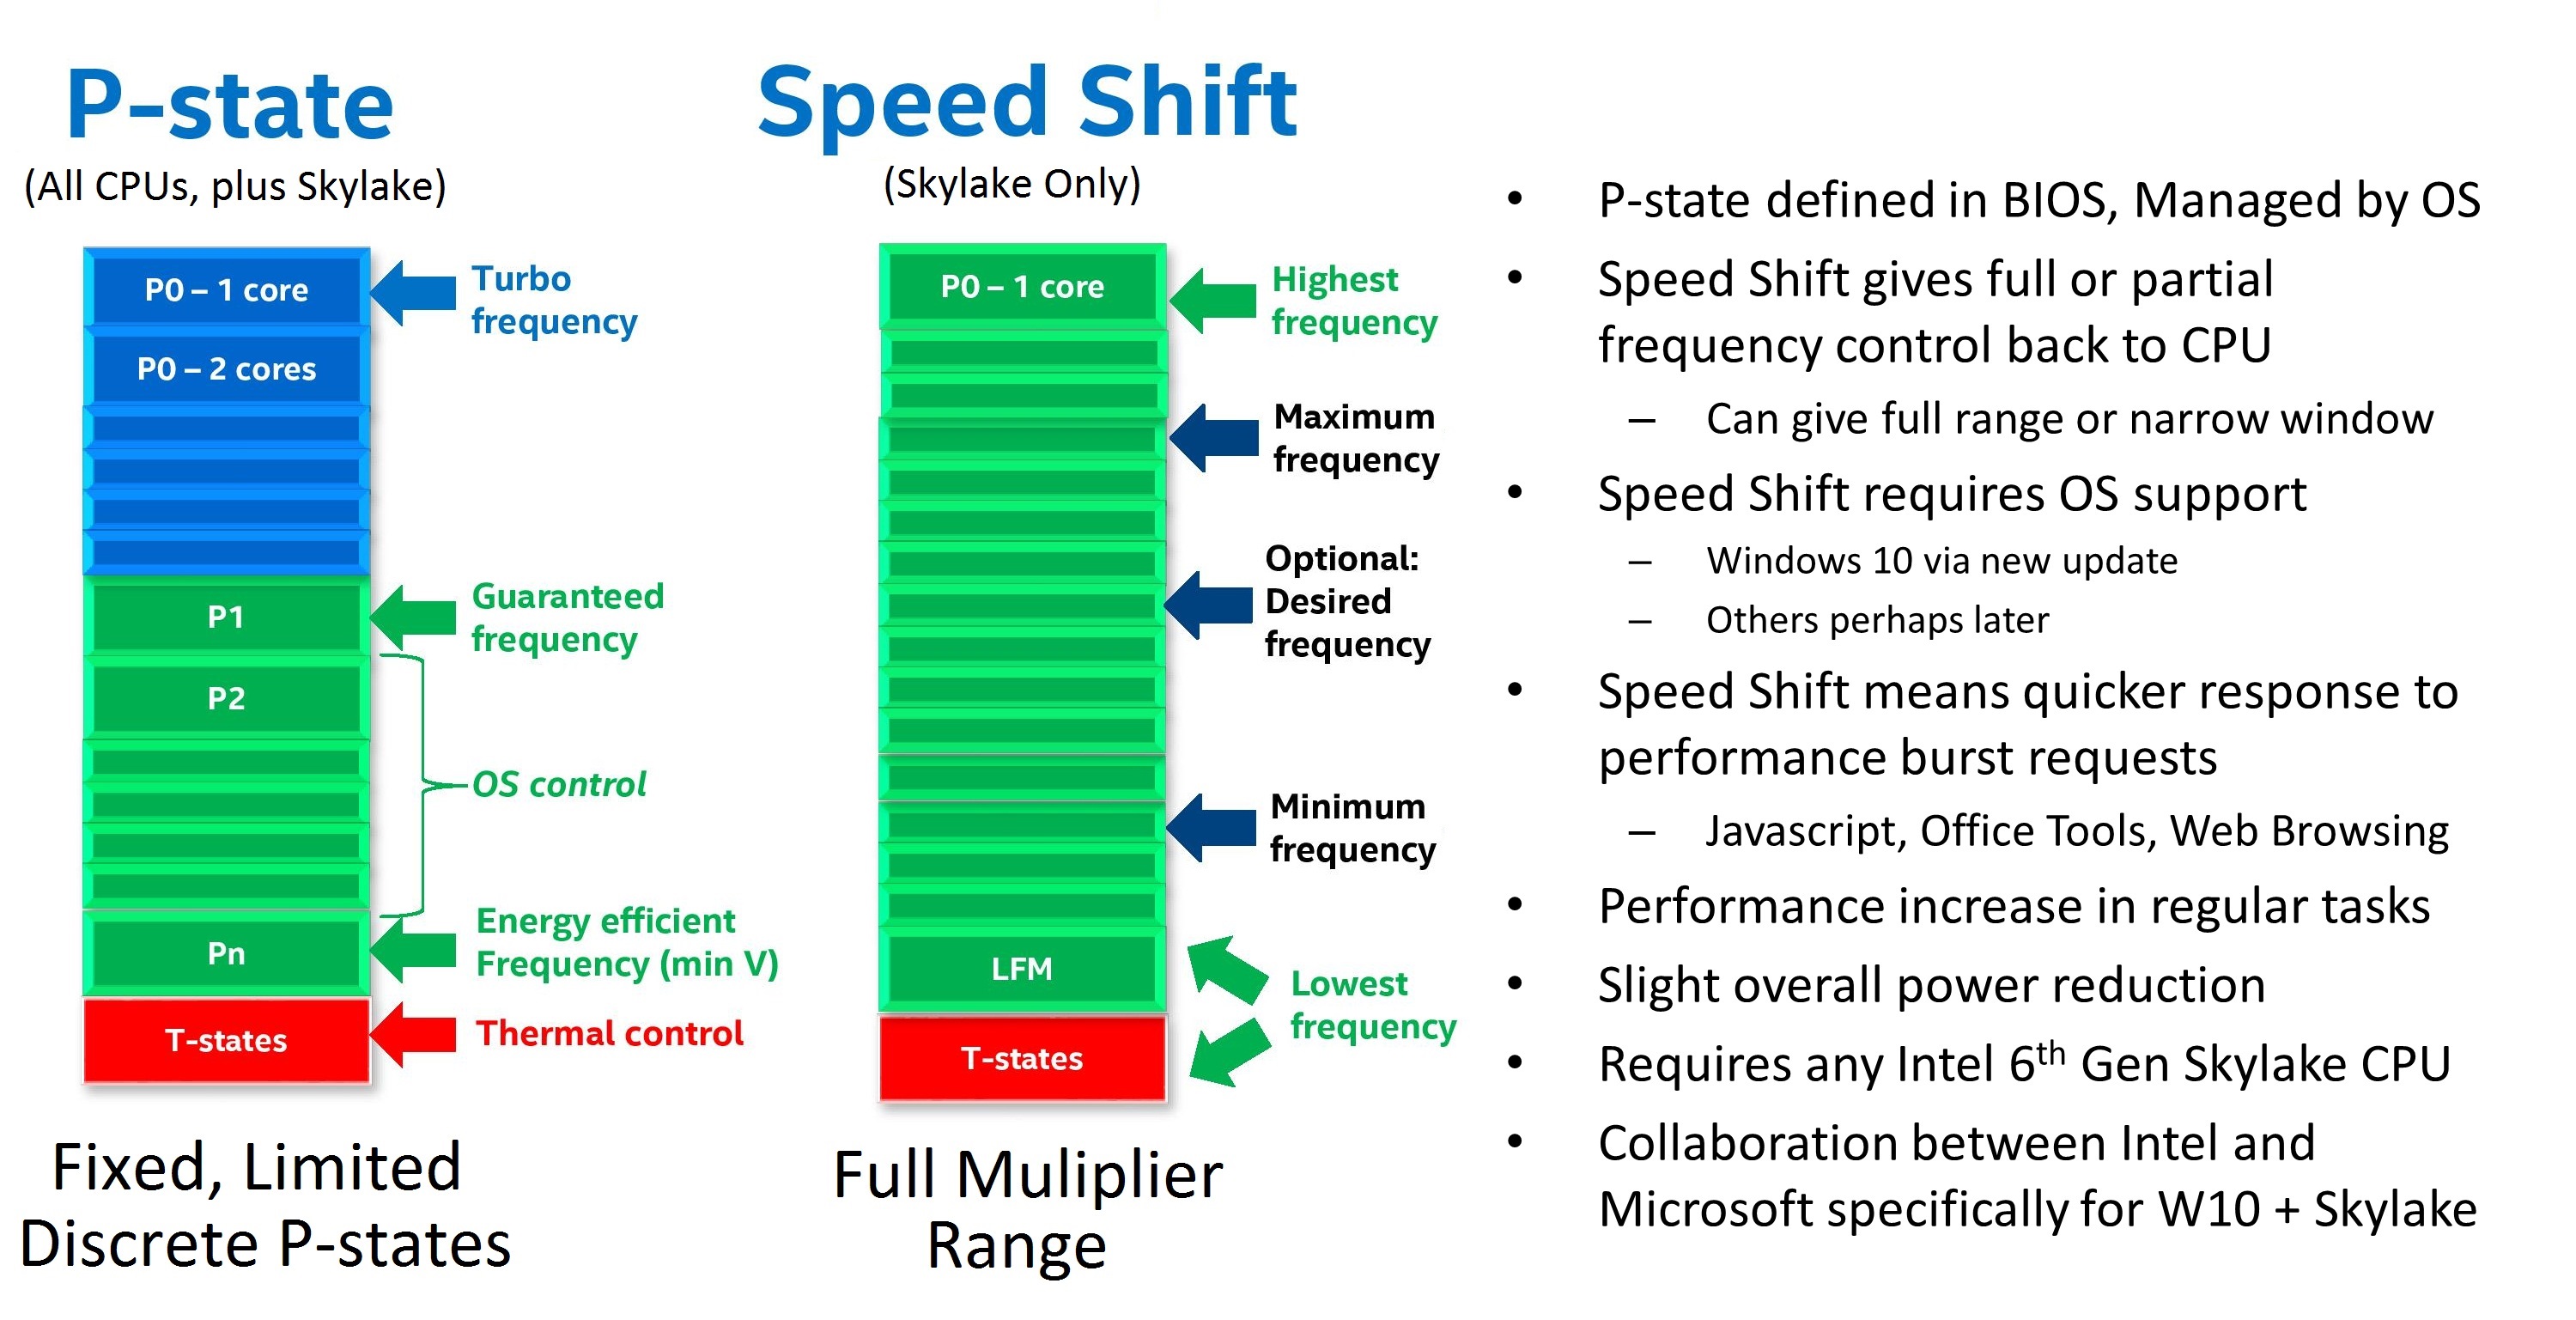
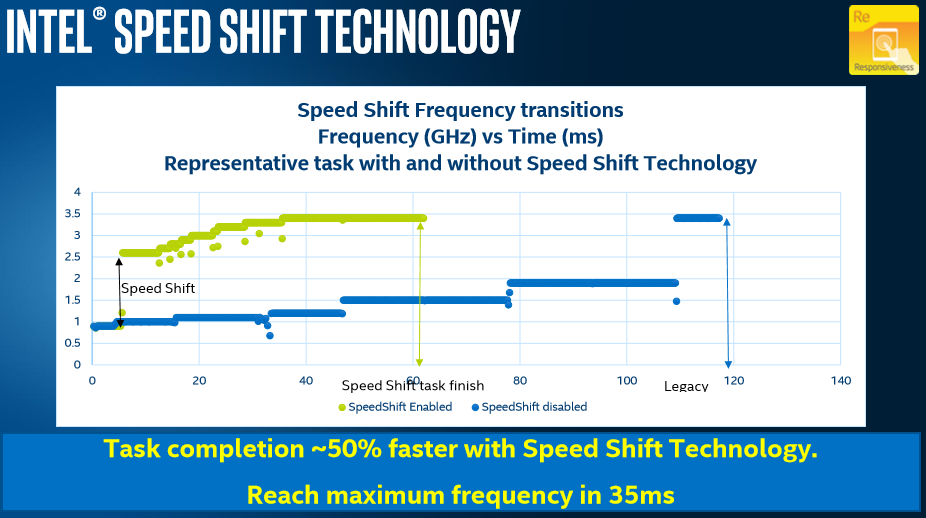
With Speed Shift in Skylake, on Windows, Intel was promoting that before Speed Shift they were changing frequency anywhere up to 100 milliseconds (0.1 s) after the request was made. With Speed Shift, that had come down to the 35 millisecond mark, around a 50-66% improvement. With subsequent updates to the Skylake architecture and the driver stack, Intel states that this has improved further.
Users can detect to see if CPPC is enabled on their Intel system very easily. By going to the Event Viewer, selecting Window Logs -> System, and then going to a time stamp where the machine was last rebooted, we can see ACPI CPPC listed under the Kernel-Processor-Power source.
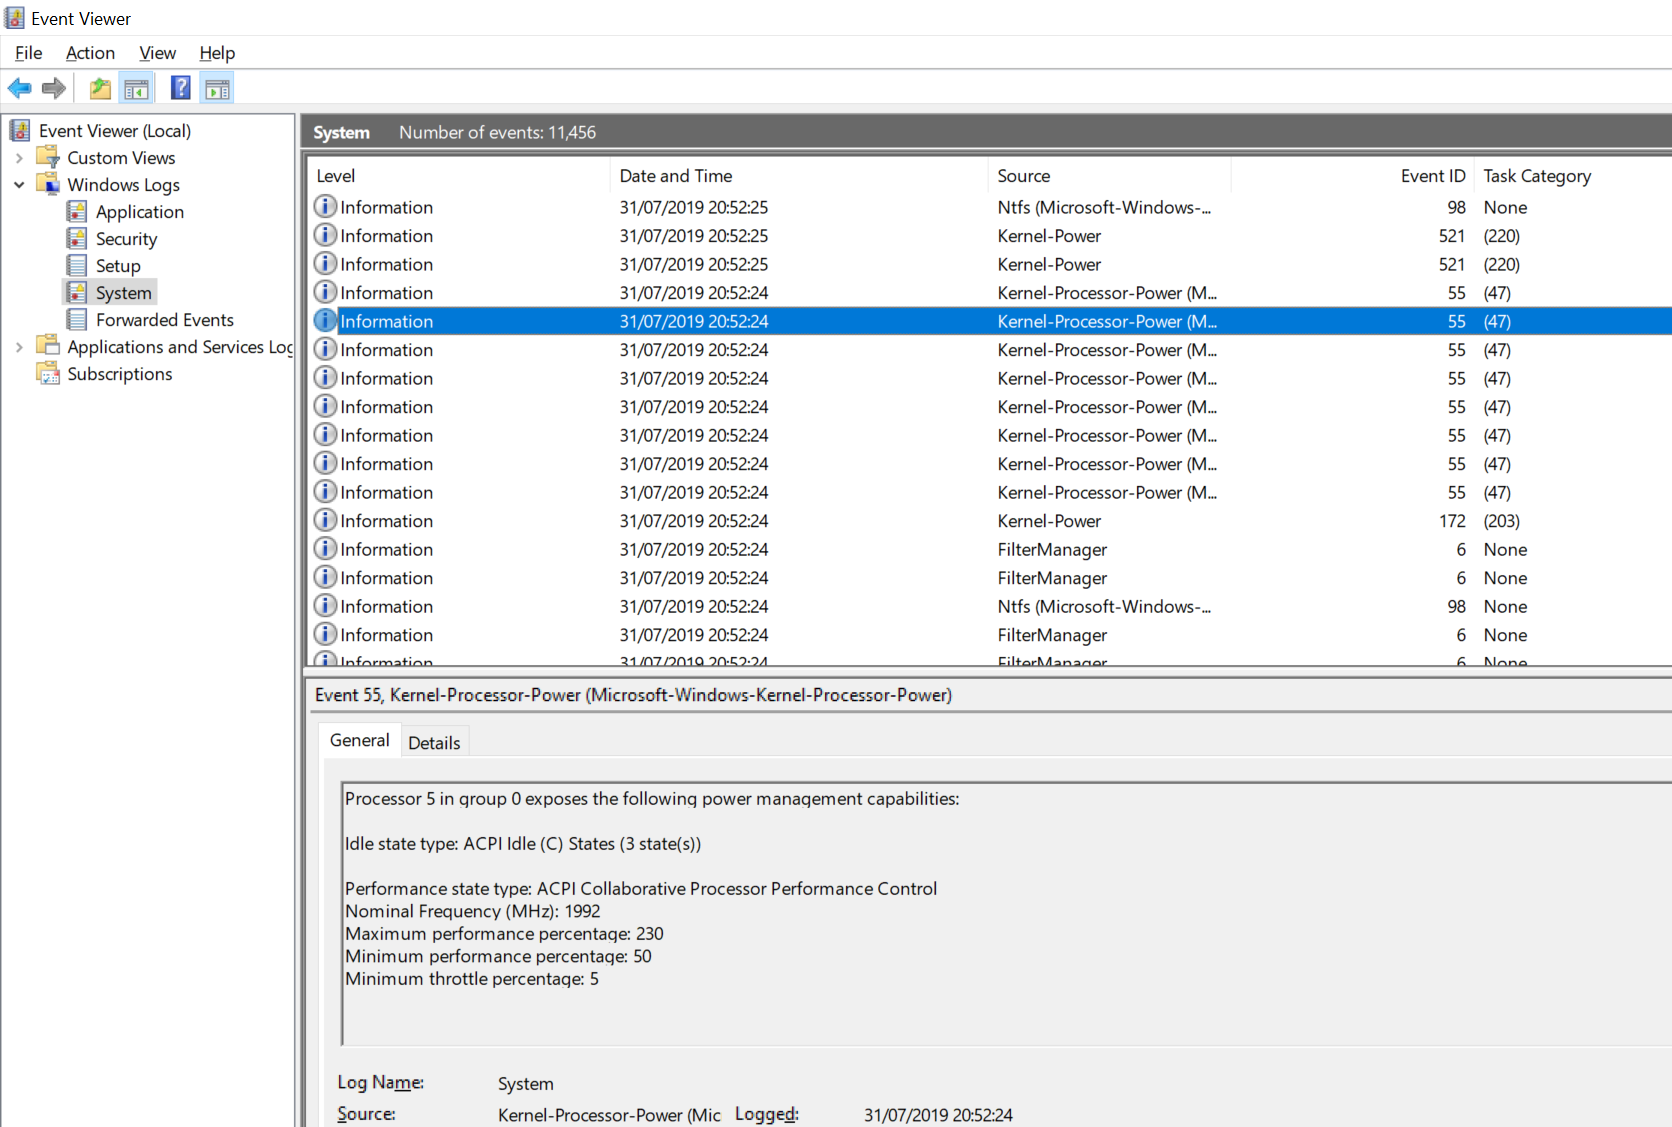
For my Core i7-8565U Whiskey Lake CPU, it shows that APCI CPPC is enabled, and that my CPU Core 5 is running at 2.0 GHz base with a 230% peak turbo, or 4.6 GHz, which relates to the single-core turbo frequency of my processor.
For AMD, with Zen 2, the company announced the use of CPPC2 in collaboration with Microsoft. This is CPPC but with a few extra additional tweaks to the driver stack for when an AMD processor is detected.
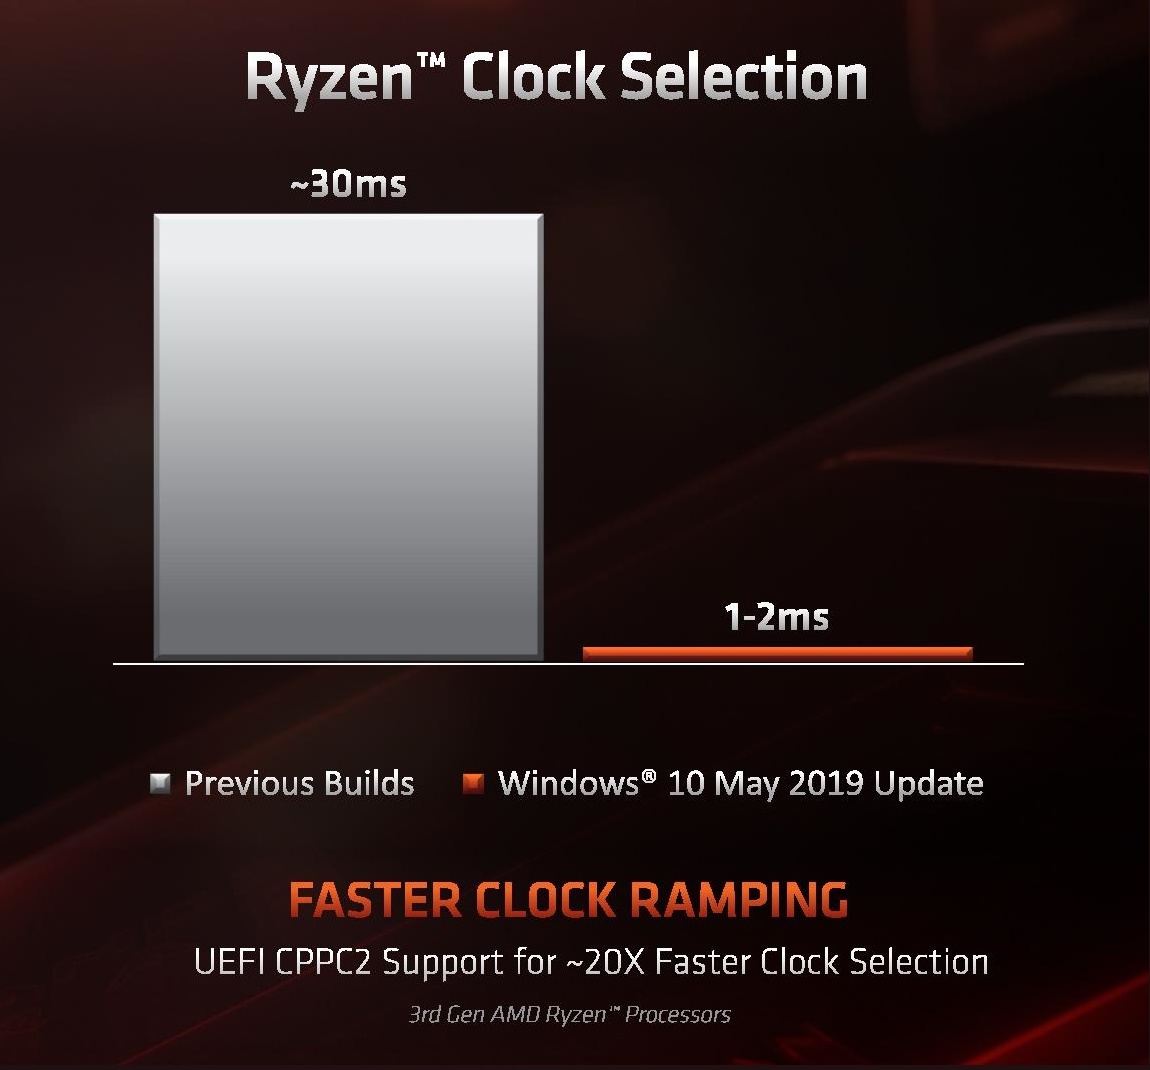
Here AMD is claiming that they can change frequency, when using the Windows 10 May 2019 update or newer, on the scale of 1-2 ms, compared to 30 ms with the standard CPPC interface. This comes down to how AMD has implemented its ‘CPPC2’ model, with a series of shim drivers in place to help speed the process along. If we go back to how we can detect that CPPC mode similar to Intel, we see a subtle difference:
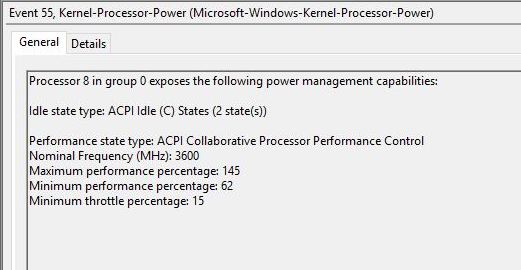
Ryzen 7 3700X
Notice here it doesn’t say CPPC2, just CPPC. What does display is the 3600 MHz base frequency of our 3700X, and a maximum performance percentage of 145%, which would make the peak turbo of this processor somewhere near 5220 MHz. Clearly that isn’t the peak turbo of this CPU (which would be 4400 MHz), which means that AMD is using this artificially high value combined with its CPPC driver updates to help drive a faster frequency response time.
The Observer Effect
Depending on the software being used, and the way it calculates the current frequency of any given core/processor, we could end up artificially loading the system, because as explained above it is not as simple as just reading a number – extra calculations have to be made or API calls have to be driven. The more frequently the user tries to detect the frequency, the more artificial load is generated on the core, and at some point the system will detect this as requiring a different frequency, making the readings change.
This is called the observer effect. And it is quite easy to see it in action.
For any tool that allows the user to change the polling frequency, as the user changes that frequency from once per second to ten times per second, then 100 times per second, or 1000 times per second, even on a completely idle system, some spikes will be drawn – more if the results are being logged to memory or a data file.
Therein lies the crutch of frequency reporting. Ultimately we need the polling frequency to be quick enough to capture all the different frequency changes, but we don’t want it interfering with the measurement. Combined with CPPC, this can make detecting certain peak frequencies particularly annoying.
Let’s go back to our time scales for instructions and frequency changes. At 4 GHz, we can break down the following:
| Time Scales at 4 GHz | ||
| AnandTech | Time | Unit |
| One Cycle | 0.00000000025 |
s |
| Simple Loop (1000 cycles) | 0.0000025 |
s |
| CPPC Frequency Change (AMD) | 0.002 |
s |
| Frequency Polling | 0.1 |
s |
Note that a frequency change is the equivalent to losing around 800,000 cycles at 4 GHz, so the CPU has to gauge to what point the frequency change is worth it based on the instructions flowing into the core.
But what this does tell is one of the inherent flaws in frequency monitoring – if a CPU can change frequency as quickly as every 1-2 ms, but we can only poll at around 50-100 ms, then we can miss some turbo values. If a processor quickly fires up to a peak turbo, processes a few instructions, and then drops down almost immediately due to power/frequency requirements not being met for the incoming instruction stream, it won’t ever be seen by the frequency polling software. If the requirements are met of course, then we do see the turbo frequency – the value we end up seeing is the one that the system feels is more long-term suitable.
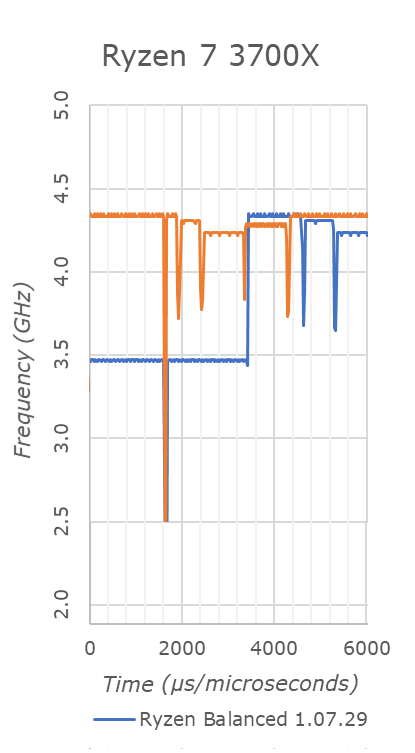
With an attempt at sub-1ms polling time, we can see this in effect. The blue line shows the Ryzen processor in a balanced power configuration, and at around 3.6 milliseconds the 3700X jumps up to 4350-4400 MHz, bouncing around between the two. But by 4.6 milliseconds, we have already jumped down to 4.3 GHz, then at 5.2 milliseconds we are at 4.2 GHz.
We were able to obtain this data using Windows Subsystem for Linux, using an add-dependency chain from which we derive the frequency based on the throughput. There is no observer effect here because it is the workload – not something that can be done when an external workload is used. It gives us a resolution of around 40 microseconds, and relies on the scheduler automatically assigning the thread to the best core.
But simply put, unless a user is polling this quick, the user will not see the momentary peaks in turbo frequency if they are on the boundary of supporting it. The downside of this is that polling this quick puts an artificial load on the system, and means any concurrent running benchmark will be inadequate.
(For users wondering what that orange line is, that would be the processor in ‘performance mode’, which gives a higher tolerance for turbo.)
It all leads to a question – if a core hits a turbo frequency but you are unable to detect it, does that count?
Ultimately, by opting for a more aggressive binning strategy so close to silicon limits, AMD has reached a point where, depending on the workload and the environment, a desktop CPU might only sustain a top Turbo bins momentarily. Like Turbo itself, this is not a bad thing, as it extracts more performance from their processors that would otherwise be left on the table by lower clockspeeds. But compared to Intel’s processors and what we’re used to, these highest bins require more platform management to ensure that the processor is indeed reaching its full potential.


144 Comments
View All Comments
0siris - Tuesday, September 17, 2019 - link
In the end, this doesn't change anything for those of us who read reviews and decided based on those if the performance in our workloads was acceptable for the price AMD was asking. But if your marketing is going to dumb the performance down to a (set of) number(s), then you will also have to deal with the complaints of people whose understanding doesn't go beyond those simple numbers. Looks like the "bigger number!" marketing we've seen with is finally starting to hurt companies.It seems completely logical to me that boosting algorithms will become ever more refined to ensure optimal performance at all times. That's a good thing for all of us.
WaltC - Tuesday, September 17, 2019 - link
The so-called Bulldozer lawsuit was settled by the lawyers who brought the suit (not just by AMD, as is erroneously often implied), who agreed to take the money and run rather than chance the loss of their suit, ultimately, because AMD surely would have won, anyway. AMD agreed to the payout as it amounted to less money than it would have cost AMD to actually go all the way and win the suit--this is why companies settle spurious lawsuits--and is the only reason they do. Additionally, in writing, the suing attorney's agreed with AMD that AMD had done nothing wrong--no false advertising, etc. Whenever this "issue" *cough* is raised, it is never explained fully--with a sort of mindless "AMD did something wrong" emphasis. Of course, nothing about this *old* lawsuit has anything at all to do with the burst frequency issue which AMD recently corrected in the ABBA AGESA is distributed a week ago--so what is the purpose of mentioning a lawsuit that the suing attorney's have dropped and agreed with AMD that AMD had done nothing wrong?....;) Clearly, the suing attorneys believed they could not win, else they would not have agreed to such a tiny settlement, eh? Or agreed to signing a statement clearing AMD of any wrongdoing whatsoever. (There is something wrong with the civil system when this kind of garbage is allowed to clog up the courts, imo, but that's another issue entirely.)I really don't understand why some people don't understand that "teething" issues with a new architecture release are common--and it doesn't matter whether AMD makes the CPU or Intel makes it--new architectures all demand a period of software adjustment--six months to a year is common for both companies when new architectures are released! I marvel that this needs explanation...;) It's been so long since Intel has shipped a ground-up new architecture, though, that likely few remember Intel-architecture teething problems. I hate to see all the red faces appearing when and if Intel ever makes it to 7nm with a new architecture....)
AMD has also made it clear that the AGESA bugs caused the loss of boost MHz, in all cases. They've surely fixed it--my 3600X boosts now like it did with AGESAs 1002/3 in bios releases for my x570Arus Master--and a tad faster--to 4.424GHz, instead of 4.401GHz. (Wowee...;)) Later AGESAs up through ABB cut max boost by ~125Mhz. Happy to report that has been remedied with the newer AMD AGESA ABBA bios for my x570 Master.
hansmuff - Tuesday, September 17, 2019 - link
Outrage culture and the lawyers are just cashing in on it. Can't blame them either.WaltC - Tuesday, September 17, 2019 - link
Yes! I really don't blame the starving lawyers quite as much as I blame the judges who greenlight spurious stuff like this. I mean, it creates the impression that either the judges don't understand the issues involved, or else that it's a racket with "everyone" hoping to share the ill-gotten gains...;) Because in the end--it's we the customers who pay for all of the spurious junk that isn't thrown out on day 1--just as much as if it was a direct tax. This reminds me so much of the infamous class-action suit they tried and failed to throw at the HDD makers a few years back. The lawyers alleged that everyone who bought a hard drive was "mislead" by false advertising because the HDD makers decided to call a "megabyte" 1,000,000 bytes instead of 1,024,000 bytes--*even though* all of the HDD makers posted that information not only in all their product advertising, but also on the HDD product boxes! The judge in that case was savvy enough to throw it out on Day 1, IIRC. In the Bulldozer case, of course, the lawyers will earn $6M-$8M (or more) of the $12M and the Bulldozer owners might be lucky to get $10 each....;) What a racket!...;)Targon - Tuesday, September 17, 2019 - link
Intel hasn't had a new architecture for so long at this point, many people have forgotten about the problems.WaltC - Tuesday, September 17, 2019 - link
Shades of Prescott..;)Korguz - Tuesday, September 17, 2019 - link
Targon, not according to one person that comments on here, sunny cove is a new architecture, and is completely different then all the cpu's intel has made over the last 5 or so years.but yea.. its time intel stopped milking the same architecture, and its customers, and came out with something that is actually new
Phynaz - Wednesday, September 18, 2019 - link
Why do you care, you would never buy intel?FunBunny2 - Wednesday, September 18, 2019 - link
"its time intel stopped milking the same architecture, and its customers, and came out with something that is actually new"'architecture' is constrained by the Law's of God, aka maths, so once the 'best' has been found, that's it. IMHO, all these 'architectures' amount to:
1) pulling previously off-chip function on-chip
2) rearranging them to implement Cray's shorter wires
3) adding more transistors to make certain functions bigger
not really much 'architecture' progress to any of that. in any case, how much more 'architecture' does it take to do word processing, spreadsheets, and e-mail? you know, the Three Killer Apps of the PC?
Korguz - Wednesday, September 18, 2019 - link
once the best has been found ??? intel hasnt released a new architecture because they have had no reason to. but i bet now, with Zen, intel is doing just that, working on something that is actually new and not based on the same cpu we have had from them for the last 5 or so years.