The Intel Core i9-9980XE CPU Review: Refresh Until it Hertz
by Ian Cutress on November 13, 2018 9:00 AM ESTHEDT Performance: System Tests
Our System Test section focuses significantly on real-world testing, user experience, with a slight nod to throughput. In this section we cover application loading time, image processing, simple scientific physics, emulation, neural simulation, optimized compute, and 3D model development, with a combination of readily available and custom software. For some of these tests, the bigger suites such as PCMark do cover them (we publish those values in our office section), although multiple perspectives is always beneficial. In all our tests we will explain in-depth what is being tested, and how we are testing.
All of our benchmark results can also be found in our benchmark engine, Bench.
Application Load: GIMP 2.10.4
One of the most important aspects about user experience and workflow is how fast does a system respond. A good test of this is to see how long it takes for an application to load. Most applications these days, when on an SSD, load fairly instantly, however some office tools require asset pre-loading before being available. Most operating systems employ caching as well, so when certain software is loaded repeatedly (web browser, office tools), then can be initialized much quicker.
In our last suite, we tested how long it took to load a large PDF in Adobe Acrobat. Unfortunately this test was a nightmare to program for, and didn’t transfer over to Win10 RS3 easily. In the meantime we discovered an application that can automate this test, and we put it up against GIMP, a popular free open-source online photo editing tool, and the major alternative to Adobe Photoshop. We set it to load a large 50MB design template, and perform the load 10 times with 10 seconds in-between each. Due to caching, the first 3-5 results are often slower than the rest, and time to cache can be inconsistent, we take the average of the last five results to show CPU processing on cached loading.
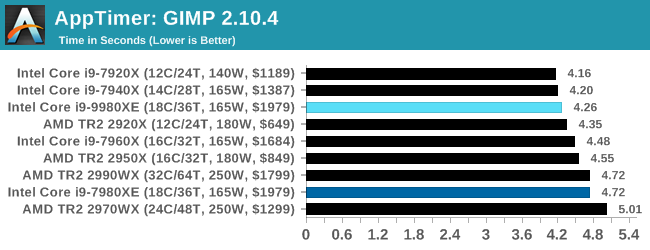
Loading software is usually an achilles heel of multi-core processors based on the lower frequency. The 9980XE pushes above and beyond the 7980XE in this regard, given it has better turbo performance across the board.
FCAT: Image Processing
The FCAT software was developed to help detect microstuttering, dropped frames, and run frames in graphics benchmarks when two accelerators were paired together to render a scene. Due to game engines and graphics drivers, not all GPU combinations performed ideally, which led to this software fixing colors to each rendered frame and dynamic raw recording of the data using a video capture device.
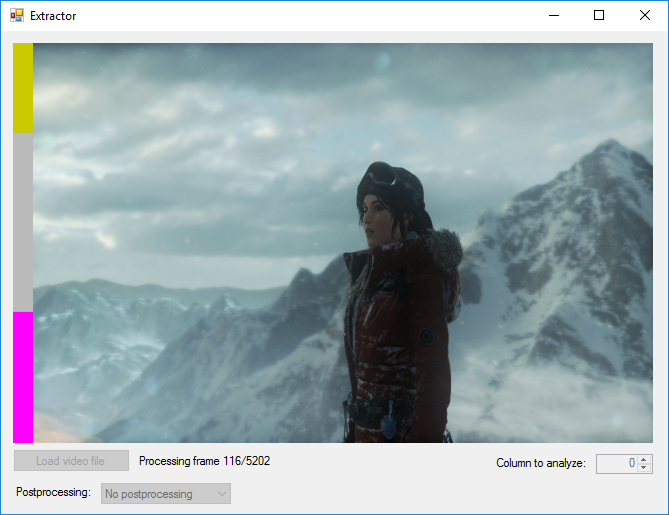
The FCAT software takes that recorded video, which in our case is 90 seconds of a 1440p run of Rise of the Tomb Raider, and processes that color data into frame time data so the system can plot an ‘observed’ frame rate, and correlate that to the power consumption of the accelerators. This test, by virtue of how quickly it was put together, is single threaded. We run the process and report the time to completion.
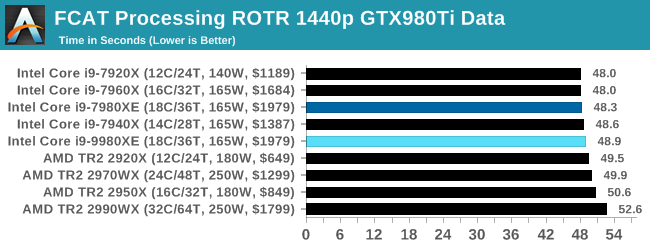
Despite the 9980XE having a higher frequency than the 7980XE, they both fall in the same region as all these HEDT processors seems to be trending towards 48 seconds. For context, the 5.0 GHz Core i9-9900K scores 44.7 seconds, another 8% or so faster.
3D Particle Movement v2.1: Brownian Motion
Our 3DPM test is a custom built benchmark designed to simulate six different particle movement algorithms of points in a 3D space. The algorithms were developed as part of my PhD., and while ultimately perform best on a GPU, provide a good idea on how instruction streams are interpreted by different microarchitectures.
A key part of the algorithms is the random number generation – we use relatively fast generation which ends up implementing dependency chains in the code. The upgrade over the naïve first version of this code solved for false sharing in the caches, a major bottleneck. We are also looking at AVX2 and AVX512 versions of this benchmark for future reviews.
For this test, we run a stock particle set over the six algorithms for 20 seconds apiece, with 10 second pauses, and report the total rate of particle movement, in millions of operations (movements) per second. We have a non-AVX version and an AVX version, with the latter implementing AVX512 and AVX2 where possible.
3DPM v2.1 can be downloaded from our server: 3DPMv2.1.rar (13.0 MB)
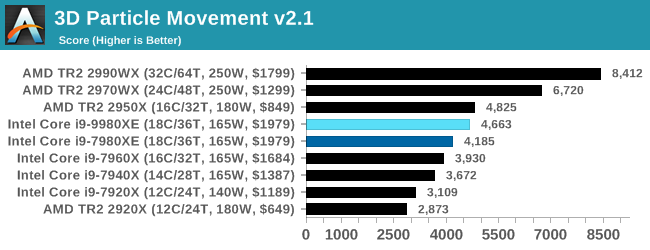
Without any AVX code, our 3DPM test shows that with fewer cores, AMD's 16-core Threadripper actually beats both of the 7980XE and 9980XE. The higher core count AMD parts blitz the field.
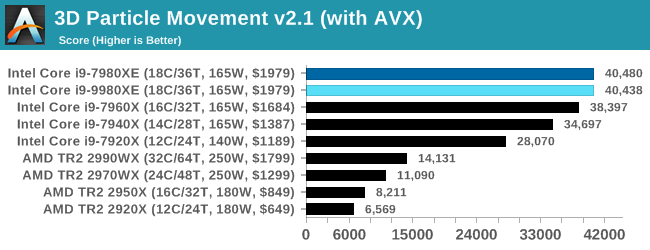
When we add AVX2 / AVX512, the Intel HEDT systems go above and beyond. This is the benefit of hand-tuned AVX512 code. Interestingly the 9980XE scores about the same as the 7980XE - I have a feeling that the AVX512 turbo tables for both chips are identical.
Dolphin 5.0: Console Emulation
One of the popular requested tests in our suite is to do with console emulation. Being able to pick up a game from an older system and run it as expected depends on the overhead of the emulator: it takes a significantly more powerful x86 system to be able to accurately emulate an older non-x86 console, especially if code for that console was made to abuse certain physical bugs in the hardware.
For our test, we use the popular Dolphin emulation software, and run a compute project through it to determine how close to a standard console system our processors can emulate. In this test, a Nintendo Wii would take around 1050 seconds.
The latest version of Dolphin can be downloaded from https://dolphin-emu.org/
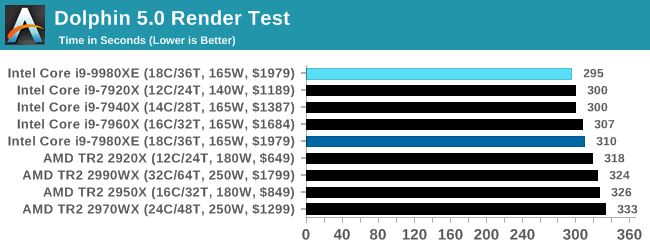
Dolphin enjoys single thread frequency, so at 4.5 GHz we see the 9980XE getting a small bump over the 7980XE.
DigiCortex 1.20: Sea Slug Brain Simulation
This benchmark was originally designed for simulation and visualization of neuron and synapse activity, as is commonly found in the brain. The software comes with a variety of benchmark modes, and we take the small benchmark which runs a 32k neuron / 1.8B synapse simulation, equivalent to a Sea Slug.
Example of a 2.1B neuron simulation
We report the results as the ability to simulate the data as a fraction of real-time, so anything above a ‘one’ is suitable for real-time work. Out of the two modes, a ‘non-firing’ mode which is DRAM heavy and a ‘firing’ mode which has CPU work, we choose the latter. Despite this, the benchmark is still affected by DRAM speed a fair amount.
DigiCortex can be downloaded from http://www.digicortex.net/
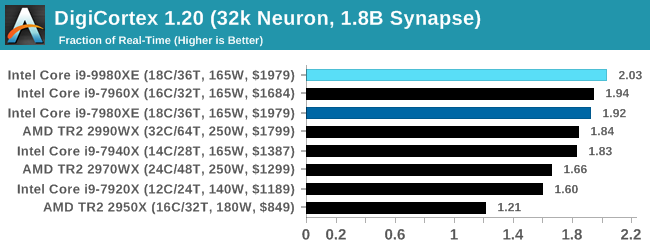
DigiCortex requires a good memory subsystem as well as cores and frequency. We get a small bump for the new 9980XE here.
y-Cruncher v0.7.6: Microarchitecture Optimized Compute
I’ve known about y-Cruncher for a while, as a tool to help compute various mathematical constants, but it wasn’t until I began talking with its developer, Alex Yee, a researcher from NWU and now software optimization developer, that I realized that he has optimized the software like crazy to get the best performance. Naturally, any simulation that can take 20+ days can benefit from a 1% performance increase! Alex started y-cruncher as a high-school project, but it is now at a state where Alex is keeping it up to date to take advantage of the latest instruction sets before they are even made available in hardware.
For our test we run y-cruncher v0.7.6 through all the different optimized variants of the binary, single threaded and multi-threaded, including the AVX-512 optimized binaries. The test is to calculate 250m digits of Pi, and we use the single threaded and multi-threaded versions of this test.
Users can download y-cruncher from Alex’s website: http://www.numberworld.org/y-cruncher/
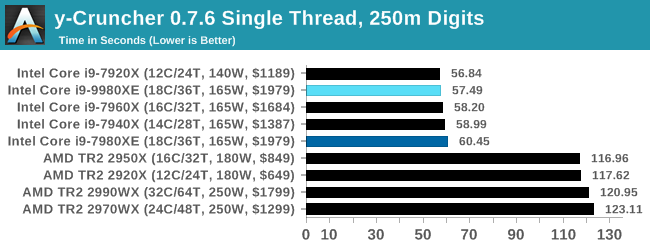
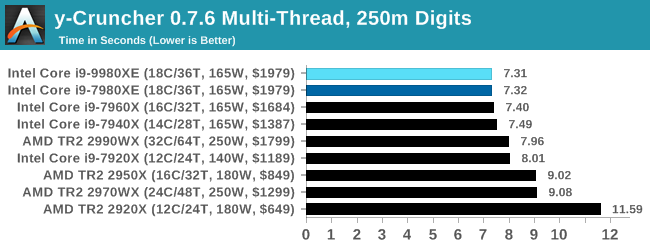
With another one of our AVX2/AVX512 tests, the Skylake-X parts win in both single thread and multi-threads.
Agisoft Photoscan 1.3.3: 2D Image to 3D Model Conversion
One of the ISVs that we have worked with for a number of years is Agisoft, who develop software called PhotoScan that transforms a number of 2D images into a 3D model. This is an important tool in model development and archiving, and relies on a number of single threaded and multi-threaded algorithms to go from one side of the computation to the other.
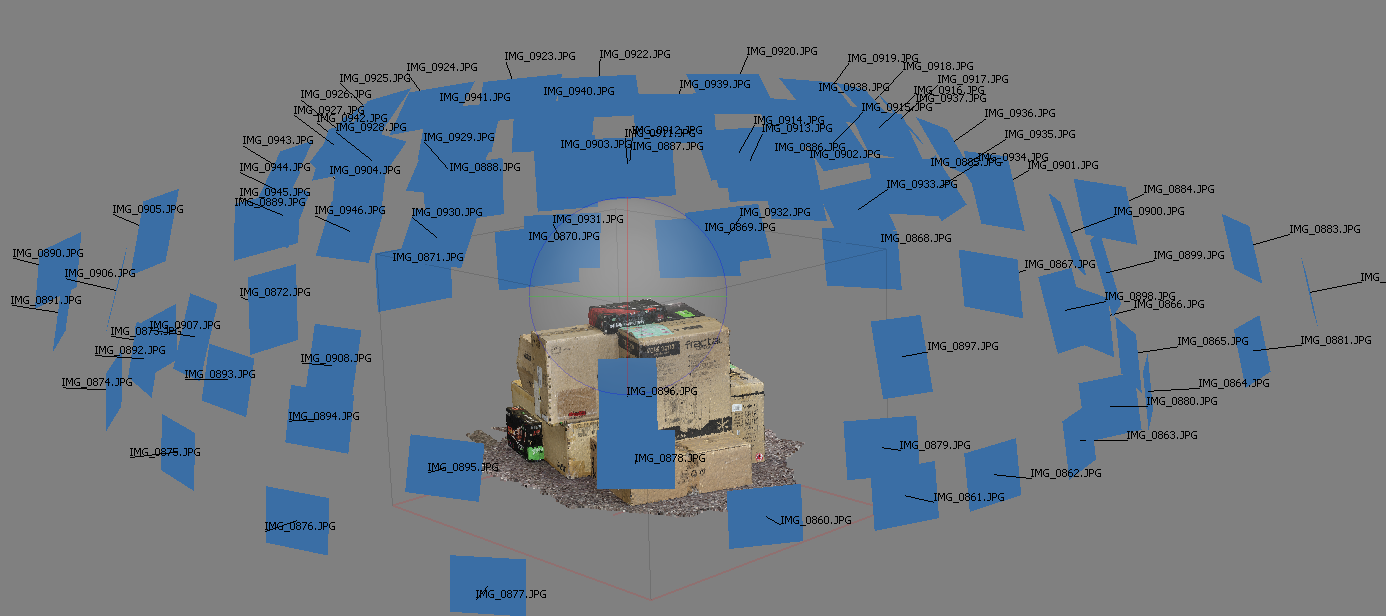
In our test, we take v1.3.3 of the software with a good sized data set of 84 x 18 megapixel photos and push it through a reasonably fast variant of the algorithms, but is still more stringent than our 2017 test. We report the total time to complete the process.
Agisoft’s Photoscan website can be found here: http://www.agisoft.com/
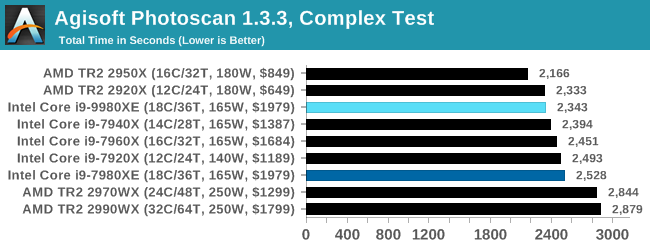
Photoscan is a mix of parallel compute and single threaded work, and the 9980XE does give another 7-8% performance over the 7980XE. The AMD dual-die TR2 parts still have the edge, however.


143 Comments
View All Comments
Stasinek - Wednesday, November 21, 2018 - link
It's indeed suprise to me that those new 24,32C AMD processors 2920,2970 are just worst in any therms than their 16C equivalents. In terms of perf/money perf/power just laughable.Linux changes a lot but who uses Linux and for what purpose?
I bet developers but what makes me really angry is that nobody even tries to use KVM, Xen, VirtualBox, VMware, VirtualBox as benchmarking tool for purpose of testing usage as small company server. In mine company lot of Remote Desktop sessions are connected to same server.
Someone would think - who needs good CPU? But it's only because dont used to solve real life problems and those problems are like importing big databases from obsolete programs, filtering, fixing and exporting to new ERP systems. This consumes lot of time to have fast CPU is crucial. Most of companies i know uses RDP server for that purpose and typical cheep portable laptops given to workers. To have AMD or Intel HDET tested in such purposes would be nice to see. Cause anyone can potencially have 32C anyone could benefit.. but rather than this kind test i used to see gaming.. gaming od HDET?! WTF
pandemonium - Wednesday, November 14, 2018 - link
All of these "my work doesn't have any desktop users" comments crack me up. Congratulations. Your work is not the entire world of computing in a professional space, much less prosumer space. Get over yourselves.halcyon - Wednesday, November 14, 2018 - link
@Ian CutressYour tests and review text are always a pleasure to read, thank you for the professionalism.
Questions related to the test suite (I know, everybody always wants something):
1. You are missing an Excel Spreadsheet calculation (Finance still uses a lot of these and they can peg all cores near 100% and be incredibly CPU dependent). Would be nice to see some for example an Excel Monte Carlo simulation kn the suite (local data)
2. Alternatively an R (language) based test for heavy statistical computation. Finding a one that is representative of real world workloads and strikes a balance between single core IPC and many core parallelisation might take some work. But this is one area where laptops just can't muster it and CUDA/OpenCL acceleration isn't often available at all.
3. For Web / JS framework it is nice to see SpeedoMeter and WebXPRT3, but for some reason V8 Web Tooling Bench is not there (https://v8.github.io/web-tooling-benchmark/ ). The old Kraken/JetStream/Octane are nice for reference, but not very representative of real world anymore for some time now (hence why they are abandoned).
Again thank you for this monumental work, the amount of tests is already superb!
For graphing results it would be so helpful to get a comparative price/perf graphed results browser (pick your baseline CPU, pick workloads, cpus on graph as a func of price/perf). This would enable auick viewinf of the efficient frontier in terms of price/perf for each workload and see the base CPU as an anchor.
Yeah, yeah, I know.... Just throwing this in here 😀
KAlmquist - Wednesday, November 14, 2018 - link
These benchmarks also show the 16 core TR 2950X beating the 18 core i9-9980XE in some cases.KAlmquist - Wednesday, November 14, 2018 - link
My previous comment was a reply to nexuspie's observation that, "These benchmarks show that the 9980's 18 cores often BEAT the 2990wx's 32 cores."Stasinek - Wednesday, November 21, 2018 - link
Witch should lead to conlcusion AMD Threadripper 2 is just bad offer except 2950.It's the one and only AMD CPU worh mentioning - witch means TR4 16C is dead end.
AMD offers overpriced CPUs on that platform that is for sure.
Overpriced because half of cores are choking being absolute useless.
If 32C and 4 channels is too much cores/channel imagine RYEN 3 16C on dual channel..
It will be big dissapointment for some people i bet.
Regardless of pricing Intel 9980 is just great.
Stasinek - Wednesday, November 21, 2018 - link
Is that what you wanted to say?crotach - Wednesday, November 14, 2018 - link
I have to say I'm a big fan of HEDT platforms, I built my last workstation in 2011 and it still serves me well 7 years later. But looking at this and the X299 offering I really don't see why anyone would bother.Lolimaster - Thursday, November 15, 2018 - link
Till intel changes the way it builds high core count cpu's they can't compete with AMD and it will be even worse next year when AMD made an already cheaper way to produce high core count cpu's even cheaper, to sick levels.Gasaraki88 - Thursday, November 15, 2018 - link
I'm actually more interested in the i7-9800X vs. the i9-9900K. I want to see how the overclocking is compared to the i9-9900K before I just in to X299.