Intel's 10nm Cannon Lake and Core i3-8121U Deep Dive Review
by Ian Cutress on January 25, 2019 10:30 AM ESTStock CPU Performance: Office Tests
The Office test suite is designed to focus around more industry standard tests that focus on office workflows, system meetings, some synthetics, but we also bundle compiler performance in with this section. For users that have to evaluate hardware in general, these are usually the benchmarks that most consider.
All of our benchmark results can also be found in our benchmark engine, Bench.
3DMark Physics: In-Game Physics Compute
Alongside PCMark is 3DMark, Futuremark’s (UL’s) gaming test suite. Each gaming tests consists of one or two GPU heavy scenes, along with a physics test that is indicative of when the test was written and the platform it is aimed at. The main overriding tests, in order of complexity, are Ice Storm, Cloud Gate, Sky Diver, Fire Strike, and Time Spy.
Some of the subtests offer variants, such as Ice Storm Unlimited, which is aimed at mobile platforms with an off-screen rendering, or Fire Strike Ultra which is aimed at high-end 4K systems with lots of the added features turned on. Time Spy also currently has an AVX-512 mode (which we may be using in the future).
For our tests, we report in Bench the results from every physics test, but for the sake of the review we keep it to the most demanding of each scene: Ice Storm Unlimited, Cloud Gate, Sky Diver, Fire Strike Ultra, and Time Spy.
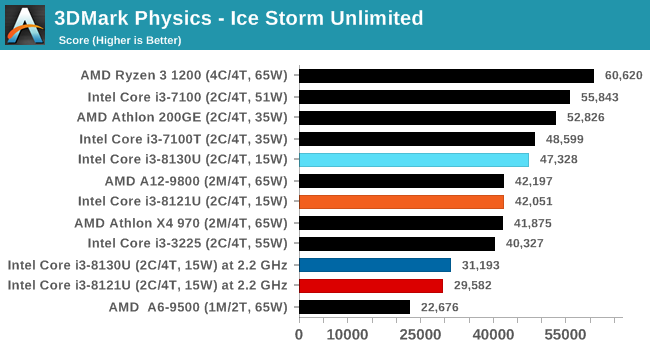
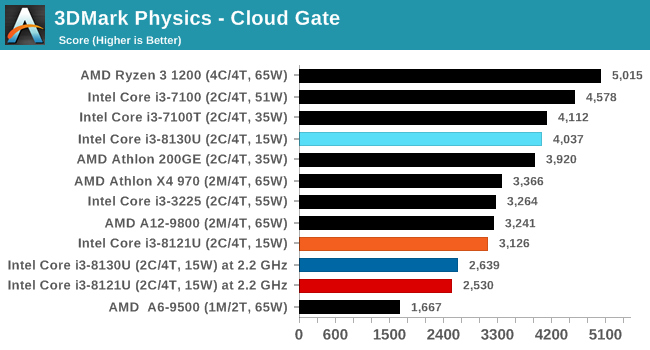
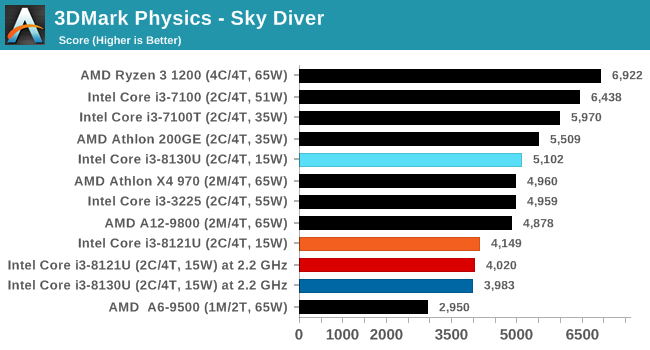
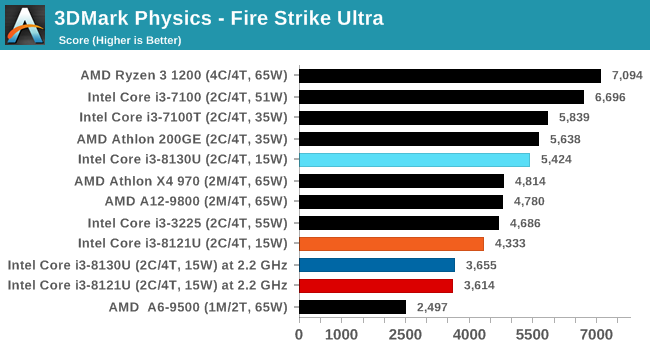
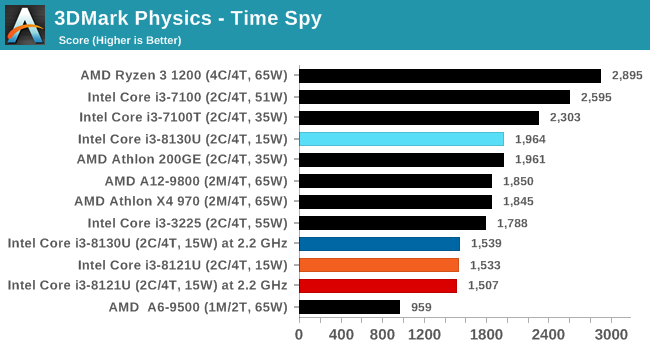
In all tests, at fixed frequency, the processors act identical, however at stock frequencies that Kaby Lake chip just has more headroom to push.
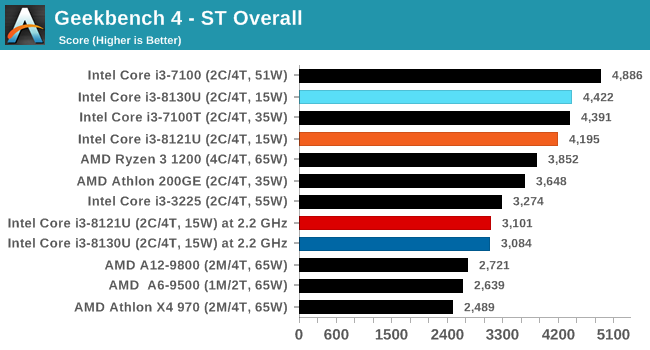
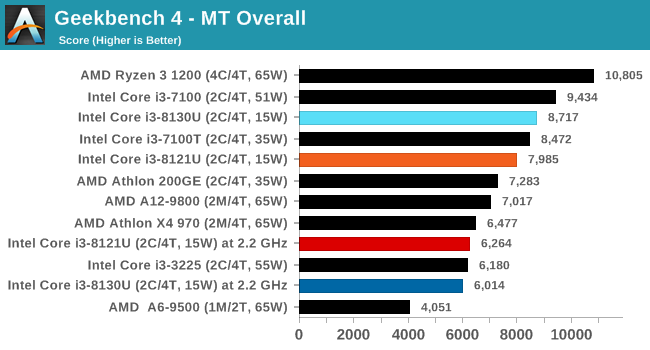
GeekBench4: Synthetics
A common tool for cross-platform testing between mobile, PC, and Mac, GeekBench 4 is an ultimate exercise in synthetic testing across a range of algorithms looking for peak throughput. Tests include encryption, compression, fast Fourier transform, memory operations, n-body physics, matrix operations, histogram manipulation, and HTML parsing.
I’m including this test due to popular demand, although the results do come across as overly synthetic, and a lot of users often put a lot of weight behind the test due to the fact that it is compiled across different platforms (although with different compilers).
We record the main subtest scores (Crypto, Integer, Floating Point, Memory) in our benchmark database, but for the review we post the overall single and multi-threaded results.


129 Comments
View All Comments
dgingeri - Saturday, January 26, 2019 - link
With Intel recently releasing the "F" SKUs for processors that don't have integrated graphics, I would think this processor would be a Core i3-8121FU.KOneJ - Sunday, January 27, 2019 - link
ROFL, mate. Though a UF line-up honestly wouldn't surprise me with where MCMs, TSVs, yields, iGPUs, and core counts are seemingly headed.Piotrek54321 - Saturday, January 26, 2019 - link
I would love an article on how quantum mechanical effects have to be taken into account at such small nodes.KOneJ - Sunday, January 27, 2019 - link
I would love to see the mathematics of quantum mechanics cleaned up to be more elegant and less Newtonian in nature.Rudde - Saturday, January 26, 2019 - link
I looked into the transistor density of different nodes and particularily the claim that Intel 10nm will feature "100 million transistors per square millimeter."Intel seems to historically lack in transistor density. 22nm has ~8 million per mm², while competing 28nm from GlobalFoundries have ~13 and TSMC has ~12.
Moving unto 14nm and all foundries double their transistor density. Intel goes to 15M/mm², GF to 24 (on a node bought from Samsung) and TSMC's 16nm also to 24M/mm².
TSMC's 7nm node has a density of ~40M/mm².
Now Intel has made two statements (both found in the first page of the article):
1. 100 million transistors per mm² or a 5.7x improvement.
2. A 2.7x improvement in density over 14nm, which gives 55M/mm². 55M/mm² would be consistent with Intel's claim of beating TSMC's 7nm.
Next I'm assuming my calculations about Intel's transistor density are wrong, and that both of Intels claims are true. In that case Intel's current 14nm would be 27M/mm². Now of course we can't assume my calculations about GF and TSMC are correct either and we are left without any conclusion.
Rudde - Saturday, January 26, 2019 - link
I jumped the gun too early and didn't proceed to page two that explains a lot of the same things as I tries to explain, but uses actual node data and not chip sizes.smalM - Saturday, January 26, 2019 - link
Page two doesn't use actual node data, it uses Intel propaganda ;-)KOneJ - Sunday, January 27, 2019 - link
Yep, they're not the only ones optimizing libraries. They're trying to muddle transistors with design compiling. While this is fair, it's not taking into account that others are working both halves of the problem as well. Clearly meant to be misleading.sidm2k11 - Saturday, January 26, 2019 - link
How is the fan noise on the PN60? Mine makes a pretty loud whine all the time and temperatures regularly cross 80 on full load...My 4010u Brix PC is whisper quiet by comparison.alacard - Saturday, January 26, 2019 - link
Well that was a wonderfully intricate review. Thank you.