The Intel 9th Gen Review: Core i9-9900K, Core i7-9700K and Core i5-9600K Tested
by Ian Cutress on October 19, 2018 9:00 AM EST- Posted in
- CPUs
- Intel
- Coffee Lake
- 14++
- Core 9th Gen
- Core-S
- i9-9900K
- i7-9700K
- i5-9600K
CPU Performance: Office Tests
The Office test suite is designed to focus around more industry standard tests that focus on office workflows, system meetings, some synthetics, but we also bundle compiler performance in with this section. For users that have to evaluate hardware in general, these are usually the benchmarks that most consider.
All of our benchmark results can also be found in our benchmark engine, Bench.
PCMark 10: Industry Standard System Profiler
Futuremark, now known as UL, has developed benchmarks that have become industry standards for around two decades. The latest complete system test suite is PCMark 10, upgrading over PCMark 8 with updated tests and more OpenCL invested into use cases such as video streaming.
PCMark splits its scores into about 14 different areas, including application startup, web, spreadsheets, photo editing, rendering, video conferencing, and physics. We post all of these numbers in our benchmark database, Bench, however the key metric for the review is the overall score.
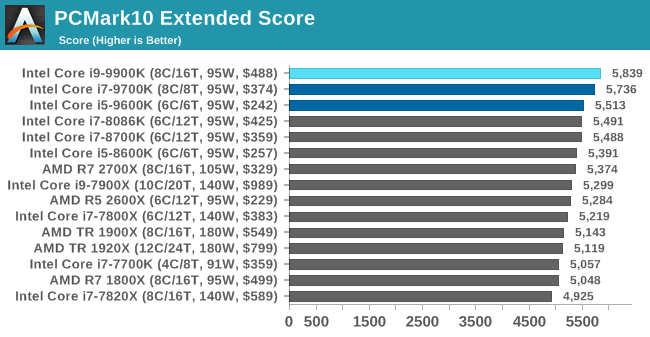
As a general mix of a lot of tests, the new processors from Intel take the top three spots, in order. Even the i5-9600K goes ahead of the i7-8086K.
Chromium Compile: Windows VC++ Compile of Chrome 56
A large number of AnandTech readers are software engineers, looking at how the hardware they use performs. While compiling a Linux kernel is ‘standard’ for the reviewers who often compile, our test is a little more varied – we are using the windows instructions to compile Chrome, specifically a Chrome 56 build from March 2017, as that was when we built the test. Google quite handily gives instructions on how to compile with Windows, along with a 400k file download for the repo.
In our test, using Google’s instructions, we use the MSVC compiler and ninja developer tools to manage the compile. As you may expect, the benchmark is variably threaded, with a mix of DRAM requirements that benefit from faster caches. Data procured in our test is the time taken for the compile, which we convert into compiles per day.
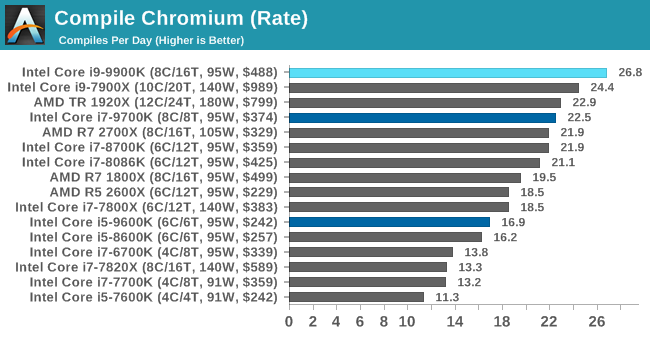
Pushing the raw frequency of the all-core turbo seems to work well in our compile test.
3DMark Physics: In-Game Physics Compute
Alongside PCMark is 3DMark, Futuremark’s (UL’s) gaming test suite. Each gaming tests consists of one or two GPU heavy scenes, along with a physics test that is indicative of when the test was written and the platform it is aimed at. The main overriding tests, in order of complexity, are Ice Storm, Cloud Gate, Sky Diver, Fire Strike, and Time Spy.
Some of the subtests offer variants, such as Ice Storm Unlimited, which is aimed at mobile platforms with an off-screen rendering, or Fire Strike Ultra which is aimed at high-end 4K systems with lots of the added features turned on. Time Spy also currently has an AVX-512 mode (which we may be using in the future).
For our tests, we report in Bench the results from every physics test, but for the sake of the review we keep it to the most demanding of each scene: Ice Storm Unlimited, Cloud Gate, Sky Diver, Fire Strike Ultra, and Time Spy.
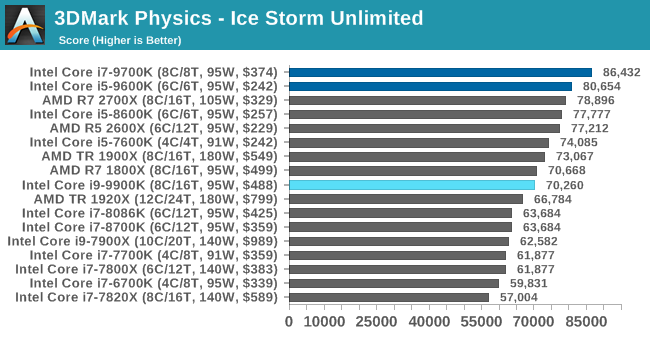
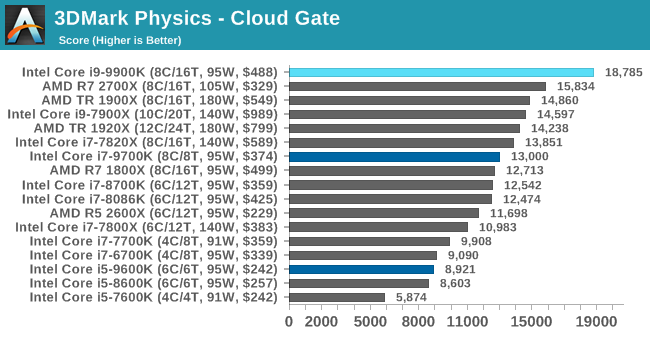
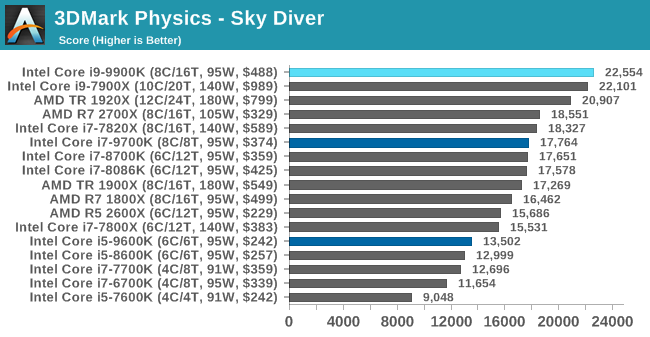
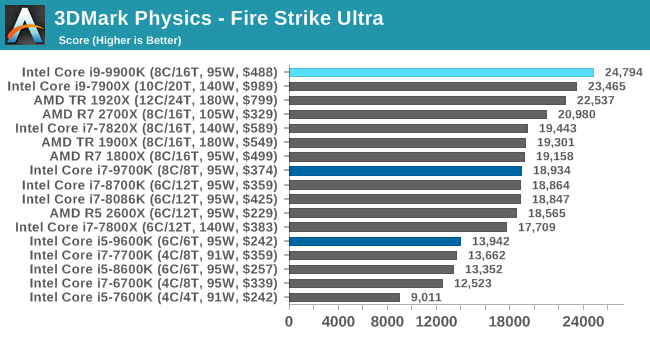
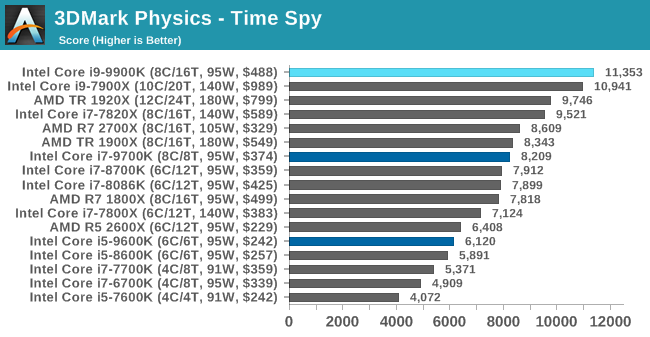
The older Ice Storm test didn't much like the Core i9-9900K, pushing it back behind the R7 1800X. For the more modern tests focused on PCs, the 9900K wins out. The lack of HT is hurting the other two parts.
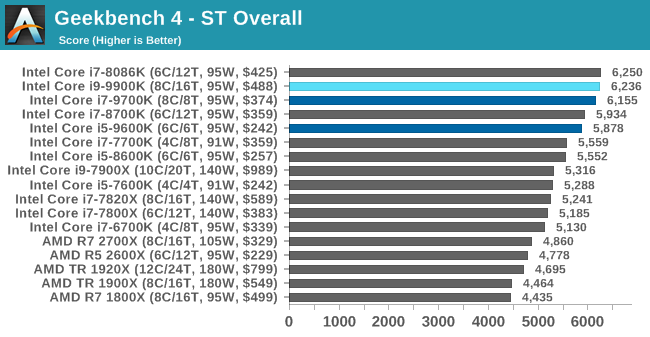
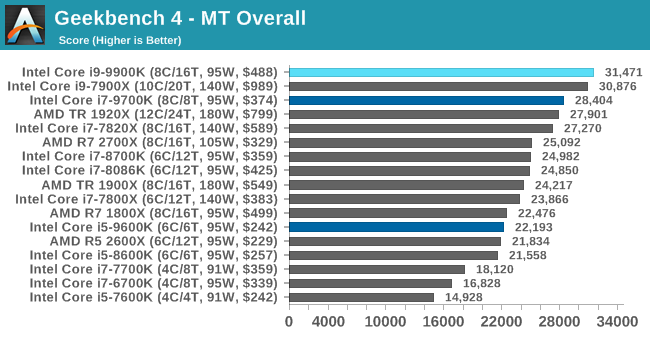
GeekBench4: Synthetics
A common tool for cross-platform testing between mobile, PC, and Mac, GeekBench 4 is an ultimate exercise in synthetic testing across a range of algorithms looking for peak throughput. Tests include encryption, compression, fast Fourier transform, memory operations, n-body physics, matrix operations, histogram manipulation, and HTML parsing.
I’m including this test due to popular demand, although the results do come across as overly synthetic, and a lot of users often put a lot of weight behind the test due to the fact that it is compiled across different platforms (although with different compilers).
We record the main subtest scores (Crypto, Integer, Floating Point, Memory) in our benchmark database, but for the review we post the overall single and multi-threaded results.


274 Comments
View All Comments
AutomaticTaco - Saturday, October 20, 2018 - link
Revised. TDP is still some generic average not true max. Regardless, not 220w.https://www.anandtech.com/show/13400/intel-9th-gen...
The motherboard in question was using an insane 1.47v
https://twitter.com/IanCutress/status/105342741705...
https://twitter.com/IanCutress/status/105339755111...
dezonio2 - Friday, October 19, 2018 - link
I would love to see overclocking performance of the 9600k. It would show exactly how much of a difference the upgraded TIM makes if compared to 8600k.emn13 - Friday, October 19, 2018 - link
That power consumption seems pretty crazy. Going from 4.5 to 5Gz for +56% powerdraw? or worse, from 5.0 to 5.3GHz for 6% clock boost and +40% powerdraw?This proc looks like it makes sense at 4.5GHz; beyond that - not much. I mean going from 4.5 to 5.3 isn't nothing - 18% more clocks! But that's going to translate into less-than-that performance gain, and even 18%, while admirable and all, is often not actually all that noticeable - unlike that powerdraw, which you'll likely notice in terms of noise and effort to get the system cooled at all.
I don't know; this proc looks... cool... but borderline. I'm not sure I'd buy it, even if money were no object (and since I'd consider this for work - it basically isn't).
Tkan2155 - Saturday, October 20, 2018 - link
Yes bill add up this prepare big wallet . amd can overclock higher but it's better at stock . intel is going over limit because they want to show the world they are the bestmapesdhs - Sunday, October 21, 2018 - link
But then, the candle that burns twice as brightly burns half as long. :)MonkeyPaw - Friday, October 19, 2018 - link
In regards to TDP, I say use your own methodology and ratings if Intel and AMD can’t arrive at a standard measure. Based on how the i9 truly performs in this regard, the 95W rating is just shy of disingenuous. When real world values are applied it does change where this CPU sits in regard to its overall value. Lots of performance? Yes, but it comes at a significant cost. These CPUs aren’t like GPUs, where the cooling solution is designed to match the limits of the GPU. No, Intel doesn’t even bundle a cooler, because they know they have nothing to offer to hit boost speeds, and let’s be real—it’s the boost speeds that help sell this product and yield bragging rights.pavag - Friday, October 19, 2018 - link
It doesn't have a price/performance chart, so it is hard to tell how justifiable is to spend on this processor, compared to alternatives, and that's the main purpose of reading this kind of articles.Here is one from TomsHardware, for reference:
https://img.purch.com/r/711x457/aHR0cDovL21lZGlhLm...
It makes clear that is little to gain from a cheap i5-8400 to an i9-9900K, and it also tells which processors are better performing at a given price, or cheaper at a given performance. At least from an average FPS gaming viewpoint.
WinterCharm - Friday, October 19, 2018 - link
Well written. Great article, and I enjoyed it thoroughly :)Machinus - Friday, October 19, 2018 - link
Can you test the power draw and temperatures of the 9900 with HT disabled, and compare that to the 9700 under the same conditions?Felice - Saturday, October 20, 2018 - link
Ryan--Any chance of you doing the same run with the 9900K's hyperthreading disabled? A lot of gamers find they get better performance without hyperthreading.