The Kingston HyperX Fury RGB SSD Review: Bright Idea, Dimmed Performance
by Billy Tallis on September 24, 2018 8:35 AM ESTMixed Random Performance
Our test of mixed random reads and writes covers mixes varying from pure reads to pure writes at 10% increments. Each mix is tested for up to 1 minute or 32GB of data transferred. The test is conducted with a queue depth of 4, and is limited to a 64GB span of the drive. In between each mix, the drive is given idle time of up to one minute so that the overall duty cycle is 50%.
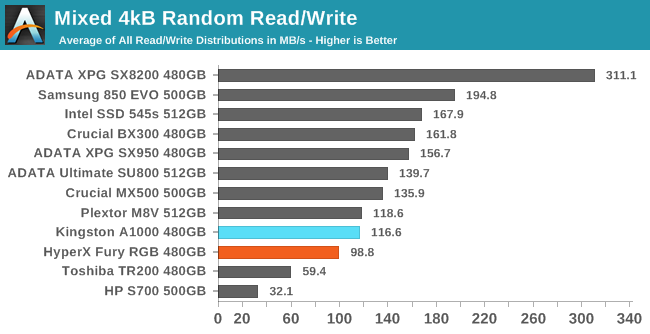
None of the drives in this batch that use Toshiba's BiCS3 3D TLC perform all that well on the mixed random I/O test. The Plextor M8V shows that the HyperX Fury RGB could do a bit better, but at least the Fury RGB is well ahead of the DRAMless Toshiba TR200 on this test.
 |
|||||||||
| Power Efficiency in MB/s/W | Average Power in W | ||||||||
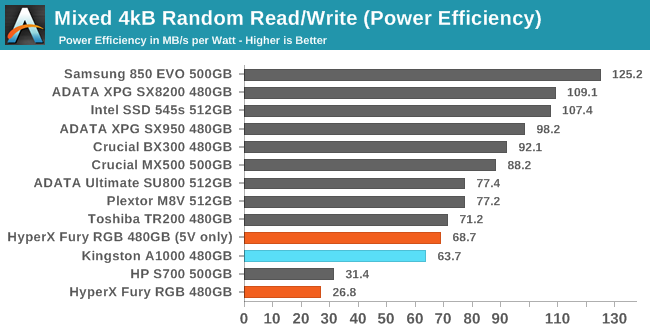
When excluding the power used by the LEDs, the Fury RGB uses a bit less power on this test than most mainstream SATA SSDs. But the performance is low enough that the efficiency rating is still substantially lower than mainstream competition like the Crucial MX500.
 |
|||||||||
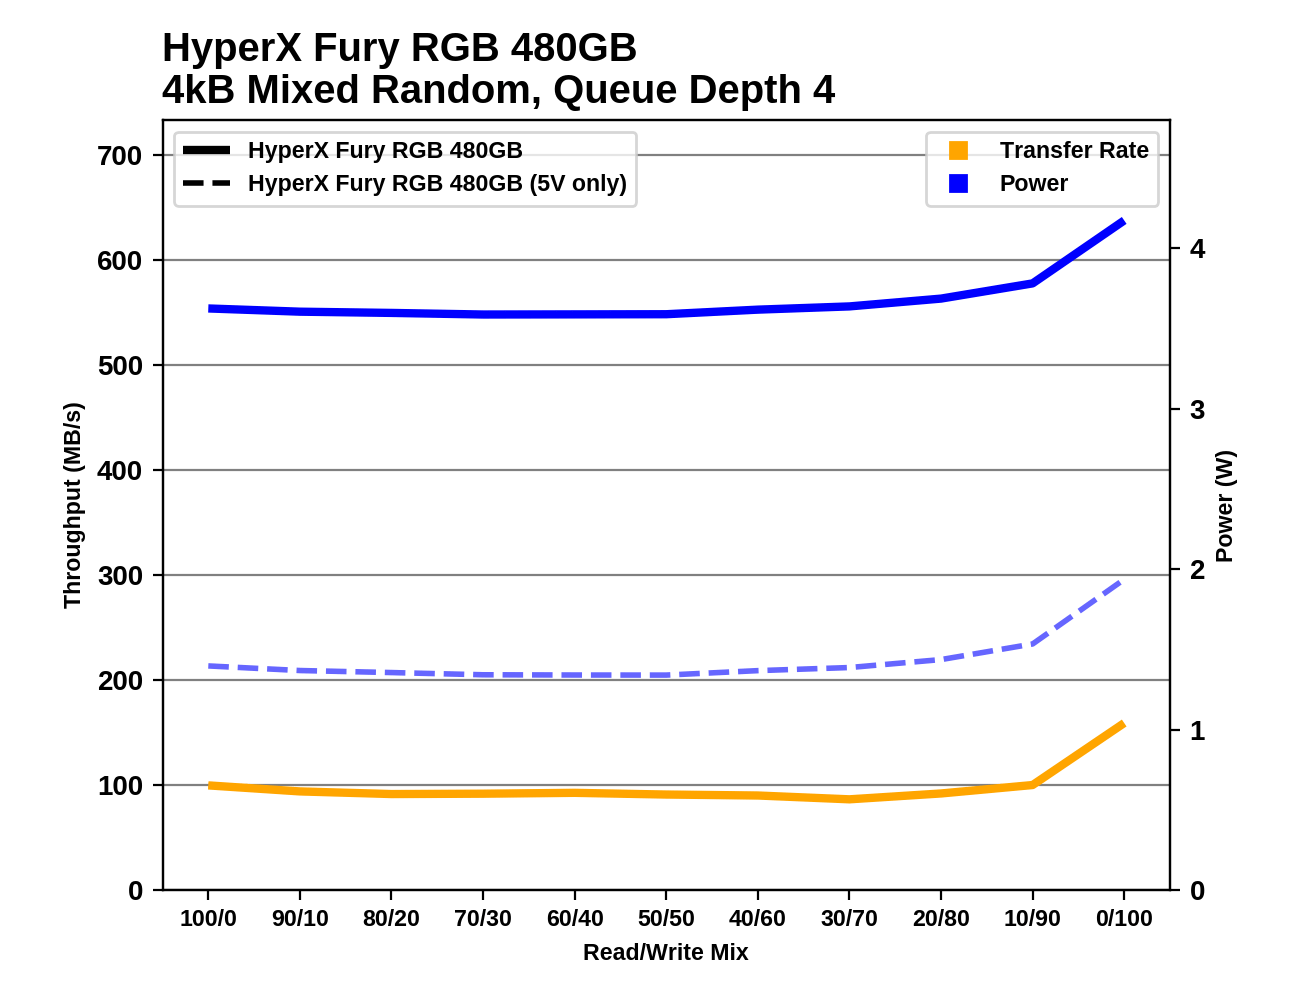
The performance and power consumption of the Fury RGB on the mixed random I/O test are both fairly steady throughout the test save for the typical jump at the end of the test when the workload shifts to pure random writes. Most mainstream drives deliver gradually increasing performance over the course of the test as the proportion of writes increases, and even some of the other BiCS3-based drives make significant gains during the last third of the test.
Mixed Sequential Performance
Our test of mixed sequential reads and writes differs from the mixed random I/O test by performing 128kB sequential accesses rather than 4kB accesses at random locations, and the sequential test is conducted at queue depth 1. The range of mixes tested is the same, and the timing and limits on data transfers are also the same as above.
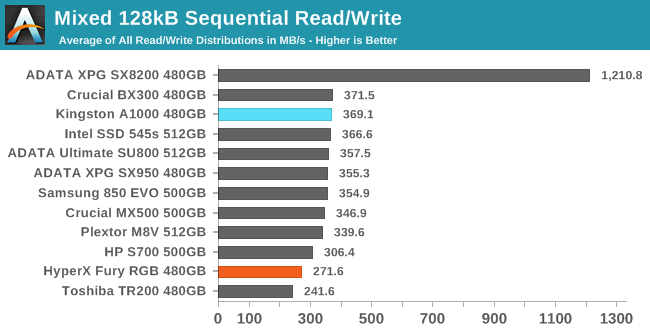
On the mixed sequential I/O test we again see the HyperX Fury RGB performing like a DRAMless SSD with at least 20% lower performance than most mainstream SATA SSDs.
 |
|||||||||
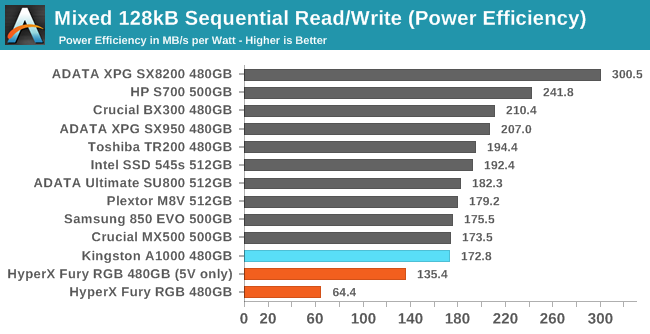
| Power Efficiency in MB/s/W | Average Power in W | ||||||||
The storage side of the Fury RGB consumes the normal amount of power for a mainstream SATA SSD on this test, so ends up with a clear last-place efficiency score. The DRAMless drives that perform similarly to the Fury RGB consume much less power and have above-average efficiency.
 |
|||||||||
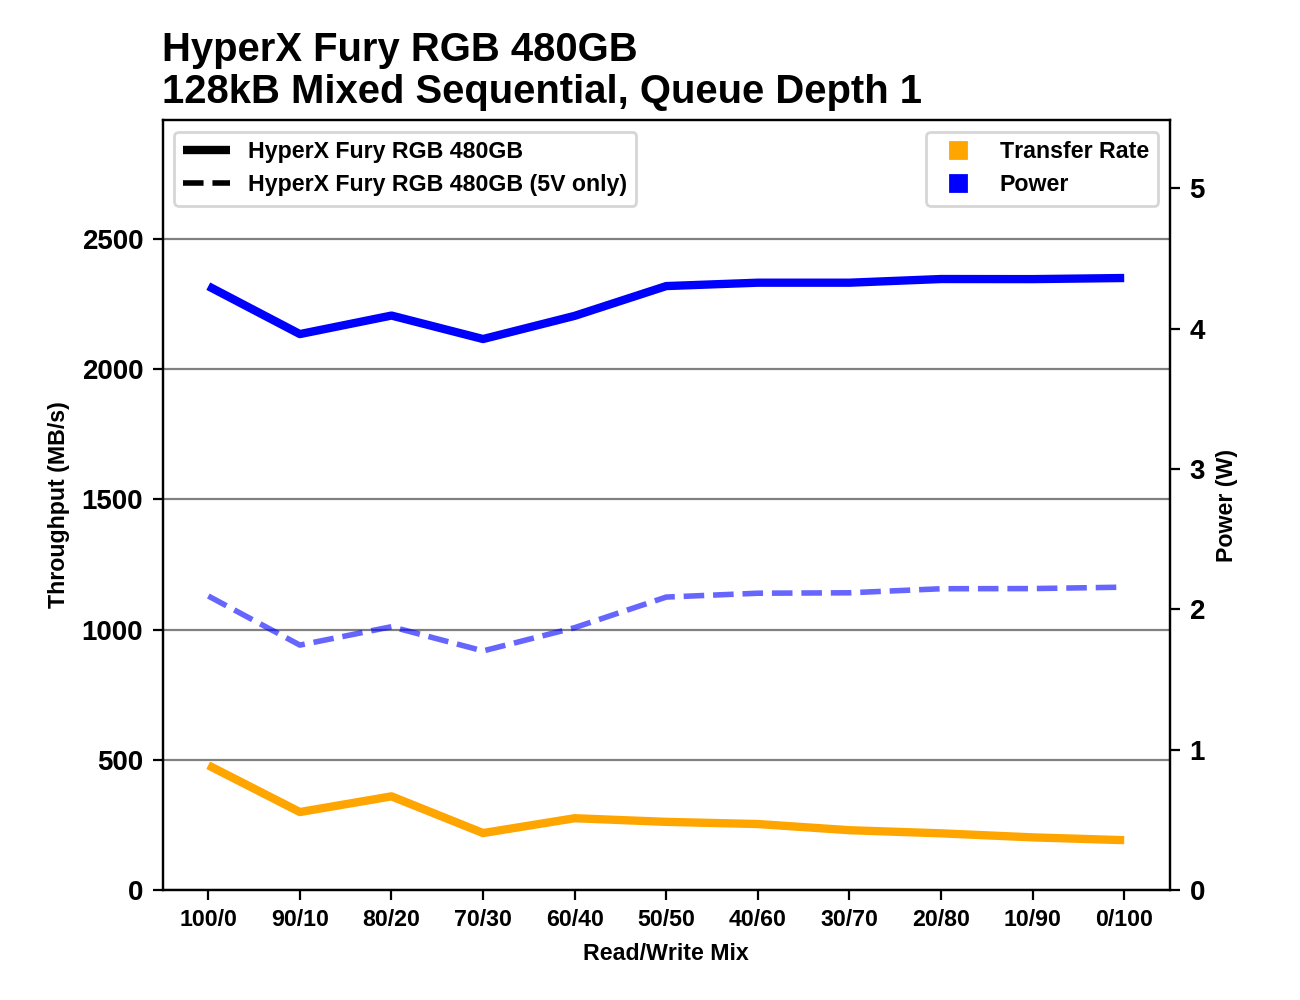
During the first third of the mixed sequential I/O test the performance of the HyperX Fury RGB is inconsistent. As the proportion of writes in the workload increases, the drive settles down into a gradual decline in performance that keeps it just above the Toshiba TR200.


45 Comments
View All Comments
Billy Tallis - Tuesday, September 25, 2018 - link
Did I mention that it also weighs 4 times what a normal SATA SSD weighs?qlum - Tuesday, September 25, 2018 - link
Yikes,At least it's ticker so it probably won't fit
eastcoast_pete - Tuesday, September 25, 2018 - link
So, this Kingston Fury thing has lot's of LED bling that is not only useless, but negatively affects performance of the SSD, never mind the crazy price point - I guess Kingston moved officially from ridiculous to ludicrous on this one.I wonder if Kingston's marketing folks have estimated the damage this RGB turd of an SSD will do to their overall reputation as a serious player in the memory and parts world. Going forward, I will think more than once about buying RAM, drives or USB sticks from Kingston, as that company seems to be more about appearance than performance.
aiiks - Friday, March 22, 2019 - link
This thing flat out fails at post on a dell poweredge. I have 4 of them. have to reseat them when the os is running to make it work againjmthegreat123 - Saturday, May 4, 2019 - link
any solutions? i've tried removing the rgb header tho it still warms but i don't have encountered problems with system freezing yet.