The Silicon Motion SM2262EN SSD Controller Preview: Good And Bad Amplified
by Billy Tallis on August 1, 2018 11:45 AM ESTSequential Read Performance
Our first test of sequential read performance uses short bursts of 128MB, issued as 128kB operations with no queuing. The test averages performance across eight bursts for a total of 1GB of data transferred from a drive containing 16GB of data. Between each burst the drive is given enough idle time to keep the overall duty cycle at 20%.
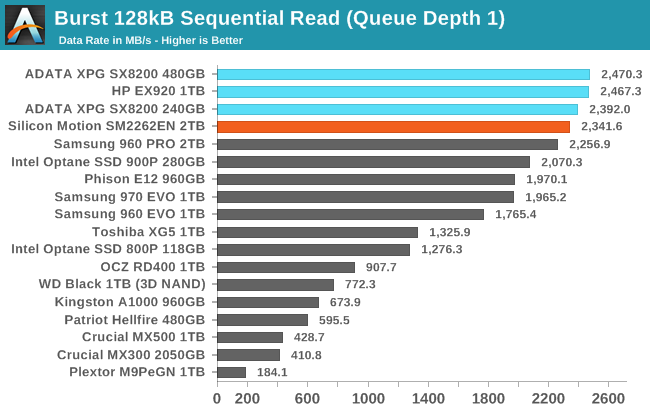
The burst sequential read performance from the Silicon Motion SM2262EN is slightly below what we've measured for earlier SM2262 drives, but it's still well ahead of any competing TLC drive.
Our test of sustained sequential reads uses queue depths from 1 to 32, with the performance and power scores computed as the average of QD1, QD2 and QD4. Each queue depth is tested for up to one minute or 32GB transferred, from a drive containing 64GB of data. This test is run twice: once with the drive prepared by sequentially writing the test data, and again after the random write test has mixed things up, causing fragmentation inside the SSD that isn't visible to the OS. These two scores represent the two extremes of how the drive would perform under real-world usage, where wear leveling and modifications to some existing data will create some internal fragmentation that degrades performance, but usually not to the extent shown here.
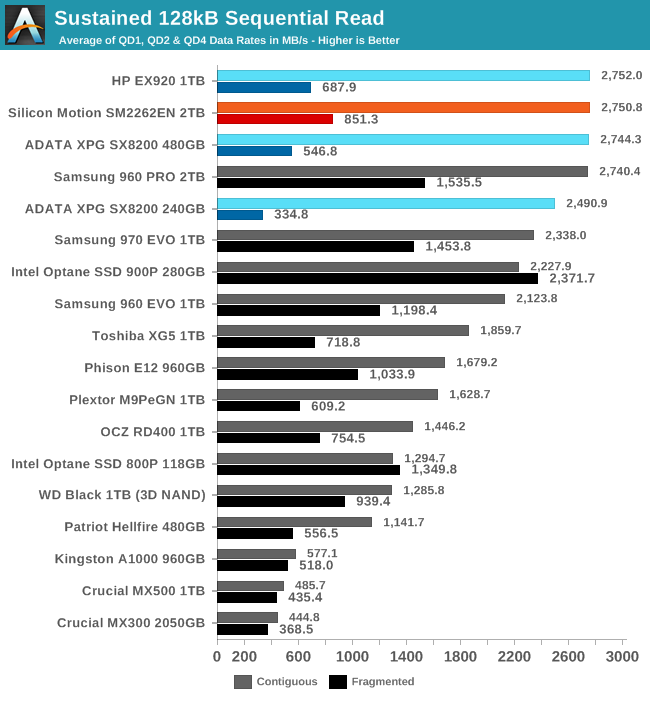
The sustained sequential read performance of the SM2262EN is identical to the SM2262 drives we've tested, and tied with the Samsung 960 PRO. The 2TB -EN drive has better performance than the SM2262 drives when reading from a drive with severe internal fragmentation, but there's still a lot of room for improvement here.
 |
|||||||||
| Power Efficiency in MB/s/W | Average Power in W | ||||||||
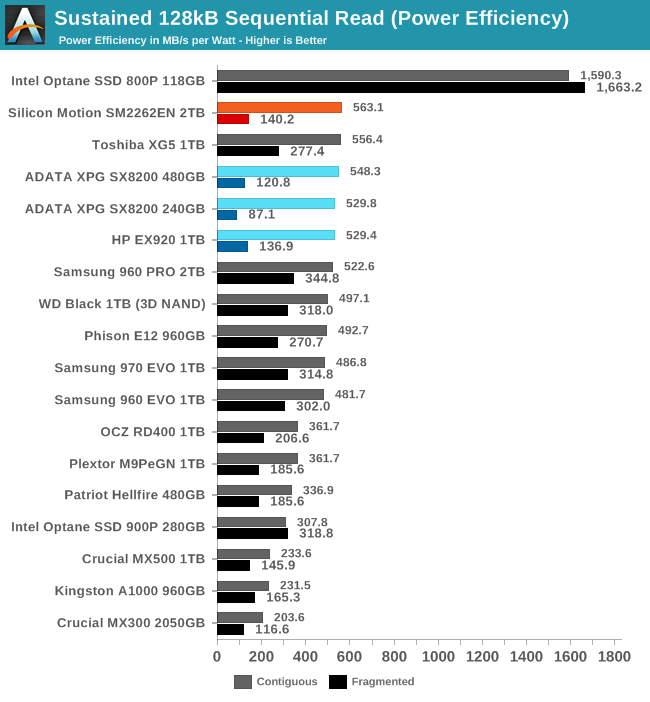
Power efficiency from the SM2262 drives was already very good on this test, and the SM2262EN brings an incremental improvement. Efficiency when reading from a drive with internal fragmentation is also slightly improved, but overall power consumption in that case is now over 6W, which is pushing it a bit for an M.2 drive that is being fed by only a 3.3V supply.
 |
|||||||||
The SM2262 drives hit their full sequential read at QD2, but the SM2262EN takes a bit longer to get up to its limit. The eventual performance is only a little bit shy of the 3.5GB/s that Silicon Motion's specifications promised.
Sequential Write Performance
Our test of sequential write burst performance is structured identically to the sequential read burst performance test save for the direction of the data transfer. Each burst writes 128MB as 128kB operations issued at QD1, for a total of 1GB of data written to a drive containing 16GB of data.
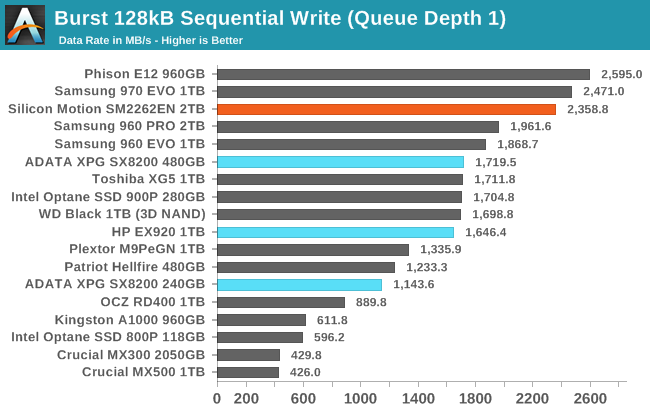
The burst sequential write speed of the SM2262EN is a substantial jump over what the plain SM2262 provides, but it's not quite enough to put the -EN at the top of the chart. The upcoming Phison E12 holds on to that spot for now, and the Samsung 970 EVO is also still ahead of the SM2262EN.
Our test of sustained sequential writes is structured identically to our sustained sequential read test, save for the direction of the data transfers. Queue depths range from 1 to 32 and each queue depth is tested for up to one minute or 32GB, followed by up to one minute of idle time for the drive to cool off and perform garbage collection. The test is confined to a 64GB span of the drive.
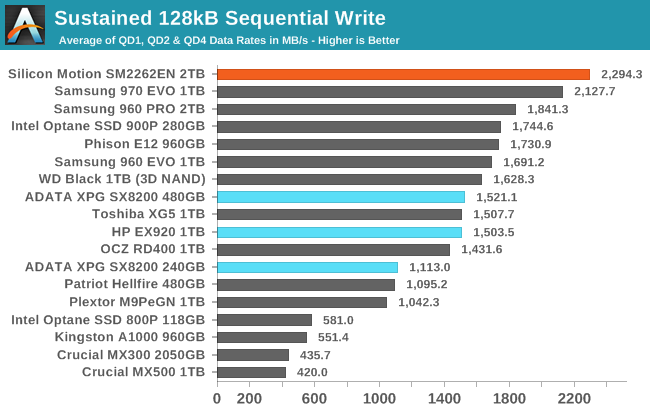
The SM2262EN does manage to take first place on the longer sequential write test, though some of this may be due to its capacity advantage over most of the other drives we have available to compare against. The 2TB 970 EVO is likely quite close to the SM2262EN, given how the 1TB 970 EVO performs.
 |
|||||||||
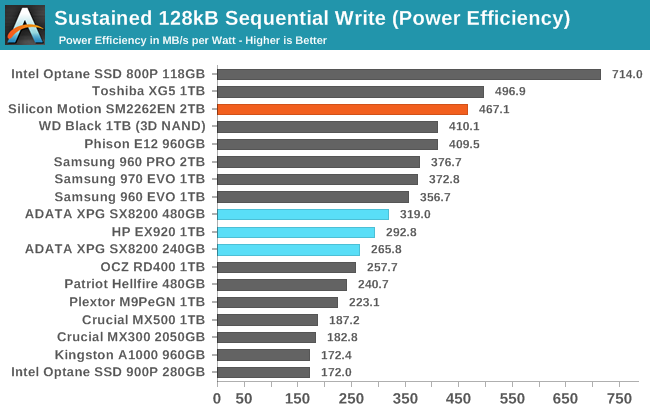
| Power Efficiency in MB/s/W | Average Power in W | ||||||||
The SM2262EN provides a 50% performance boost over its predecessor while dropping power consumption by a quarter of a Watt relative to the 1TB HP EX920, so it is no surprise to see the efficiency score leap upwards. Silicon Motion is now ahead of the WD Black and the Phison E12, and is almost as efficient as the much slower Toshiba XG5.
 |
|||||||||
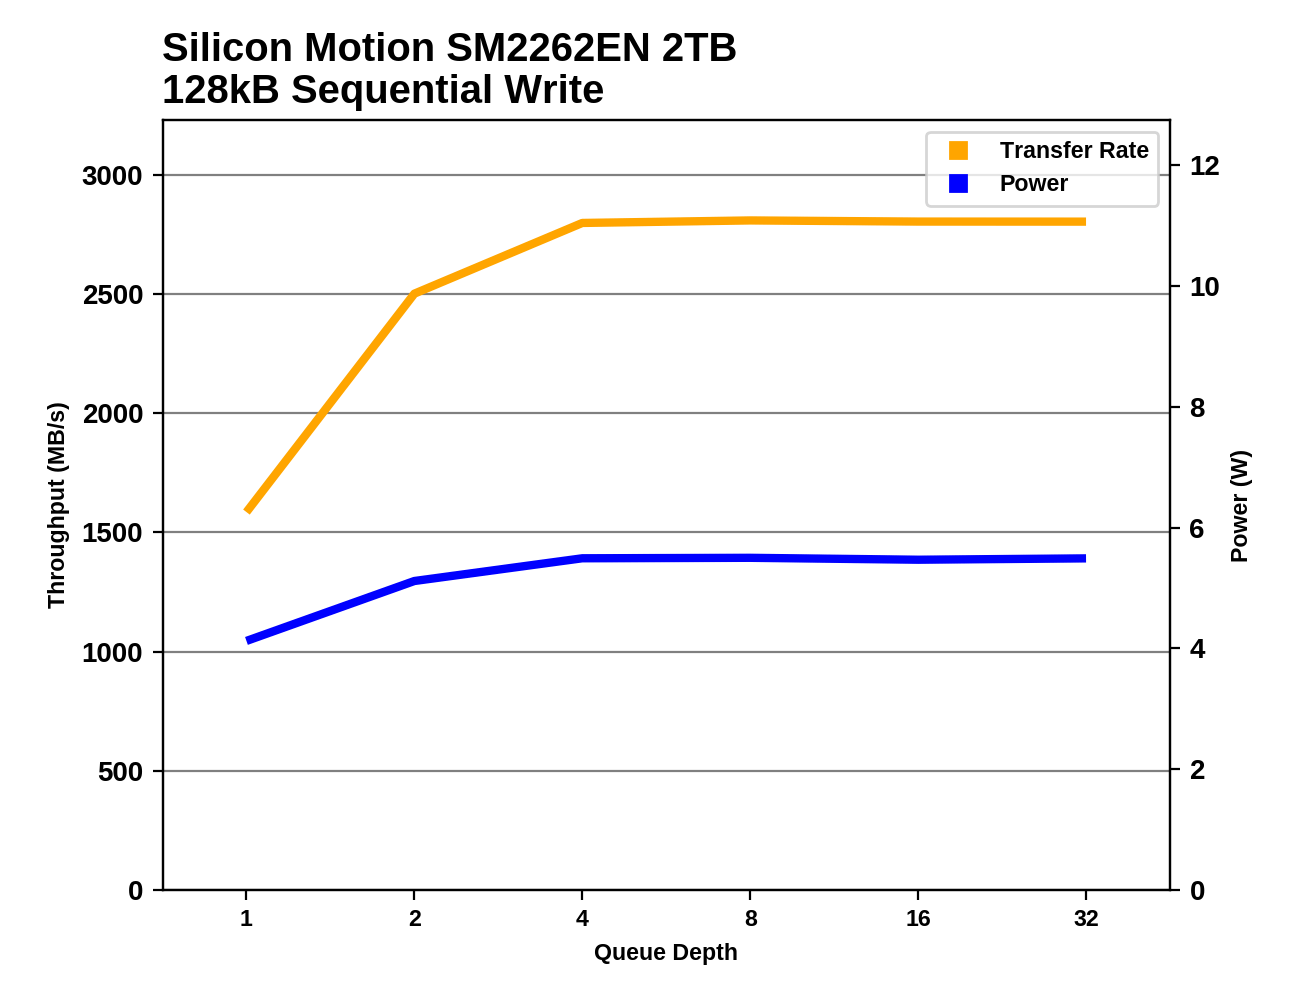
The SM2262EN takes a bit longer to reach its full sequential write speed than most drives, saturating only at QD4 or higher. But it would probably still be in first place among TLC drives if its performance stopped increasing at QD2 where it has a slight advantage over the 1TB 970 EVO.


28 Comments
View All Comments
Death666Angel - Thursday, August 2, 2018 - link
I don't read it that way, but okay. :) I don't have a definitve cost breakdown of an SSD. But my best guess is NAND is still the factor #1 and goes up with capacity. #2 would be the controller or the RAM, depending on size of the SSD, which usually correlates with the size of the RAM. But controllers can cost a few dollars or a few tens of dollars, so that is still a relevant number in pricing of an SSD. Samsung and WD price their drives that way. because they can, so far.FunBunny2 - Friday, August 3, 2018 - link
well, here's the problem. if you're an economist, then marginal cost is the driver of price in a competitive market. whether that's true for SSD/SSDparts is murky. for the accountant/MBA types, average cost drives price, regardless of market.now, the crunchy aspect of correlating cost to price is the production process. in the 19th century, labor was a significant component of cost and thus price. demand slackens, fire people to keep both costs more or less stable. demand increases, hire for the same effect.
in the 21st century, with SSD/SSDparts, there's virtually no labor in direct production, so marginal cost is near 0; ergo the econ types say to drop price to move more product. the accountant/MBA types recognize that most of average cost, while higher than marginal, is mostly amortization of R&D and capital equipment (all those new fabs AT has been reporting on, recall?). even they understand that the decision is the same as the econ, a very rare event: the only way to make money is to move more product and drive down average cost. but they can only do this is demand increases. and that can only happen if end-user product vendors can 1) more ways to use the parts, and 2) people have more money to buy the end-user product.
1) is largely a substitution exercise; i.e. a zero-sum game among end-user product vendors. there's no growth in aggregate demand for end-user product, thus none for SSD/SSDparts. nobody wins.
2) is a purely macro-economic phenomenon, and thus dependent on the 'middle class' having more moolah to spend on more bling. you can see where this is going? with right-wing governments driving income concentration, aggregate demand eventually collapses. this is exactly what created the Great Recession.
end-user product vendors can't directly move 2), all they can do is encourage their governments to spread the wealth so that aggregate demand can grow, and they can sell more product. on the whole, they haven't shown the smarts to see where their bread is buttered. as labor cost diminishes, just firing bodies gains you less and less until it gains you nothing. growth in highly capitalized production economies of the 21st century doesn't work as it did in the primitive 19th.
greggm2000 - Thursday, August 2, 2018 - link
What I'd really like to see are SSD tests done on an (user) encrypted drive. Would performance be equivalent to a fully filled drive? I imagine this would be a fairly common use case?Billy Tallis - Thursday, August 2, 2018 - link
Software encryption does technically leak information if it uses TRIM commands or otherwise signals to the drive what data is and isn't valid. It also imposes performance overhead from doing the encryption on the CPU . There aren't many reasons to justify using software full-drive encryption on a SSD when self-encrypting SSDs are so common (Samsung, Crucial MX, etc).Icehawk - Saturday, August 4, 2018 - link
Is Opal effected by this? What performance cost is there? We’ve got whopping laptop at woro with it enabled buy I’d like to push us in a more secure direction. Would probably help our PCI score too.Chaser - Sunday, August 5, 2018 - link
I wish someone would build a review site that includes SSDs that writes reviews based upon a an average PC gamer's performance perspective. I myself have tested the Evo 860, the 970 EVO, Optane 900, the XPG SX8200, and the Patriot Hellfire. Like many other revealing Youtube videos that compare these drives most often the Evo 860 is either faster at loading a game, the same or very slightly slower. While I understand that Anandtech has readers that are looking at higher usage scenarios, I'd venture to say MOST of their readers are in the former category.As it stands today with most similar sites we see chart after chart of benchmarks on multiple pages. We read about accolades on random and sequential performance. Some sites rank the drives from 1-10. But in the end, the user experience differences prove to be negligible for most users and a simple article like that probably would entice site visits to read through the hairsplitting benchmarks.
KAlmquist - Sunday, August 5, 2018 - link
I'll repeat something Billy Tallis stated in a comment and probably should incorporate into the text of the review: “I did run the Heavy and Light tests on this drive with it 80% full and the results were similar to the 100% full case.”When I partition an SSD, I've always left a bit of space unused in order to effectively increase the spare area to 20% or so. That improved performance consistency with older SSD designs. With the SM2262EN, it might still reduce write amplification, but not enough to substantially affect performance.
kensiko - Wednesday, January 9, 2019 - link
I'm hesitating between the AData XPG SX8200 (SM2262) and the pro one (SM2262EN), 50 CAD$ difference. Any opinion ?