The Silicon Motion SM2262EN SSD Controller Preview: Good And Bad Amplified
by Billy Tallis on August 1, 2018 11:45 AM ESTRandom Read Performance
Our first test of random read performance uses very short bursts of operations issued one at a time with no queuing. The drives are given enough idle time between bursts to yield an overall duty cycle of 20%, so thermal throttling is impossible. Each burst consists of a total of 32MB of 4kB random reads, from a 16GB span of the disk. The total data read is 1GB.
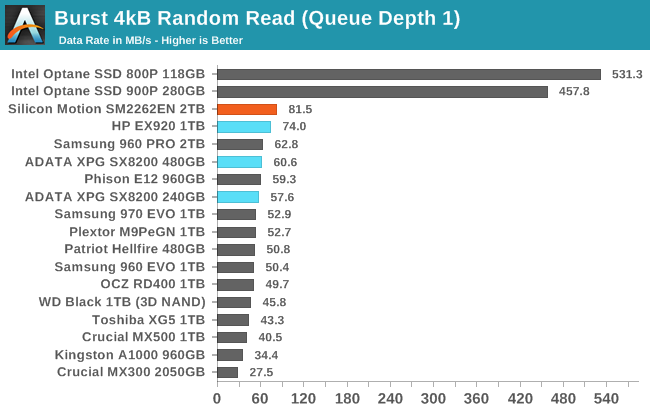
The 2TB SM2262EN drive expands on Silicon Motion's lead in random read performance with a 10% increase over the 1TB HP EX920's QD1 burst performance.
Our sustained random read performance is similar to the random read test from our 2015 test suite: queue depths from 1 to 32 are tested, and the average performance and power efficiency across QD1, QD2 and QD4 are reported as the primary scores. Each queue depth is tested for one minute or 32GB of data transferred, whichever is shorter. After each queue depth is tested, the drive is given up to one minute to cool off so that the higher queue depths are unlikely to be affected by accumulated heat build-up. The individual read operations are again 4kB, and cover a 64GB span of the drive.
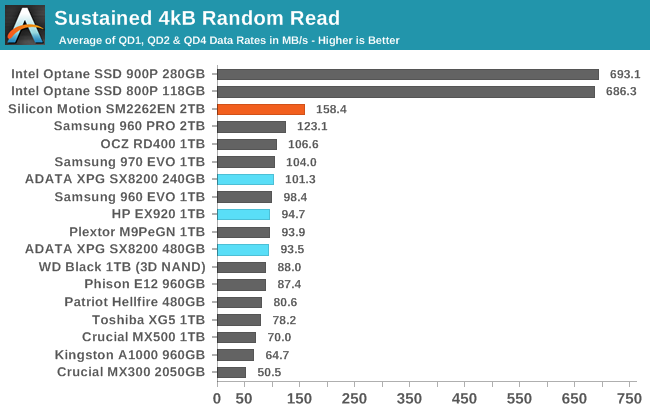
On the sustained random read test, the SM2262EN's standing is even better. Its predecessors were not able to beat the Samsung 970 PRO or MLC drives on the longer random read test, but the -EN does so with ease.
 |
|||||||||
| Power Efficiency in MB/s/W | Average Power in W | ||||||||
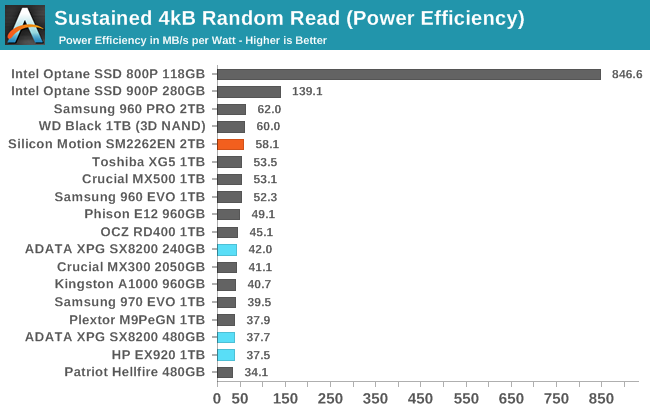
The power consumption of the SM2262EN is a bit higher than for the SM2262 drives, which makes it the most power-hungry M.2 drive in this batch. But the performance is high enough that the efficiency score climbs to almost tie the best flash-based SSDs while the older SM2262 drives had quite poor scores here.
 |
|||||||||
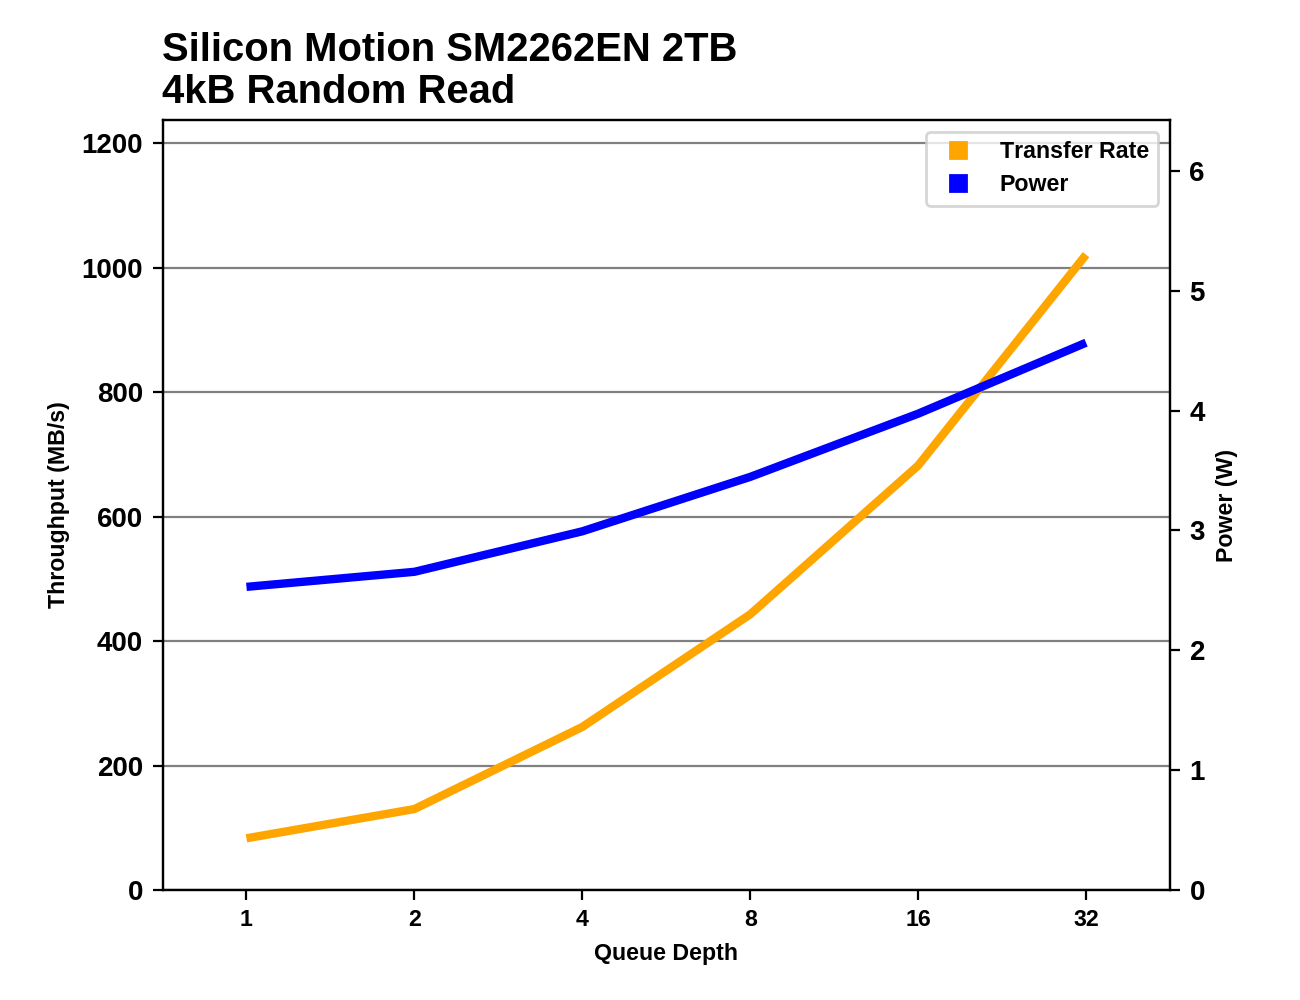
The SM2262EN's lead seems to be strongest at low queue depths, which is what's most important for consumer workloads. The Samsung 960 PRO passes the SM2262EN at QD8 and the 970 EVO and WD Black are closing in at higher queue depths. By QD32 the SM2262EN is approaching the throughput of Intel's Optane SSDs.
Random Write Performance
Our test of random write burst performance is structured similarly to the random read burst test, but each burst is only 4MB and the total test length is 128MB. The 4kB random write operations are distributed over a 16GB span of the drive, and the operations are issued one at a time with no queuing.
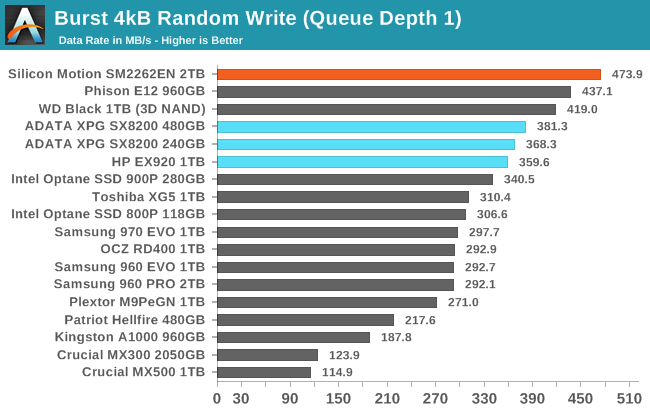
The SM2262EN takes first place in the burst random write test, showing that it has the fastest SLC write cache. It is 8% faster than the Phison E12 engineering sample we tested and 25-30% faster than the SM2262 drives we have tested.
As with the sustained random read test, our sustained 4kB random write test runs for up to one minute or 32GB per queue depth, covering a 64GB span of the drive and giving the drive up to 1 minute of idle time between queue depths to allow for write caches to be flushed and for the drive to cool down.
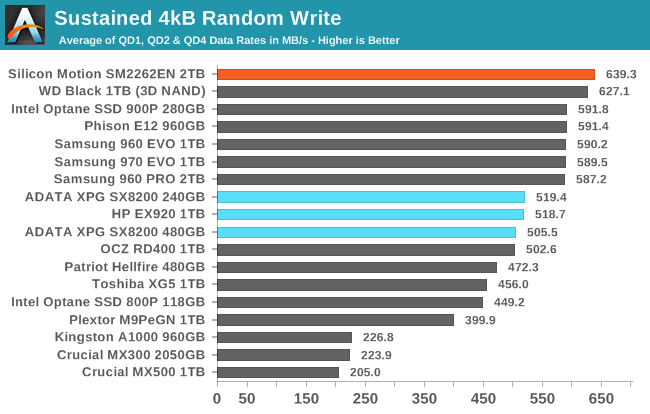
On the longer random write test, the SM2262EN hangs on to first place, though with a much narrower lead of about 2% over the WD Black. The test is still short enough to be working only with the SLC write cache for the 2TB SM2262EN drive.
 |
|||||||||
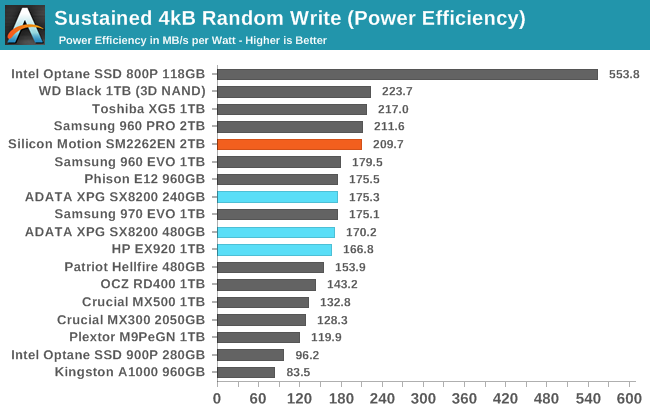
| Power Efficiency in MB/s/W | Average Power in W | ||||||||
The performance boost the SM2262EN brings is enough to boost its efficiency score into the top tier, though it still isn't quite matching the efficiency of the WD Black. In absolute terms, power consumption is actually slightly lower than the 1TB HP EX920.
 |
|||||||||
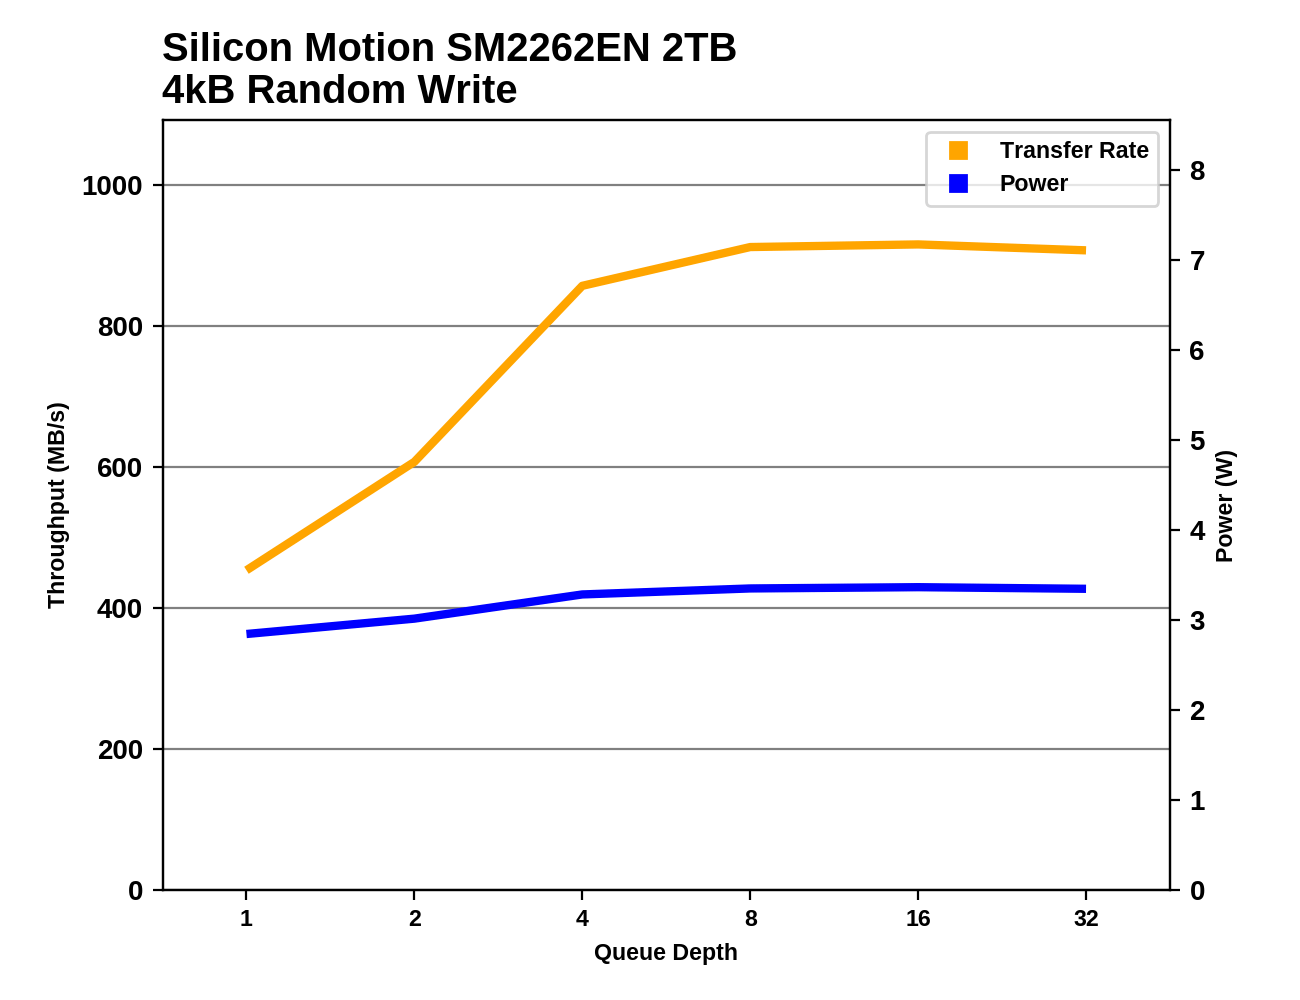
The SM2262EN has the best random write performance at low queue depths, but by QD4 the other top NVMe SSDs have caught up or slightly surpassed it. At QD8 and higher, performance holds steady and the SLC cache never gets entirely filled during this test.


28 Comments
View All Comments
DigitalFreak - Wednesday, August 1, 2018 - link
One thing has always confused me about these benchmarks. Does performance get progressively worse as the drive fills up? For example, the ATSB - Light average latency for the drive is 48 mu empty and 330 mu full. Does that mean when the drive is 50% full the latency would be around 189 mu? Or does it run at 48 mu until the drive hits 100% full? Same for the average data rate.Billy Tallis - Wednesday, August 1, 2018 - link
I think there's usually a threshold at which performance drops pretty rapidly because the SLC cache or spare area is no longer large enough. Unfortunately, determining the shape of the curve and where the threshold is (if there is one) is extremely time-consuming, and the tools used for the ATSB tests don't make it easy to test multiple drives in parallel.I did run the Heavy and Light tests on this drive with it 80% full and the results were similar to the 100% full case. But manual overprovisioning like that doesn't necessarily have the same impact that re-tuning the firmware would. A typical variable-size SLC cache won't be significantly larger for an 80% full drive than for a 100% full drive.
And there's still the problem that the ATSB tests don't give the drive any long idle periods to flush the SLC cache. The SLC cache on a full drive might be large enough to handle the Heavy test reasonably well if it gets a realistic amount of idle time to flush the cache mid-test. But that would take the Heavy test from 1.5 hours to a full day.
DigitalFreak - Wednesday, August 1, 2018 - link
Understandable. With the huge performance difference between empty and full with this controller, I was just curious at what percentage used the drive performance tanked. Based on your test we already know that 80% full is just as bad as 100%. Hopefully it's not any lower than that.justaviking - Wednesday, August 1, 2018 - link
I had the exact same question. How full is full?If the performance hit did not occur until 95% full or more, then it would be easily avoidable and acceptable (to me). If it happens at 30% full, it's a deal breaker. Or a linear degredation would also unacceptable to me since the degredation is so extreme.
I STRONGLY ENCOURAGE taking the time to explore the "degradation curve" relative to "fullness" for this drive, since it is so dramatic. It could make a special article of the type AnandTech excels at.
29a - Wednesday, August 1, 2018 - link
I agree.jtd871 - Wednesday, August 1, 2018 - link
How long of a "long idle time" do you need? Are you talking about 1.5h run time for ATSB to 8h or 24h with sufficiently long "long idle times"?Billy Tallis - Wednesday, August 1, 2018 - link
Currently, the ATSB tests cut all idle times down to a maximum of 25ms. I suspect that idle times on the order of seconds would be sufficient, but I don't think we even still have the original traces with the full idle times. In the near future I'll do some SYSmark runs with a mostly-full drive; that's a similar intensity of storage workload to the ATSB light, but with a fairly realistic pacing including idle.I'll also try to compare the power data against the performance test duration for the synthetic tests. That should reveal how long the drive took to return to idle after the writing stopped, and give us a pretty good idea of how quickly the drive can empty the SLC cache and how high of a duty cycle it can sustain for writes at full speed.
Dark_wizzie - Wednesday, August 1, 2018 - link
A larger drive helps mitigate the issues because 1) Larger drives tend to have large SLC cache? Or 2) There is more normal free space for the drive?Billy Tallis - Wednesday, August 1, 2018 - link
Both, in a big way when it's 2TB, and especially when you have a variable-size SLC cache. A mostly-empty 2TB drive can have over 100GB of SLC cache, which is absolutely impossible to fill up with any real-world client workload.mattrparks - Wednesday, August 1, 2018 - link
I wonder if...I think you could get similar results (stellar performance characteristics at low drive usage) by using a larger DRAM read/write cache when the drive mapping table is not taking up as much RAM. With 2GB of DDR4, let's say arbitrarily that 1.5GB of that is used by FTL page mapping tables when the drive is full. What if you found a way in firmware to manage your memory such that when most of the drive FTL is unmapped, that you could use say only 0.5GB for the mapping table and have an extra 1GB available for caching? Many of the synthetic tests could be gamed by keeping that much drive cache. I don't remember your drive testing methodology fully, but perhaps a full power cycle of the drive after the data is written, before the read tests, would make sure that all the performance is indeed SLC speed and not just enormous amounts of caching.