The AMD Threadripper 2990WX 32-Core and 2950X 16-Core Review
by Dr. Ian Cutress on August 13, 2018 9:00 AM ESTHEDT Benchmarks: Office Tests
The Office test suite is designed to focus around more industry standard tests that focus on office workflows, system meetings, some synthetics, but we also bundle compiler performance in with this section. For users that have to evaluate hardware in general, these are usually the benchmarks that most consider.
PCMark 10: Industry Standard System Profiler
Futuremark, now known as UL, has developed benchmarks that have become industry standards for around two decades. The latest complete system test suite is PCMark 10, upgrading over PCMark 8 with updated tests and more OpenCL invested into use cases such as video streaming.
PCMark splits its scores into about 14 different areas, including application startup, web, spreadsheets, photo editing, rendering, video conferencing, and physics. We post all of these numbers in our benchmark database, Bench, however the key metric for the review is the overall score.
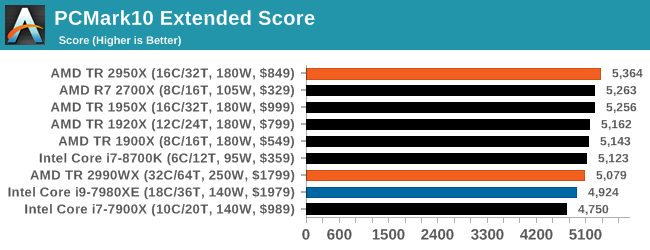
One of the downsides of PCMark is that it seems to bunch up all the results, showing them relatively close together, but interestingly here that the Intel processors sit near the bottom, with the 2950X and 2700X on the podium.
Chromium Compile: Windows VC++ Compile of Chrome 56
A large number of AnandTech readers are software engineers, looking at how the hardware they use performs. While compiling a Linux kernel is ‘standard’ for the reviewers who often compile, our test is a little more varied – we are using the windows instructions to compile Chrome, specifically a Chrome 56 build from March 2017, as that was when we built the test. Google quite handily gives instructions on how to compile with Windows, along with a 400k file download for the repo.
In our test, using Google’s instructions, we use the MSVC compiler and ninja developer tools to manage the compile. As you may expect, the benchmark is variably threaded, with a mix of DRAM requirements that benefit from faster caches. Data procured in our test is the time taken for the compile, which we convert into compiles per day.
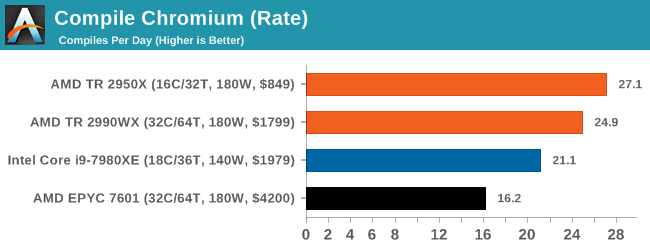
This test is such a nice mix of ST, MT, and memory limited flow that it is really interesting to see where the results end up. Unfortunately for our new suite the output files were not set up correctly, so despite running the test we only ever got a handful of results. But it shows an interesting metric: the 2950X sits ahead of the 2990WX, with both ahead of the Core i9, and the EPYC system being beaten handily due to its lower frequencies.
3DMark Physics: In-Game Physics Compute
Alongside PCMark is 3DMark, Futuremark’s (UL’s) gaming test suite. Each gaming tests consists of one or two GPU heavy scenes, along with a physics test that is indicative of when the test was written and the platform it is aimed at. The main overriding tests, in order of complexity, are Ice Storm, Cloud Gate, Sky Diver, Fire Strike, and Time Spy.
Some of the subtests offer variants, such as Ice Storm Unlimited, which is aimed at mobile platforms with an off-screen rendering, or Fire Strike Ultra which is aimed at high-end 4K systems with lots of the added features turned on. Time Spy also currently has an AVX-512 mode (which we may be using in the future).
For our tests, we report in Bench the results from every physics test, but for the sake of the review we keep it to the most demanding of each scene: Ice Storm Unlimited, Cloud Gate, Sky Diver, Fire Strike Ultra, and Time Spy.
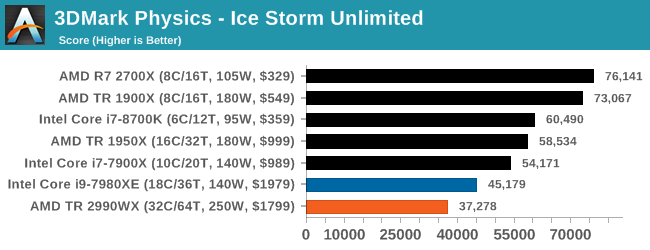
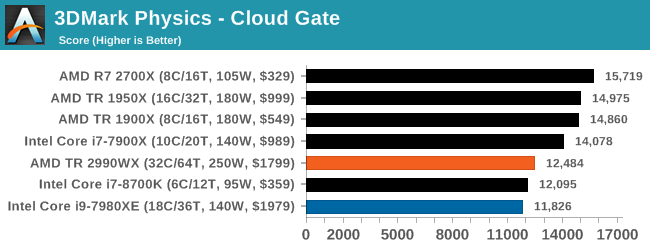
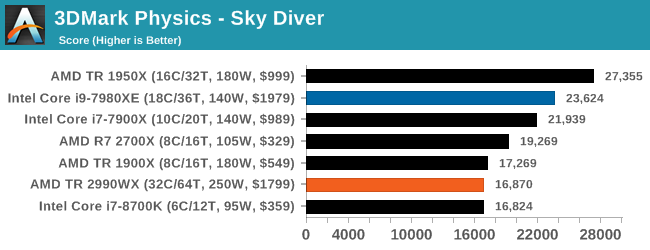
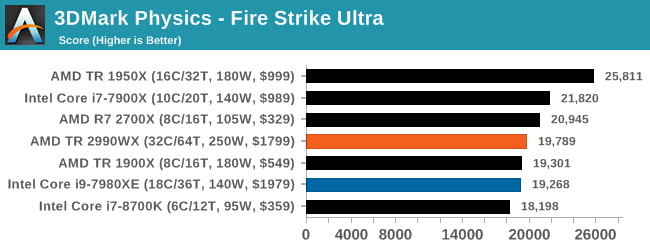
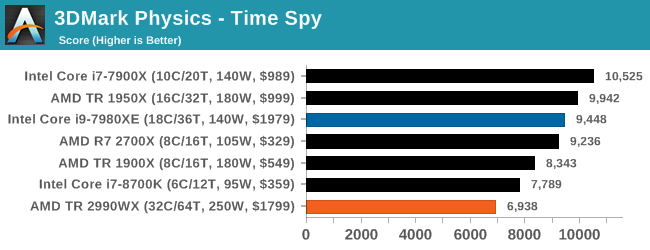
In the low end tests, it is clear that having these big processors doesn’t do much for performance, but even as we go up through Fire Strike and Time Spy, there seems to be a natural limit to the usefulness of these parts. Physics clearly loves having some extra memory bandwidth, and we know Time Spy isn’t meant to scale beyond about 10 cores, but we do see the 10 core processor sitting out front. Some of our testing sweeps had this benchmark configured incorrectly so it will be interesting to see how it fills out with some other mid and high core count processors.
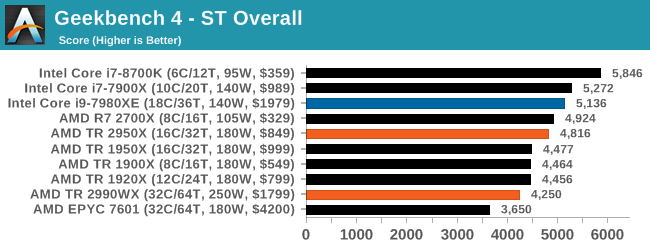
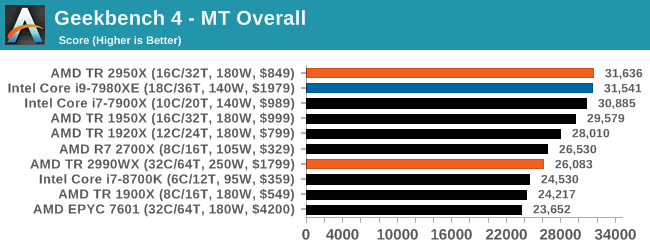
GeekBench4: Synthetics
A common tool for cross-platform testing between mobile, PC, and Mac, GeekBench 4 is an ultimate exercise in synthetic testing across a range of algorithms looking for peak throughput. Tests include encryption, compression, fast fourier transform, memory operations, n-body physics, matrix operations, histogram manipulation, and HTML parsing.
I’m including this test due to popular demand, although the results do come across as overly synthetic, and a lot of users often put a lot of weight behind the test due to the fact that it is compiled across different platforms (although with different compilers).
We record the main subtest scores (Crypto, Integer, Floating Point, Memory) in our benchmark database, but for the review we post the overall single and multi-threaded results.


171 Comments
View All Comments
NevynPA - Tuesday, August 14, 2018 - link
Will there be results for WX chips in 'Game Mode' at various core/thread counts (6/12,8/16,12/24)?jospoortvliet - Saturday, August 18, 2018 - link
It has no game mode. Don't bother buying it for games...jts888 - Tuesday, August 14, 2018 - link
What is the methodology used for the core/uncore power breakdown? Where was a physical measurement or software reading taken, and what were the loads used?Furthermore, Zen uses single-ended signaling for IF links with alleged even further reduced power draw when in transient no-send states, so there should be at least two clearly explained tests done (i.e., both high and low inter-thread/core/sock bandwidth, with NUMA allocations detailed) before interconnect power breakdowns can be credibly presented as flat metrics of the architectures investigated.
Although this review is still a work in progress, it needs some substantial improvements in clarity given the strength of the claims made and conclusions drawn.
ktmrc8 - Thursday, August 16, 2018 - link
Let me add my voice to those asking for further elaboration on this point. I think it's very interesting, but I would like enough detail so that I could possibly replicate your data. In particular, I the charts showing power consumption decreasing as number of loaded threads increase counter-intuitive (at least for me!). Thanks.Sahrin - Tuesday, August 14, 2018 - link
The link power is a problem, but I get the feeling that nowhere near the power optimization went into IF as went into the cores.notfeelingit - Tuesday, August 14, 2018 - link
What's up with the 2950X crazy low score for the PCMark10 Startup Test? Is that repeatable?crotach - Tuesday, August 14, 2018 - link
So, 2700X looks like a clear winner here?GreenReaper - Wednesday, August 15, 2018 - link
For the average consumer, yes. It's a sweet spot. Heck, most would do fine with an APU. You don't expect a truck to win a race. Small engines tend to be more efficient; they're just limited in raw power.witeko - Tuesday, August 14, 2018 - link
hi, can we have some tests regarding data processing (spark, dask), machine learning (lightGBM/xgboost training), deep learning (i know there are GPUs) just to get a feeling (there are pre-made benchmarks for tensorflow) ? And also some reviews point to win10 vs linux differences for example in the zip test.farmergann - Tuesday, August 14, 2018 - link
Really should have included the Epyc 7401p as it's a serious contender in this price range (only $1,000).