The Phison E12 Reference Design Preview: A Next-Gen NVMe SSD Controller
by Billy Tallis on July 18, 2018 10:30 AM ESTRandom Read Performance
Our first test of random read performance uses very short bursts of operations issued one at a time with no queuing. The drives are given enough idle time between bursts to yield an overall duty cycle of 20%, so thermal throttling is impossible. Each burst consists of a total of 32MB of 4kB random reads, from a 16GB span of the disk. The total data read is 1GB.
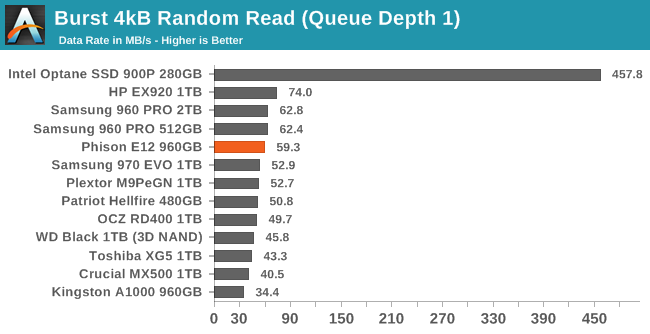
The burst random read speed of the Phison E12 is very good, but the HP EX920 still stands out as the leading flash-based SSD on this test.
Our sustained random read performance is similar to the random read test from our 2015 test suite: queue depths from 1 to 32 are tested, and the average performance and power efficiency across QD1, QD2 and QD4 are reported as the primary scores. Each queue depth is tested for one minute or 32GB of data transferred, whichever is shorter. After each queue depth is tested, the drive is given up to one minute to cool off so that the higher queue depths are unlikely to be affected by accumulated heat build-up. The individual read operations are again 4kB, and cover a 64GB span of the drive.
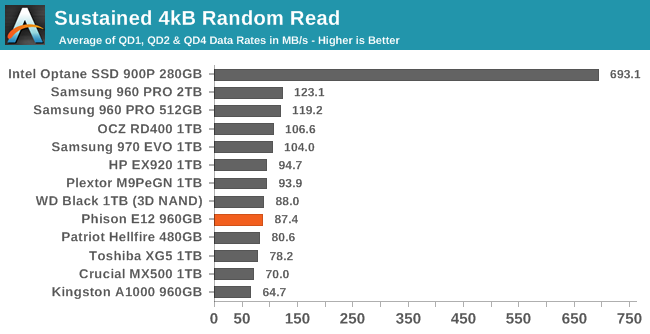
On the longer random read test where some higher queue depths come into play, the Phison E12's performance is a bit below par as several other TLC-based SSDs are a bit faster, even those using the same BiCS3 3D TLC.
 |
|||||||||
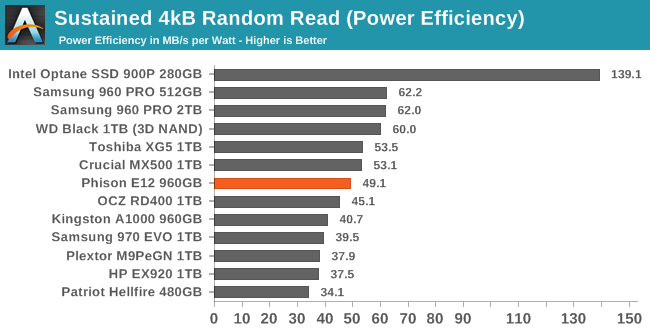
| Power Efficiency in MB/s/W | Average Power in W | ||||||||
The power efficiency of the Phison E12 during the sustained random read test is decent, and the overall power consumption is only a bit higher than the Phison E8-based Kingston A1000. The only TLC SSD that's both faster and more efficient than the Phison E12 is the WD Black, which just barely faster.
 |
|||||||||
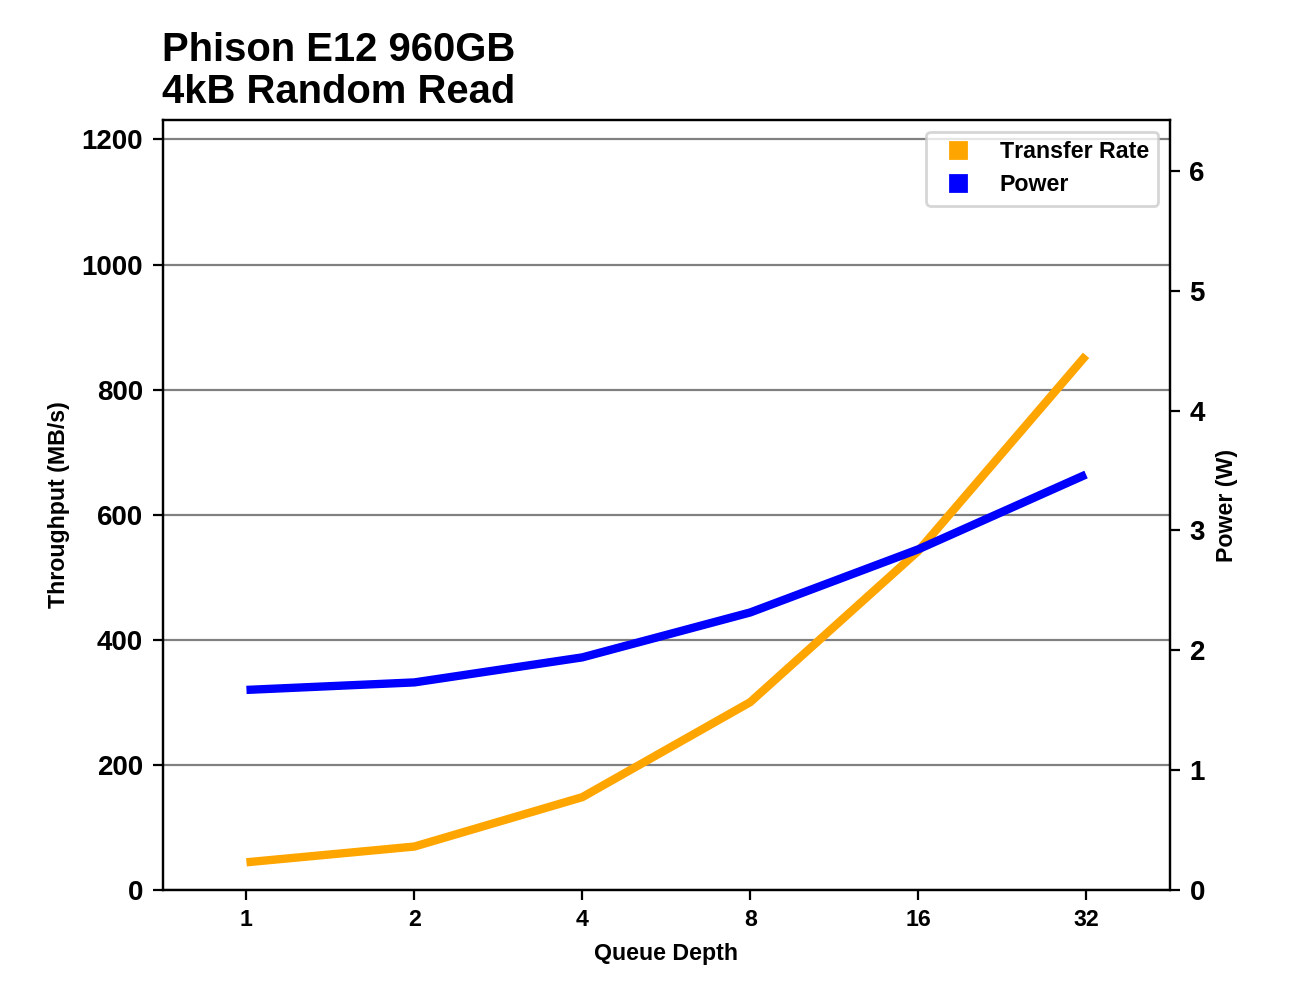
The random read speed of the Phison E12 scales up nicely as queue depths increase, and the power consumption doesn't get out of hand. By QD32 a few TLC drives are a bit ahead of the Phison E12, but the only big performance gaps are relative to the MLC SSDs and the Intel Optane SSD.
Random Write Performance
Our test of random write burst performance is structured similarly to the random read burst test, but each burst is only 4MB and the total test length is 128MB. The 4kB random write operations are distributed over a 16GB span of the drive, and the operations are issued one at a time with no queuing.
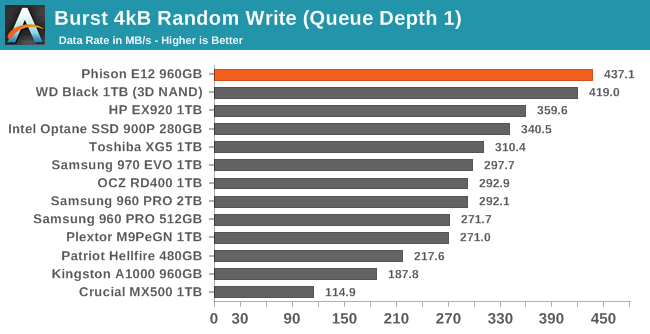
The Phison E12 sets a new record for burst random write performance, improving slightly over the WD Black that formerly held a wide lead.
As with the sustained random read test, our sustained 4kB random write test runs for up to one minute or 32GB per queue depth, covering a 64GB span of the drive and giving the drive up to 1 minute of idle time between queue depths to allow for write caches to be flushed and for the drive to cool down.
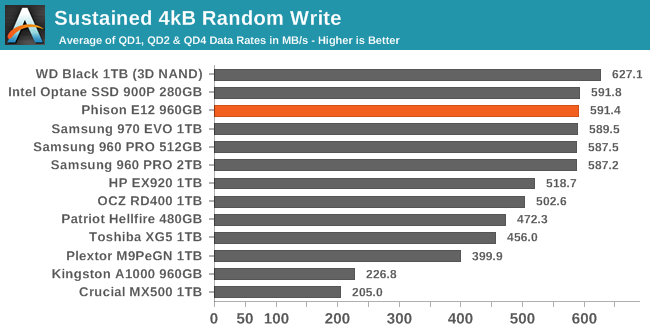
On the longer random write test, the Phison E12 is in a multi-way tie for second place, slightly behind the WD Black.
 |
|||||||||
| Power Efficiency in MB/s/W | Average Power in W | ||||||||
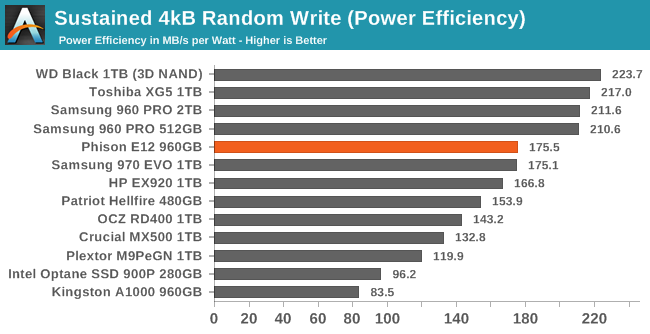
The Phison E12 matches the Samsung 970 EVO for power efficiency on the sustained random write test. The WD Black and Toshiba XG5 both have significantly better power efficiency with the same NAND. The WD Black is faster while drawing a bit less power, while the XG5 is significantly slower but also much less power-hungry.
 |
|||||||||
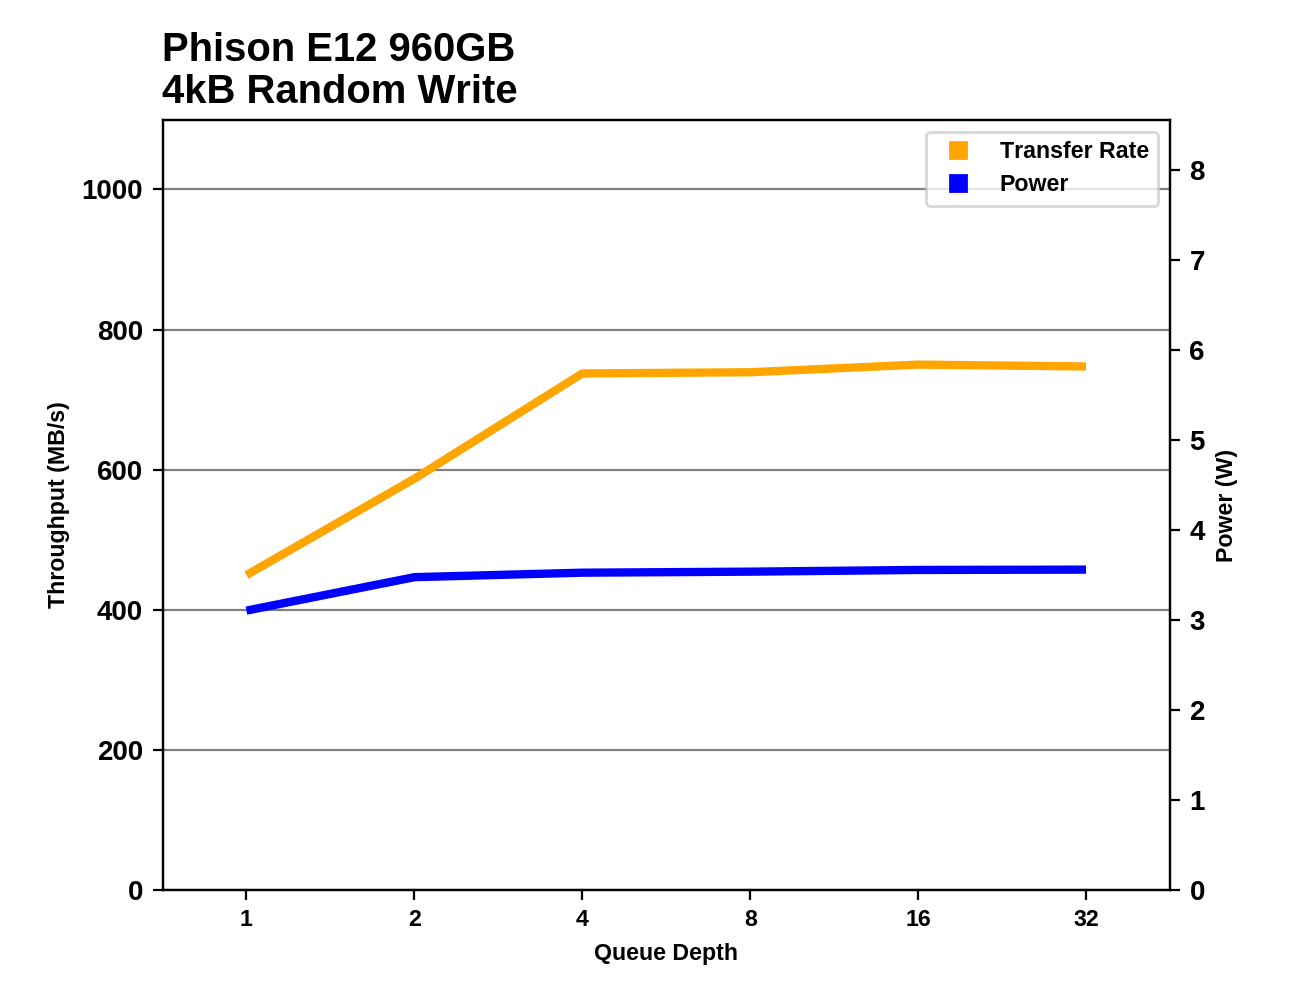
Even though quite a few drives turned in very similar performance scores for the average of QD1-QD4, the actual performance scaling curves vary quite a bit. The Phison E12's random write performance is very good at QD1 and QD2, but at higher queue depths many drives overtake it and saturate at a much higher speed.


28 Comments
View All Comments
gglaw - Thursday, July 19, 2018 - link
new cheap competition is exactly what the market needs. I've posted this before but the pursuit of performance for most of the readers here is pretty much wasted unless i've gotten so insensitive to speed changes I can't tell the difference anymore. I have more computers that I'm embarassed to admit to and more parts than I have time to finish building more to test. SSD's in general I wouldn't be surprised if I've tested more than the whole AT staff literally, and not just running a few hours of the same suites, hundreds of hours through my LAN room. I've had every major SSD chipset released for at least several years and within I'd say the last 2-3 years I can tell absolutely no difference between the cheapest 3D NAND SATA drive and the 970 EVO and ADATA 8200 which is a gem most people haven't even heard of that are among the fastest drives ever produced for consumer use. My slowest drives are the Micron 2TB dirt cheap $250 drives that go on sale every 2 weeks (cheapest per GB drive ever made), a couple Crucial MX 3D NAND drives, a few enterprise Samsung/HP pulls that are actually brand new sold through Newegg outlet, and some Samsung 850 non-pro's. Especially on the Destroyer tests the numbers look dramatically different, but this test is absolutely useless for at least 99% of the users on this site other than the few big organization admins who frequent these comments routinely.No one including myself through hundreds of hours through my LAN room have noticed/commented on any speed difference running Twitch/streaming, chat engines, browsers, while doing many hours of OW, WOW, HOTS, and Steam library games. This is about the intensity of use of the vast, vast majority of the public, likely moreso. Now other than my one flagship with about the fastest you can get of every piece, all I go for is cheap $/GB and decent warranty on my SSD's. My current flagship is the top Ryzen2, ADATA 8200 NVME drive (basically same as 970 EVO which is in my Coffee Lake rig), GTX 1080 - and sadly the only noticeable difference is playability on higher graphics settings due to the GTX 1080s on the higher machines. The 16 threaded CPU and turbo SSD's no one can tell is even in the box. And the budget machines running RX 580s, GTX 1070s/1060s, do everything identical to the flagships other than a couple graphics settings needing to be turned down. (All the rigs are also only going at 1440p since I never felt it was enough of a difference to justify the cost to go 4k).
romrunning - Thursday, July 19, 2018 - link
The only point I think you've established is that you haven't run any loads that significantly use any one component - SSD, CPU, or GPU. Well, at least you saw the GPU difference in "higher settings". If you're just doing games, I can see why you might think the big performance products don't have much of an impact. However, depending on your use case, there can be huge performance/time savings in different products.A high-thread count CPU can make significant time differences in rendering. So if that is something you do a lot, especially if you do this for work, then you will notice a huge difference in the time saved on rendering.
In virtual server hosts, you can tell a difference from an all-SSD array vs all-HDD array in the responsive of the virtual guests. In databases, you can tell big differences in SSD storage vs HDD storage (not considering memory), especially with disk I/O-intensive backups & restores.
So these are just some use cases that can highlight the significant impact of better-performing components. But all cases are different in their usage scenarios. We can't just give up on seeking better performance & go only for low-cost just because our particular use-case doesn't really display the impact of higher-performing parts.
PeachNCream - Thursday, July 19, 2018 - link
I think the point of the post you were responding to was to argue that there is little real world difference in most home computing scenarios between different SSDs (not SSDs vs HDDs as your response points out) despite the benchmarks showing sometimes dramatic performance advantages or disadvantages. The other accompanying parts of the post that wander into the CPU and GPU were just there to enhance the credibility of the claim by offering an argument of broad experience.romrunning - Thursday, July 19, 2018 - link
I, too, wish for more performance MLC products; however, I think we might just transition to Optane drives & hope they go down faster in price.The_Assimilator - Thursday, July 19, 2018 - link
Article title: "A Next-Gen NVMe SSD Controller"Article conclusion: "...it doesn't appear that the combination of the E12 controller and 64L TLC is at all future-proof."
shabby - Thursday, July 19, 2018 - link
Need a catchy title for them clicks.Holliday75 - Thursday, July 19, 2018 - link
It is Phison's next gen controller.tygrus - Thursday, July 19, 2018 - link
28nm for the controller isn't new. I assume they could decrease power consumption if they used smaller fab node like 22nm. The FLASH chips themselves use/produce a lot of heat as well and 28nm might be cheaper than 22nm so compromises were made. Maybe they could bring out another version for higher performance AIC PCIe x8 or PCIe v4 signals next year (22nm fabed controller).