The Intel SSD 660p SSD Review: QLC NAND Arrives For Consumer SSDs
by Billy Tallis on August 7, 2018 11:00 AM ESTSequential Read Performance
Our first test of sequential read performance uses short bursts of 128MB, issued as 128kB operations with no queuing. The test averages performance across eight bursts for a total of 1GB of data transferred from a drive containing 16GB of data. Between each burst the drive is given enough idle time to keep the overall duty cycle at 20%.
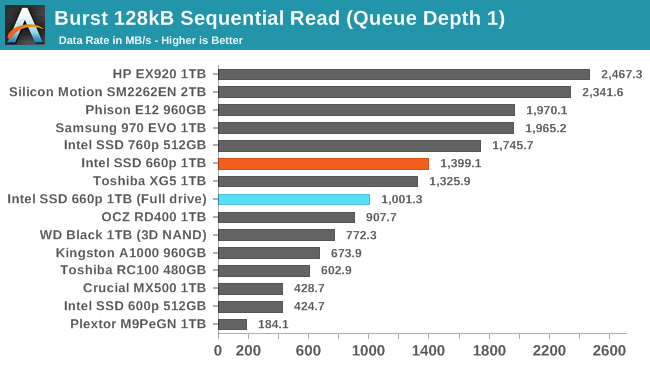
The burst sequential read performance of the Intel SSD 660p is lower than several of the fastest high-end drives, but is still pretty quick given the 4-channel controller used by the 660p. The read speed is only moderately impaired after filling the drive all the way.
Our test of sustained sequential reads uses queue depths from 1 to 32, with the performance and power scores computed as the average of QD1, QD2 and QD4. Each queue depth is tested for up to one minute or 32GB transferred, from a drive containing 64GB of data. This test is run twice: once with the drive prepared by sequentially writing the test data, and again after the random write test has mixed things up, causing fragmentation inside the SSD that isn't visible to the OS. These two scores represent the two extremes of how the drive would perform under real-world usage, where wear leveling and modifications to some existing data will create some internal fragmentation that degrades performance, but usually not to the extent shown here.
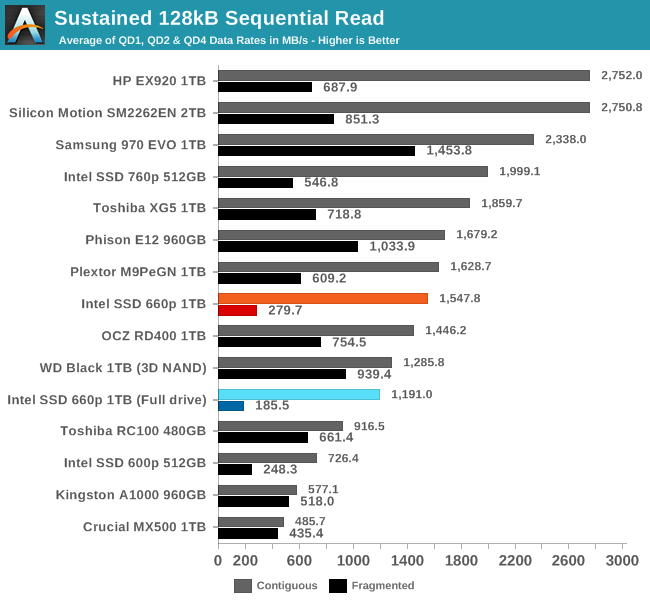
On the longer sequential read test that goes beyond QD1, the true high-end NVMe drives pull away from the 660p but it is still faster than most other low-end NVMe SSDs. Internal fragmentation is more of a problem for the 660p than the TLC drives, but this is not too surprising—the QLC NAND is likely using larger page and block sizes that add to the overhead of gathering data that has been dispersed by wear leveling during random writes.
 |
|||||||||
| Power Efficiency in MB/s/W | Average Power in W | ||||||||
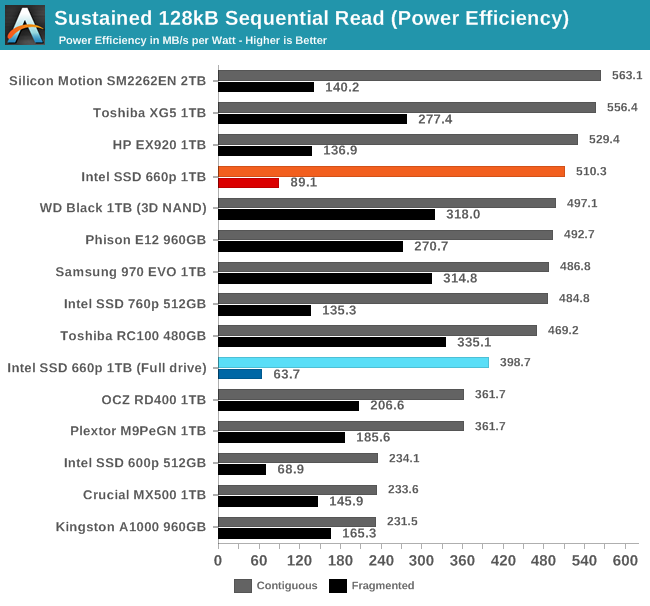
The power efficiency of sequential reads from the 660p is competitive with many of the best TLC SSDs, and isn't too far behind even after filling the drive all the way.
 |
|||||||||
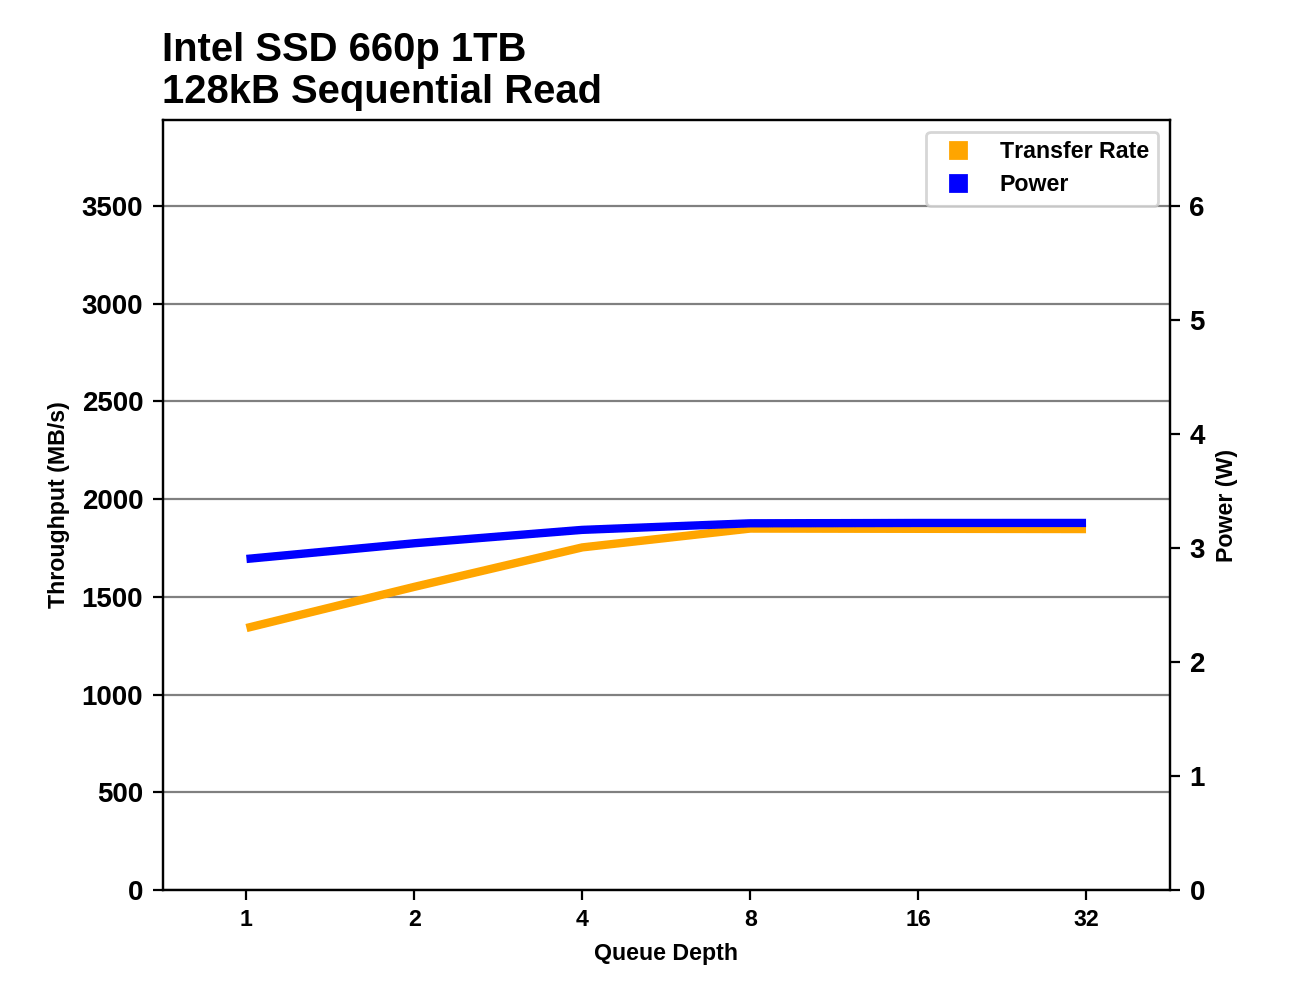
The 660p doesn't reach its maximum sequential read speed until around QD8, but it was already pretty quick at QD1 so the overall growth is relatively small.
Sequential Write Performance
Our test of sequential write burst performance is structured identically to the sequential read burst performance test save for the direction of the data transfer. Each burst writes 128MB as 128kB operations issued at QD1, for a total of 1GB of data written to a drive containing 16GB of data.
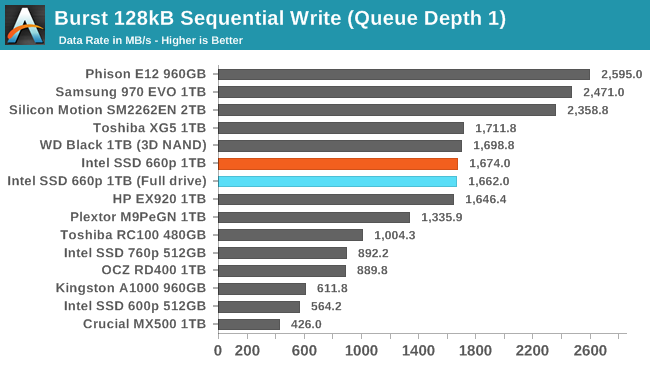
The burst sequential write test only hits the SLC write cache even when the Intel SSD 660p is completely full, so it performs comparably to many high-end NVMe drives.
Our test of sustained sequential writes is structured identically to our sustained sequential read test, save for the direction of the data transfers. Queue depths range from 1 to 32 and each queue depth is tested for up to one minute or 32GB, followed by up to one minute of idle time for the drive to cool off and perform garbage collection. The test is confined to a 64GB span of the drive.
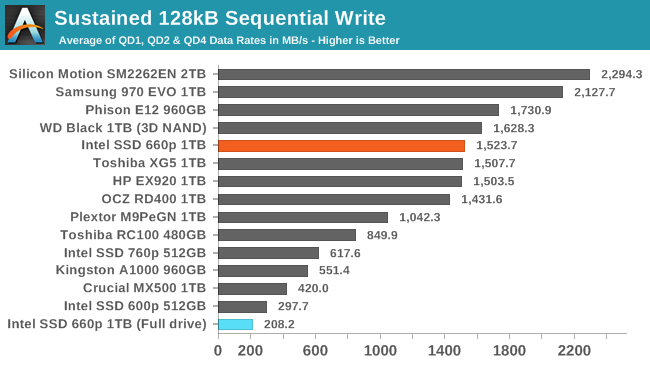
Our usual test conditions of a mostly-empty drive mean that the 660p's score on the sustained sequential write test reflects only writes to the SLC cache at its largest configuration. When the drive is full and the SLC cache has shrunk to just 12GB, the test quickly fills that cache and performance drops to last place.
 |
|||||||||
| Power Efficiency in MB/s/W | Average Power in W | ||||||||
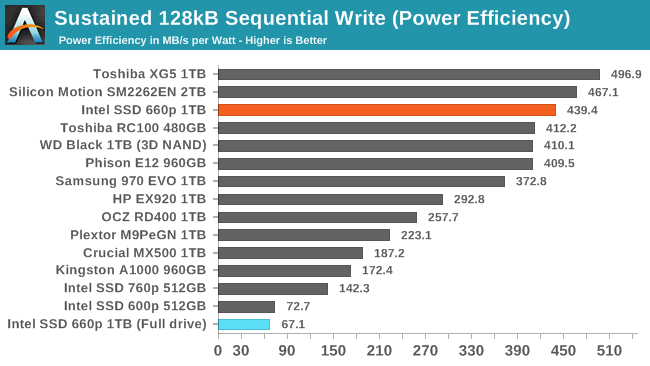
The power efficiency of the 660p when writing sequentially to the SLC cache is excellent, but it ends up slightly worse off than the 600p when the drive is full and the SLC cache is too small.
 |
|||||||||
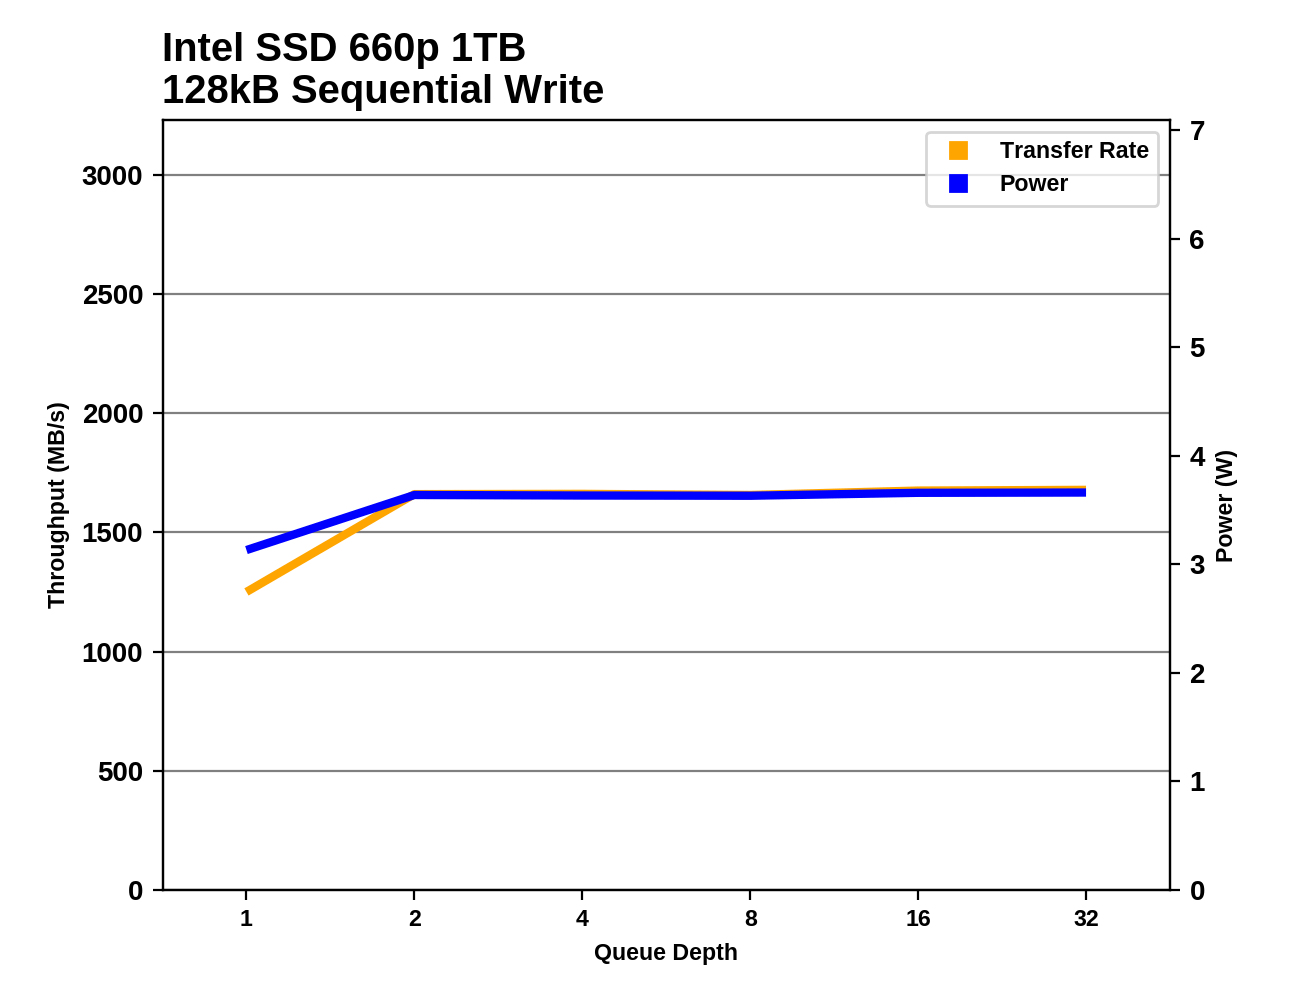
The 660p reaches its maximum sequential write speed at QD2 and maintains it for the rest of the test, showing that the drive is largely keeping up with flushing the SLC write cache during the idle phases of the test.


86 Comments
View All Comments
dromoxen - Friday, August 10, 2018 - link
You would hope these things would have even larger dram buffers than tlc. I will pass on these 1st gen and stick with with HD.Has intel stopped making ssd controllers?
To do some tests , write endurance, why not cool down the m.2 nand to LN2 temps, I'm sure debauer has some pots and equipment. I expect these will be even cheaper by jan 19
tomatotree - Tuesday, August 14, 2018 - link
Intel makes their own controllers for all their enterprise drives, and all 3DXP drives, but for consumer NAND drives they use 3rd party controllers with customized firmware.As for LN2 cooling, what would that show? That the drive might fail if you use it in a temperature range way out of spec?
351Cleveland - Monday, August 20, 2018 - link
I’m confused. Why would I buy this over, say, an MX500 (my default go-to)? This thing is a dog in every way. How can Anandtech recommend something they admit is flawed?icebox - Thursday, December 6, 2018 - link
I don't understand why everybody fusses about retention and endurance so much. Do you really buy ssd's to leave them on a shelf for months or years? Retention ? If it dies during warranty you exchange it. If it dies after it then it's probably slow and small in comparison with what's available than.You do have backups, right? Because no review or test or battery of tests won't guarantee that *your drive* won't die.
BTW that's the only way I saw ssd's die - it works perfectly and after a reboot it's gone, not detected by the system.
icebox - Thursday, December 6, 2018 - link
The day has come when choosing storage is 4 tiered.You have fast nvme, slow nvme, sata ssd's and traditional hdd's. At least I kicked hdd's off my desktop. I have a samsung nvme for boot and applications and sata ssd's for media and photos. Now I'm looking of replacing those with the 2tb 660p and moving those to the nas for bulk storage.
southleft - Tuesday, May 14, 2019 - link
It would be very helpful if the review would show just how full the drive can be before performance degrades significantly. Clearly, when the drive is "full" its performance sucks, but can we expect good performance when the drive is half-full, two-thirds full, three-quarters full? C'mo, Anandtech, tell us something USEFUL here!boozed - Monday, December 30, 2019 - link
There's something wrong with the 970 EVO's results on page 3. Full performance exceeds empty performance. This is not reflected in the 970 EVO review.