The Intel SSD 660p SSD Review: QLC NAND Arrives For Consumer SSDs
by Billy Tallis on August 7, 2018 11:00 AM ESTSequential Read Performance
Our first test of sequential read performance uses short bursts of 128MB, issued as 128kB operations with no queuing. The test averages performance across eight bursts for a total of 1GB of data transferred from a drive containing 16GB of data. Between each burst the drive is given enough idle time to keep the overall duty cycle at 20%.
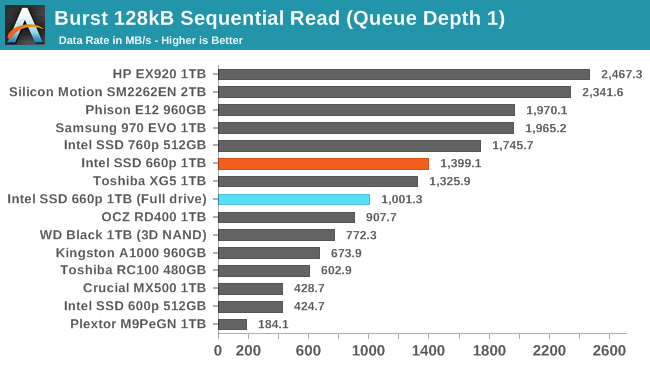
The burst sequential read performance of the Intel SSD 660p is lower than several of the fastest high-end drives, but is still pretty quick given the 4-channel controller used by the 660p. The read speed is only moderately impaired after filling the drive all the way.
Our test of sustained sequential reads uses queue depths from 1 to 32, with the performance and power scores computed as the average of QD1, QD2 and QD4. Each queue depth is tested for up to one minute or 32GB transferred, from a drive containing 64GB of data. This test is run twice: once with the drive prepared by sequentially writing the test data, and again after the random write test has mixed things up, causing fragmentation inside the SSD that isn't visible to the OS. These two scores represent the two extremes of how the drive would perform under real-world usage, where wear leveling and modifications to some existing data will create some internal fragmentation that degrades performance, but usually not to the extent shown here.
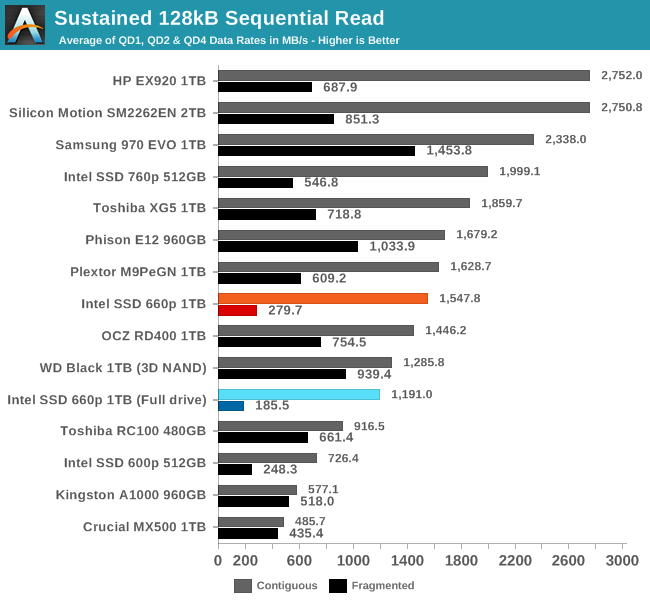
On the longer sequential read test that goes beyond QD1, the true high-end NVMe drives pull away from the 660p but it is still faster than most other low-end NVMe SSDs. Internal fragmentation is more of a problem for the 660p than the TLC drives, but this is not too surprising—the QLC NAND is likely using larger page and block sizes that add to the overhead of gathering data that has been dispersed by wear leveling during random writes.
 |
|||||||||
| Power Efficiency in MB/s/W | Average Power in W | ||||||||
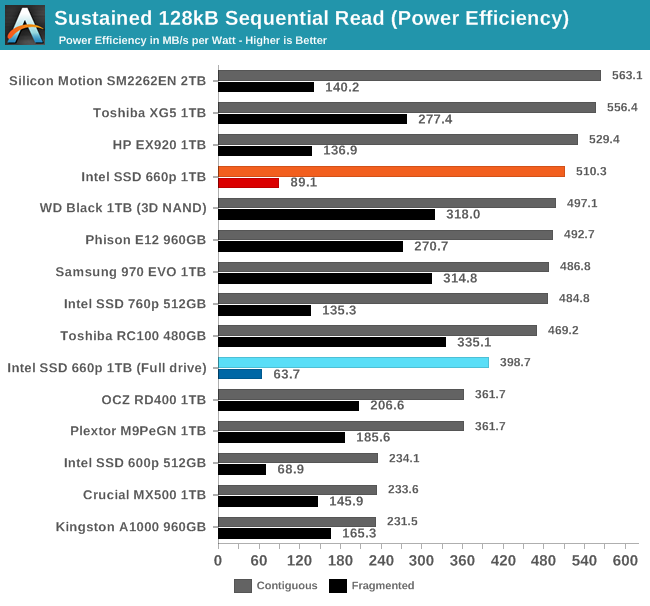
The power efficiency of sequential reads from the 660p is competitive with many of the best TLC SSDs, and isn't too far behind even after filling the drive all the way.
 |
|||||||||
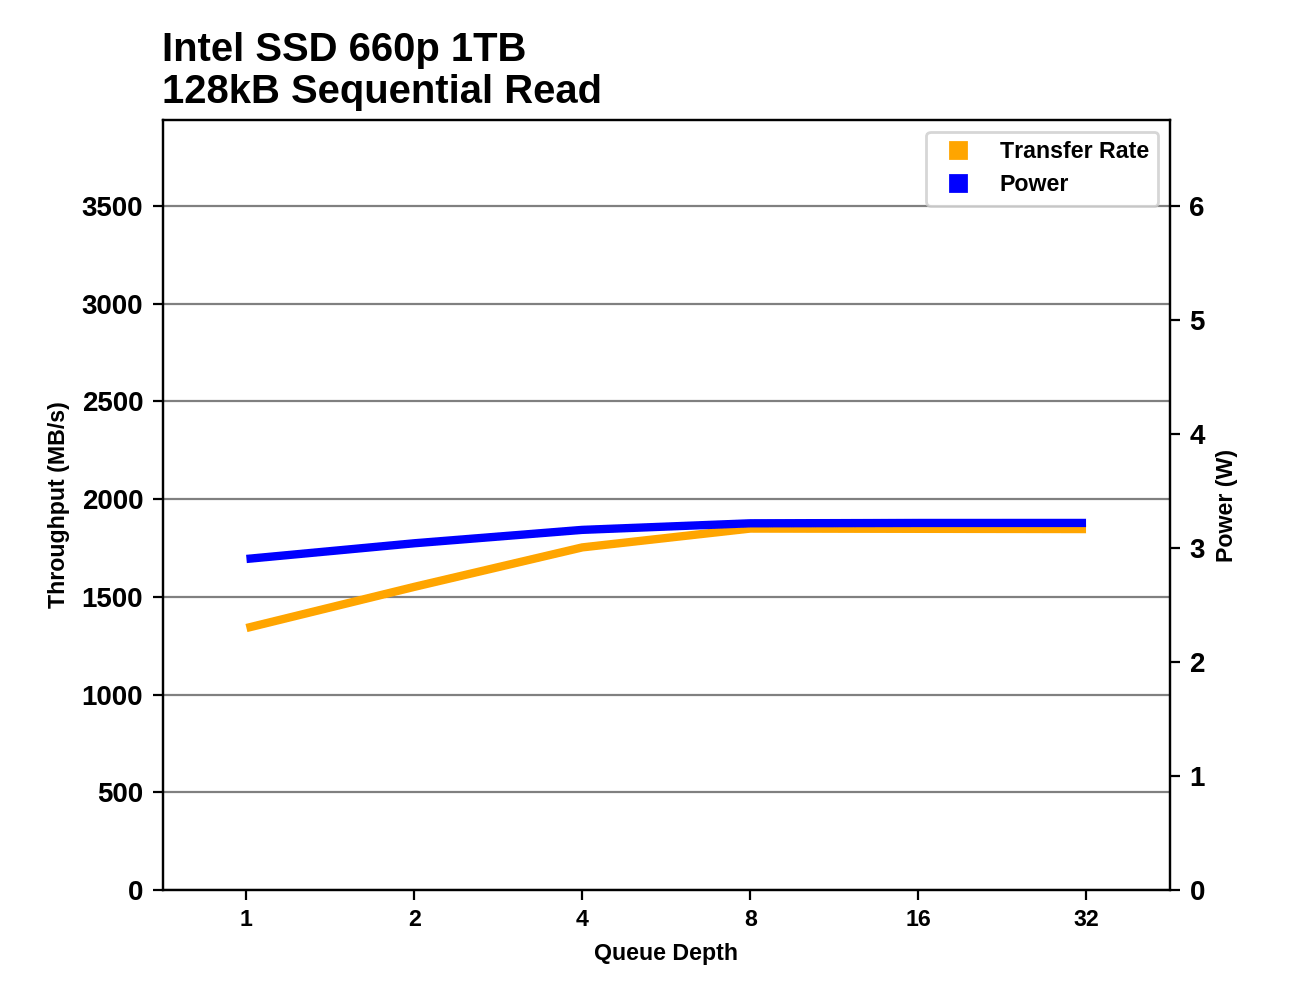
The 660p doesn't reach its maximum sequential read speed until around QD8, but it was already pretty quick at QD1 so the overall growth is relatively small.
Sequential Write Performance
Our test of sequential write burst performance is structured identically to the sequential read burst performance test save for the direction of the data transfer. Each burst writes 128MB as 128kB operations issued at QD1, for a total of 1GB of data written to a drive containing 16GB of data.
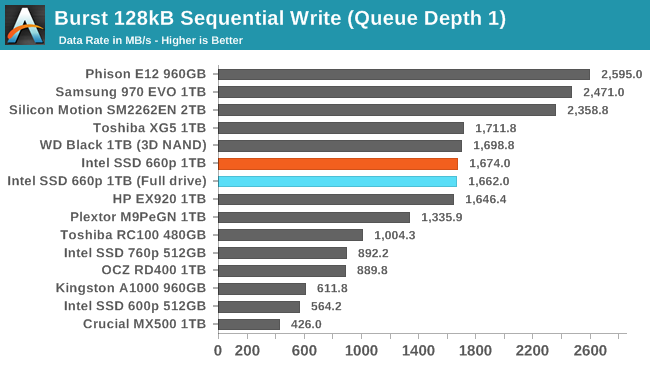
The burst sequential write test only hits the SLC write cache even when the Intel SSD 660p is completely full, so it performs comparably to many high-end NVMe drives.
Our test of sustained sequential writes is structured identically to our sustained sequential read test, save for the direction of the data transfers. Queue depths range from 1 to 32 and each queue depth is tested for up to one minute or 32GB, followed by up to one minute of idle time for the drive to cool off and perform garbage collection. The test is confined to a 64GB span of the drive.
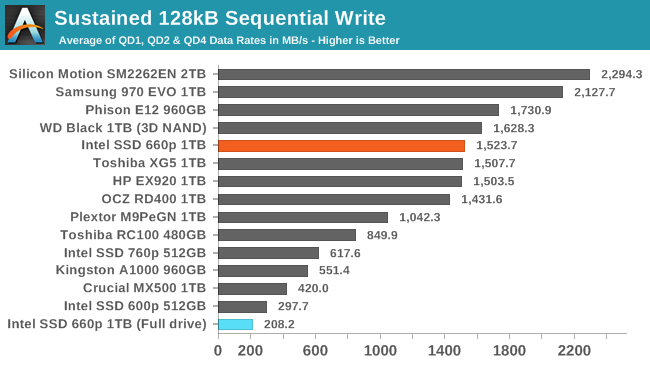
Our usual test conditions of a mostly-empty drive mean that the 660p's score on the sustained sequential write test reflects only writes to the SLC cache at its largest configuration. When the drive is full and the SLC cache has shrunk to just 12GB, the test quickly fills that cache and performance drops to last place.
 |
|||||||||
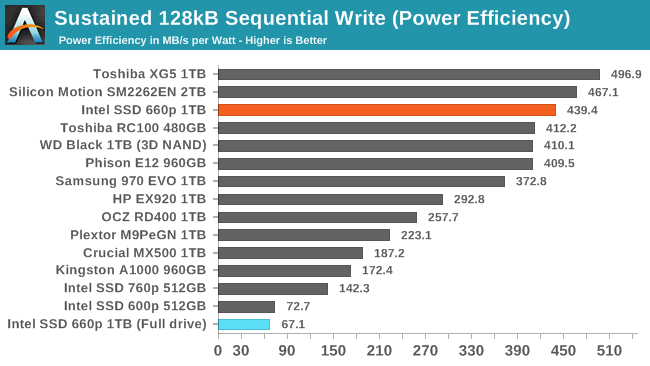
| Power Efficiency in MB/s/W | Average Power in W | ||||||||
The power efficiency of the 660p when writing sequentially to the SLC cache is excellent, but it ends up slightly worse off than the 600p when the drive is full and the SLC cache is too small.
 |
|||||||||
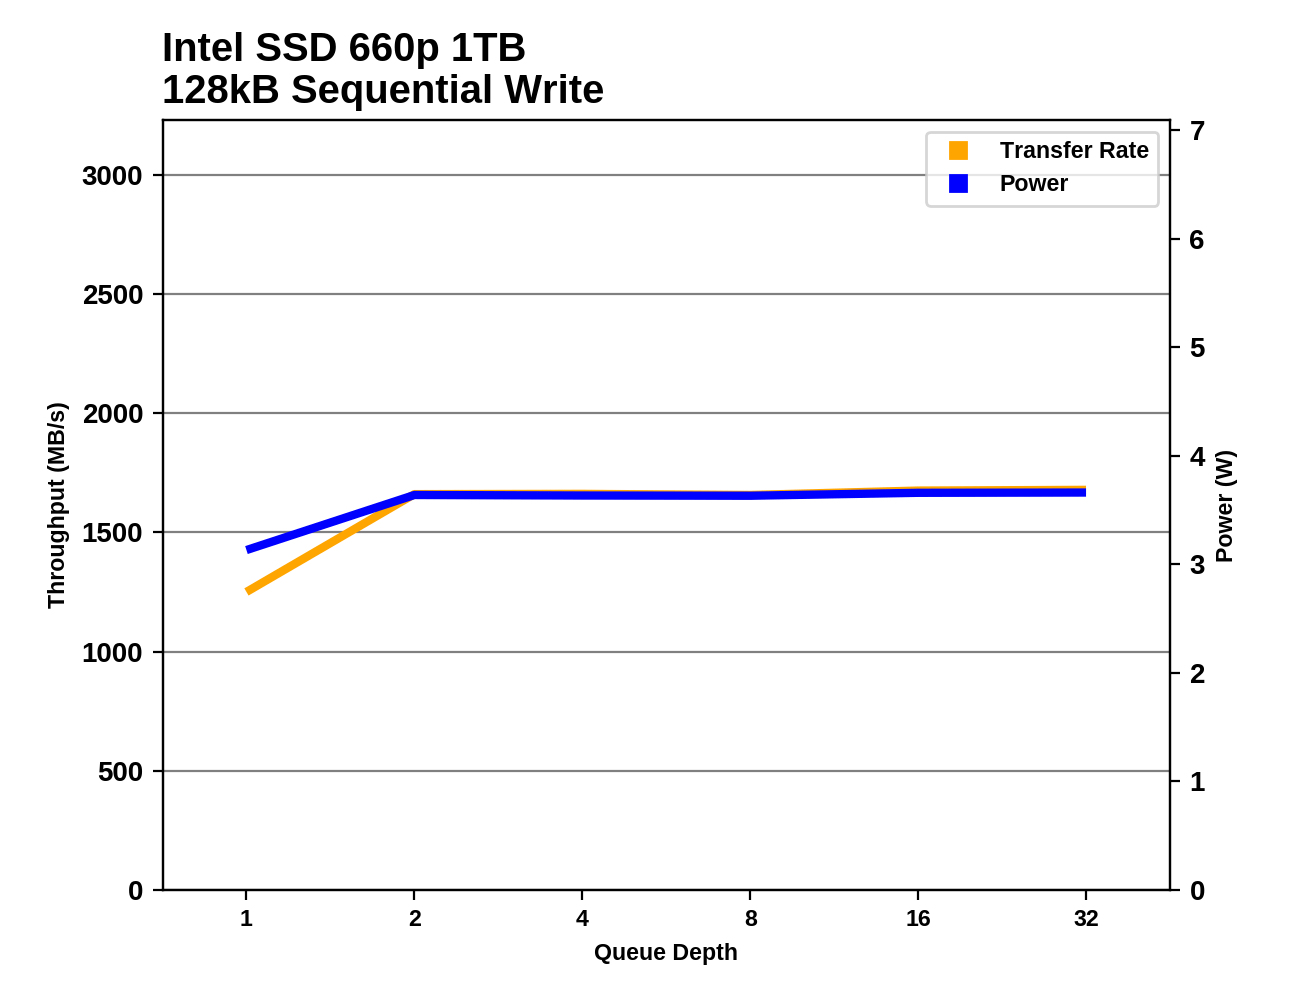
The 660p reaches its maximum sequential write speed at QD2 and maintains it for the rest of the test, showing that the drive is largely keeping up with flushing the SLC write cache during the idle phases of the test.


86 Comments
View All Comments
zodiacfml - Wednesday, August 8, 2018 - link
I think the limiting factor for reliability is the electronics/controller, not the NAND. You just lose drive space with a QLC much sooner with plenty of writes.romrunning - Wednesday, August 8, 2018 - link
Given that you can buy 1TB 2.5" HDD for $40-60 (maybe less for volume purchases), and even this QLC drive is still $0.20/GB, I think it's still going to be quite a while before notebook mfgs replace their "big" HDD with a QLC drive. After all, the first thing the consumer sees is "it's got lots of storage!"evilpaul666 - Wednesday, August 8, 2018 - link
Does the 660p series of drives work with the Intel CAS (Cache Acceleration Software)? I've used the trial version and it works about as well as Optane does for speeding up a mechanical HDD while being quite a lot larger.eddieobscurant - Wednesday, August 8, 2018 - link
Wow,this got a recommended award and the adata 8200 didn't. Another pro-intel marketing from anandtech. Waiting for biased threadripper 2 review.BurntMyBacon - Wednesday, August 8, 2018 - link
The performance of this SSD is quite bipolar. I'm not sure I'd be as generous with the award. Though, I think the decision to give out an award had more to do with the price of the drive and the probable performance for typical consumer workloads than some "pro-intel marketing" bias.danwat1234 - Wednesday, August 8, 2018 - link
The drive is only rated to write to each cell 200 times before it begins to wear out? Ewwww.azazel1024 - Wednesday, August 8, 2018 - link
For some consumer uses, yes 100MiB/sec constant write speed isn't terrible once the SLC cache is exhausted, but it'll probably be a no for me. Granted, SSD prices aren't where I want them to be yet to replace my HDDs for bulk storage. Getting close, but prices still need to come down by about a factor of 3 first.My use case is 2x1GbE between my desktop and my server and at some point sooner rather than later I'd like to go with 2.5GbE or better yet 5GbE. No, I don't run 4k video editing studio or anything like that, but yes I do occasionally throw 50GiB files across my network. Right now my network link is the bottleneck, though as my RAID0 arrays are filling up, it is getting to be disk bound (2x3TB Seagate 7200rpm drive arrays in both machines). And small files it definitely runs in to disk issues.
I'd like the network link to continue to be the limiting factor and not the drives. If I moved to a 2.5GbE link which can push around 270MiB/sec and I start lobbing large files, the drive steady state write limits are going to quickly be reached. And I really don't want to be running an SSD storage array in RAID. That is partly why I want to move to SSDs so I can run a storage pool and be confident that each individual SSD is sufficiently fast to at least saturate 2.5GbE (if I run 5GbE and the drives can't keep up, at least in an SLC cache saturated state, I am okay with that, but I'd like them to at least be able to run 250+ MiB/sec).
Also although rare, I've had to transfer a full back-up of my server or desktop to the other machine when I've managed to do something to kill the file copy (only happened twice over the last 3 years, but it HAS happened. Also why I keep a cold back-up that is updated every month or two on an external HDD). When you are transferring 3TiB or so of data, being limited to 100MiB/sec would really suck. At least right now when that happens I can push an average of 200MiB/sec (accounting for some of it being smaller files which are getting pushed at more like 80-140MiB/sec rather than the 235MiB/sec of large files).
That is a difference from close to 8:30 compared to about 4:15. Ideally I'd be looking at more like 3:30 for 3TiB.
But, then again, looking at price movement, unless I win the lottery, SSD prices are probably going to take at least 4 or more likely 5-6 years before I can drop my HDD array and just replace it with SSDs. Heck, odds are excellent I'll end up replacing my HDD array with a set of even faster 4 or 6TiB HDDs before SSDs are closer enough in price (closer enough to me is paying $1000 or less for 12TB of SSD storage).
That is keeping in mind that with HDDs I'd likely want utilized capacity under 75% and ideally under 67% to keep from utilizing those inner tracks and slowing way down. With SSDs (ignoring the SLC write cache size reductions), write penalties seem to be much less. Or at least the performance (for TLC and MLC) is so much higher than HDDs to start with, that it still remains high enough not to be a serious issue for me.
So an SSD storage pool could probably be up around 80-90% utilized and be okay, where as a HDD array is going to want to be no more than 67-75% utilized. And also in my use case, it should be easy enough to simply slap in another SSD to increase the pool size, with HDDs I'd need to chuck the entire array and get new sets of matched drives.
iwod - Wednesday, August 8, 2018 - link
On Mac, two weeks of normal usage has gotten 1TB of written data. And it does 10-15GB on average per day.100TB endurance is nothing.......
abufrejoval - Wednesday, August 8, 2018 - link
I wonder if underneath the algorithm has already changed to do what I’d call the ‘smart’ thing: Essentially QLC encoding is a way of compression (brings back old memories about “Stacker”) data 4:1 at the cost of write bandwidth.So unless you run out of free space, you first let all data be written in fast SLC mode and then start compressing things into QLC as a background activity. As long as the input isn’t constantly saturated, the compression should reclaim enough SLC mode blocks faster on average after compression than they are filled with new data. The bigger the overall capacity and remaining cache, the longer the burst it can sustain. Of course, once the SSD is completely filled the cache will be whatever they put into the spare area and updates will dwindle down to the ‘native’ QLC write rate of 100MB/s.
In a way this is the perfect storage for stuff like Steam games: Those tend to be hundreds of gigabytes these days, they are very sensitive to random reads (perhaps because the developers don’t know how to tune their data) but their maximum change rate is actually the capacity of your download bandwidth (wish mine was 100MB/s).
But it’s also great for data warehouse databases or quite simply data that is read-mostly, but likes high bandwidth and better latency than spinning disks.
The problem that I see, though, is that the compression pass needs power. So this doesn’t play well with mobile devices that you shut off immediately after slurping massive amounts of data. Worst case would be a backup SSD where you write and unplug.
The specific problem I see for Anandtech and technical writers is that you’re no longer comparing hardware but complex software. And Emil Post proved in 1946, that it’s generally impossible.
And with an MRAM buffer (those other articles) you could even avoid writing things at SLC first, as long as the write bursts do not overflow the buffer and QLC encoding empties it faster on average that it is filled. Should a burst overflow it, it could switch to SLC temporarily.
I think I like it…
And I think I would like it even better, if you could switch the caching and writing strategy at the OS or even application level. I don’t want to have to decide between buying a 2TB QLC, 1TB TLC, a 500GB MLC or 250GB SLC and then find out I need a little more here and a little less there. I have knowledge at the application (usage level), how long-lived my data will be and how it should best be treated: Let’s just use it, because the hardware internally is flexible enough to support at least SLC, TLC and QLC.
That would also make it easier to control the QLC rewrite or compression activity in mobile or portable form factors.
ikjadoon - Thursday, August 9, 2018 - link
Billy, thank you!I posted a reddit comment a long time ago about separating SSD performance by storage size! I might be behind, but this is the first I’ve seen of it. It’s, to me, a much more reliable graph for purchases.
A big shout out. 💪👌