The AMD 2nd Gen Ryzen Deep Dive: The 2700X, 2700, 2600X, and 2600 Tested
by Ian Cutress on April 19, 2018 9:00 AM ESTGrand Theft Auto
The highly anticipated iteration of the Grand Theft Auto franchise hit the shelves on April 14th 2015, with both AMD and NVIDIA in tow to help optimize the title. GTA doesn’t provide graphical presets, but opens up the options to users and extends the boundaries by pushing even the hardest systems to the limit using Rockstar’s Advanced Game Engine under DirectX 11. Whether the user is flying high in the mountains with long draw distances or dealing with assorted trash in the city, when cranked up to maximum it creates stunning visuals but hard work for both the CPU and the GPU.
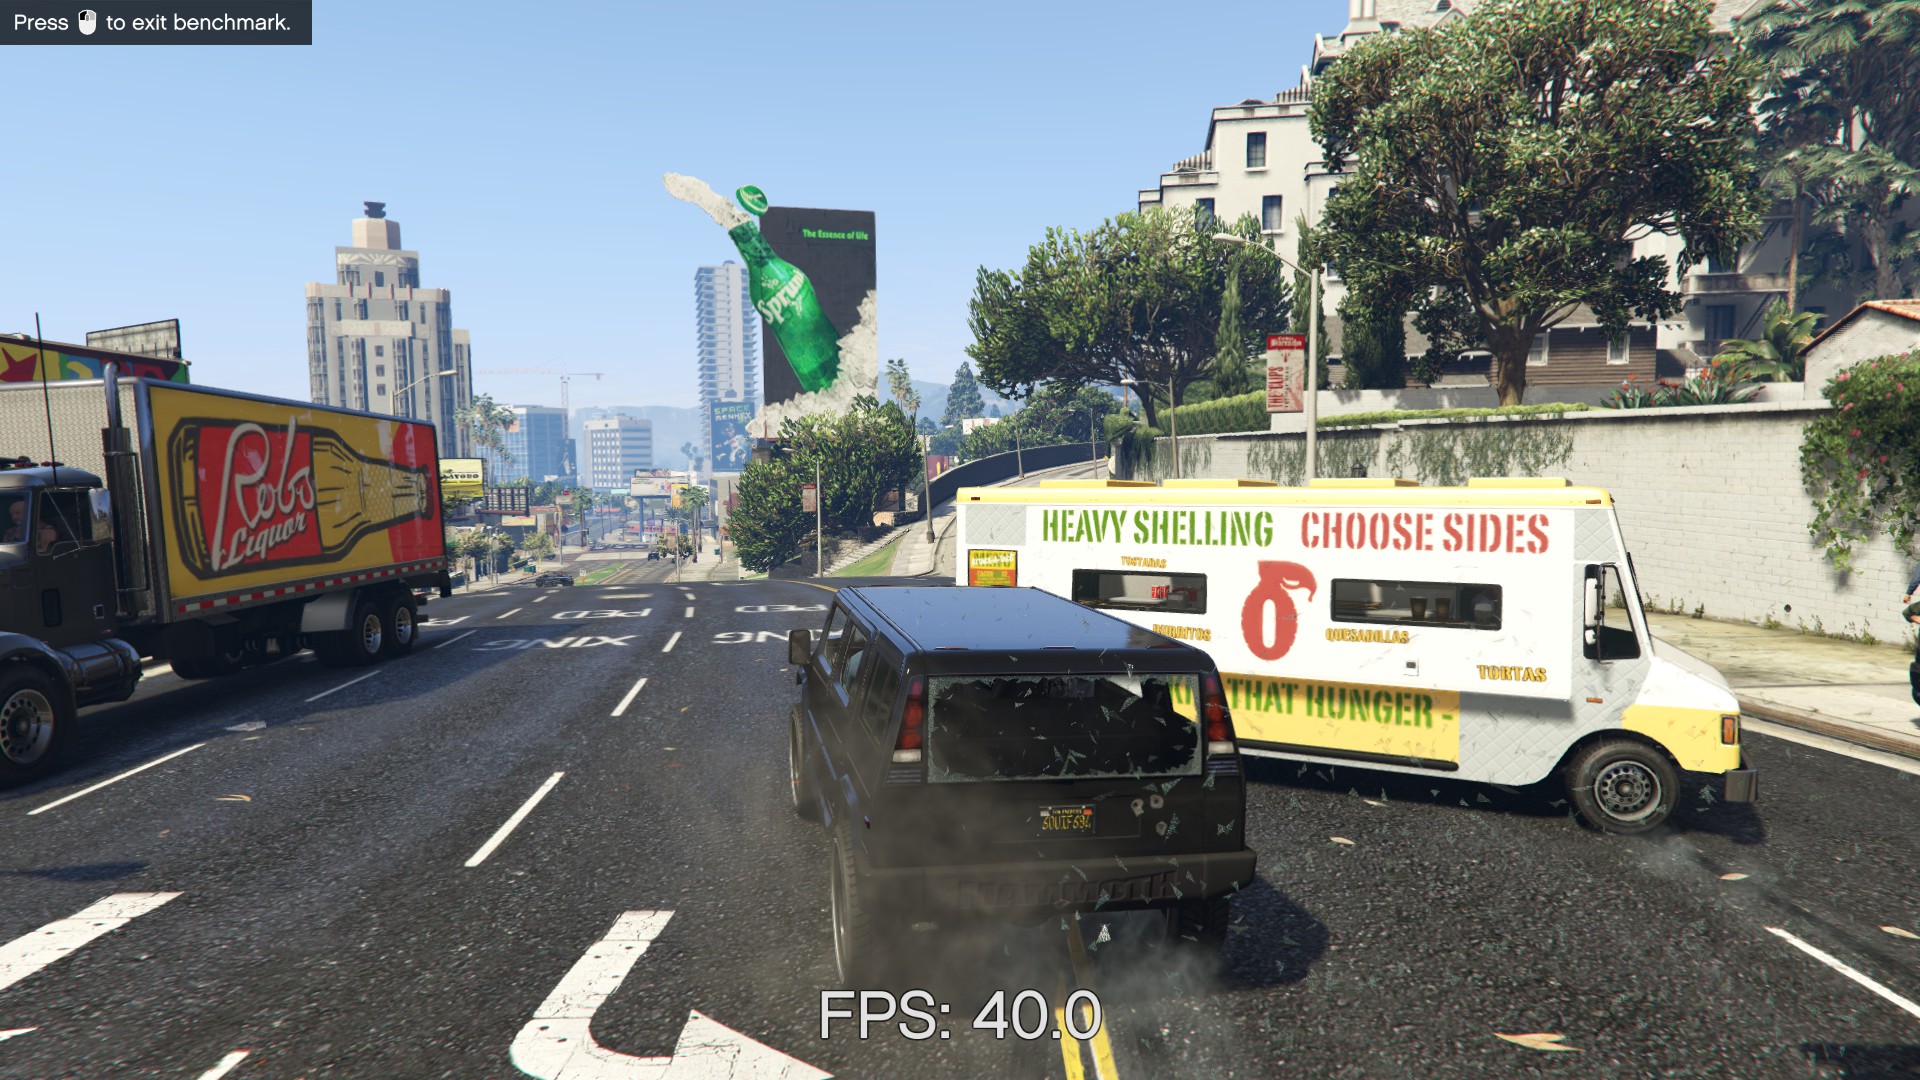
For our test we have scripted a version of the in-game benchmark. The in-game benchmark consists of five scenarios: four short panning shots with varying lighting and weather effects, and a fifth action sequence that lasts around 90 seconds. We use only the final part of the benchmark, which combines a flight scene in a jet followed by an inner city drive-by through several intersections followed by ramming a tanker that explodes, causing other cars to explode as well. This is a mix of distance rendering followed by a detailed near-rendering action sequence, and the title thankfully spits out frame time data.
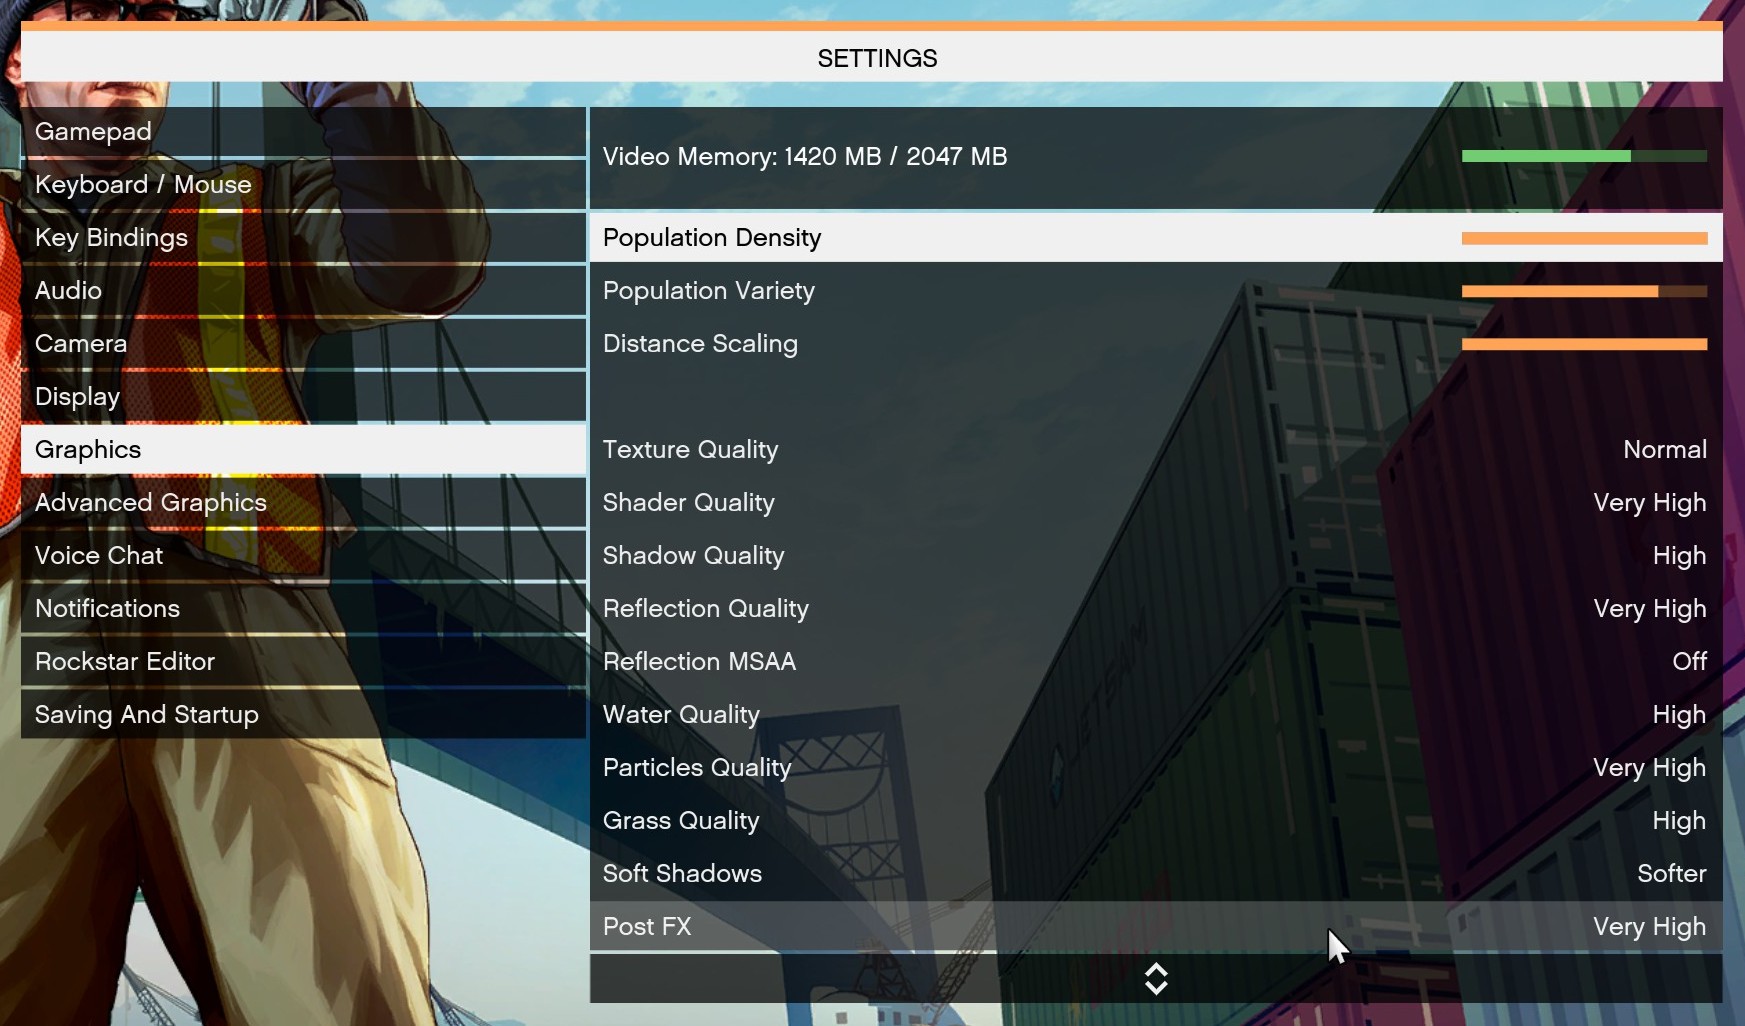
There are no presets for the graphics options on GTA, allowing the user to adjust options such as population density and distance scaling on sliders, but others such as texture/shadow/shader/water quality from Low to Very High. Other options include MSAA, soft shadows, post effects, shadow resolution and extended draw distance options. There is a handy option at the top which shows how much video memory the options are expected to consume, with obvious repercussions if a user requests more video memory than is present on the card (although there’s no obvious indication if you have a low end GPU with lots of GPU memory, like an R7 240 4GB).
To that end, we run the benchmark at 1920x1080 using an average of Very High on the settings, and also at 4K using High on most of them. We take the average results of four runs, reporting frame rate averages, 99th percentiles, and our time under analysis.
All of our benchmark results can also be found in our benchmark engine, Bench.
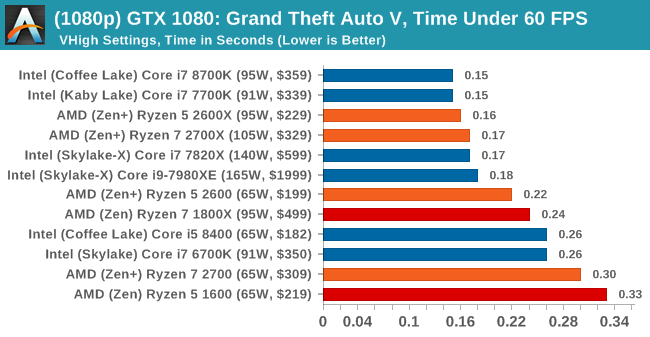
MSI GTX 1080 Gaming 8G Performance
1080p


4K


545 Comments
View All Comments
bsp2020 - Thursday, April 19, 2018 - link
Was AMD's recently announced Spectre mitigation used in the testing? I'm sorry if it was mentioned in the article. Too long and still in the process of reading.I'm a big fan of AMD but want to make sure the comparison is apples to apples. BTW, does anyone have link to performance impact analysis of AMD's Spectre mitigation?
fallaha56 - Thursday, April 19, 2018 - link
Yep, X470 is microcode parchedThis article as it stands is Intel Fanboi stuff
fallaha56 - Thursday, April 19, 2018 - link
As in the Toms articleSaturnusDK - Thursday, April 19, 2018 - link
Maybe he didn't notice that the tests are at stock speeds?DCide - Friday, April 20, 2018 - link
I can't find any other site using a BIOS as recent as the 0508 version you used (on the ASUS Crosshair VII Hero). Most sites are using older versions. These days, BIOS updates surrounding processor launches make significant performance differences. We've seen this with every Intel and AMD CPU launch since the original Ryzen.Shaheen Misra - Sunday, April 22, 2018 - link
Hi , im looking to gain some insight into your testing methods. Could you please explain why you test at such high graphics settings? Im sure you have previously stated the reasons but i am not familiar with them. My understanding has always been that this creates a graphics bottleneck?Targon - Monday, April 23, 2018 - link
When you consider that people want to see benchmark results how THEY would play the games or do work, it makes sense to focus on that sort of thing. Who plays at a 720p resolution? Yes, it may show CPU performance, or eliminate the GPU being the limiting factor, but if you have a Geforce 1080 GTX, 1080p, 1440, and then 4k performance is what people will actually game at.The ability to actually run video cards at or near their ability is also important, which can be a platform issue. If you see every CPU showing the same numbers with the same video card, then yea, it makes sense to go for the lower settings/resolutions, but since there ARE differences between the processors, running these tests the way they are makes more sense from a "these are similar to what people will see in the real world" perspective.
FlashYoshi - Thursday, April 19, 2018 - link
Intel CPUs were tested with Meltdown/Spectre patches, that's probably the discrepancy you're seeing.MuhOo - Thursday, April 19, 2018 - link
Computerbase and pcgameshardware also used the patched... every other site has completely different results from anandtechsor - Thursday, April 19, 2018 - link
Fwiw I took five minutes to see what you guys are talking about. To me it looks like Toms is screwed up. If you look at the time graphs it looks to me like it’s the purple line on top most of the time, but the summaries have that CPU in 3rd or 4th place. E.G. https://img.purch.com/r/711x457/aHR0cDovL21lZGlhLm...At any rate things are generally damn close, and they largely aren’t even benchmarking the same games, so I don’t understand why a few people are complaining.