The AMD 2nd Gen Ryzen Deep Dive: The 2700X, 2700, 2600X, and 2600 Tested
by Ian Cutress on April 19, 2018 9:00 AM ESTRise of the Tomb Raider
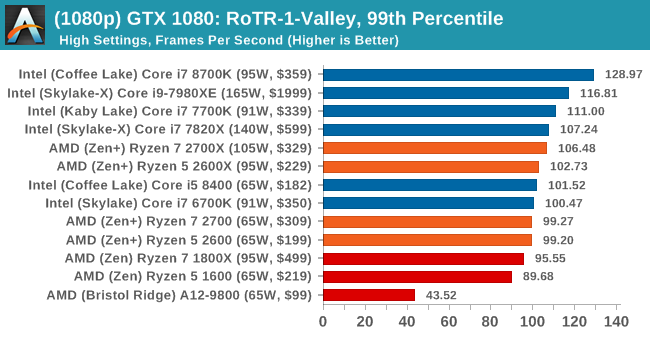
One of the newest games in the gaming benchmark suite is Rise of the Tomb Raider (RoTR), developed by Crystal Dynamics, and the sequel to the popular Tomb Raider which was loved for its automated benchmark mode. But don’t let that fool you: the benchmark mode in RoTR is very much different this time around.
Visually, the previous Tomb Raider pushed realism to the limits with features such as TressFX, and the new RoTR goes one stage further when it comes to graphics fidelity. This leads to an interesting set of requirements in hardware: some sections of the game are typically GPU limited, whereas others with a lot of long-range physics can be CPU limited, depending on how the driver can translate the DirectX 12 workload.
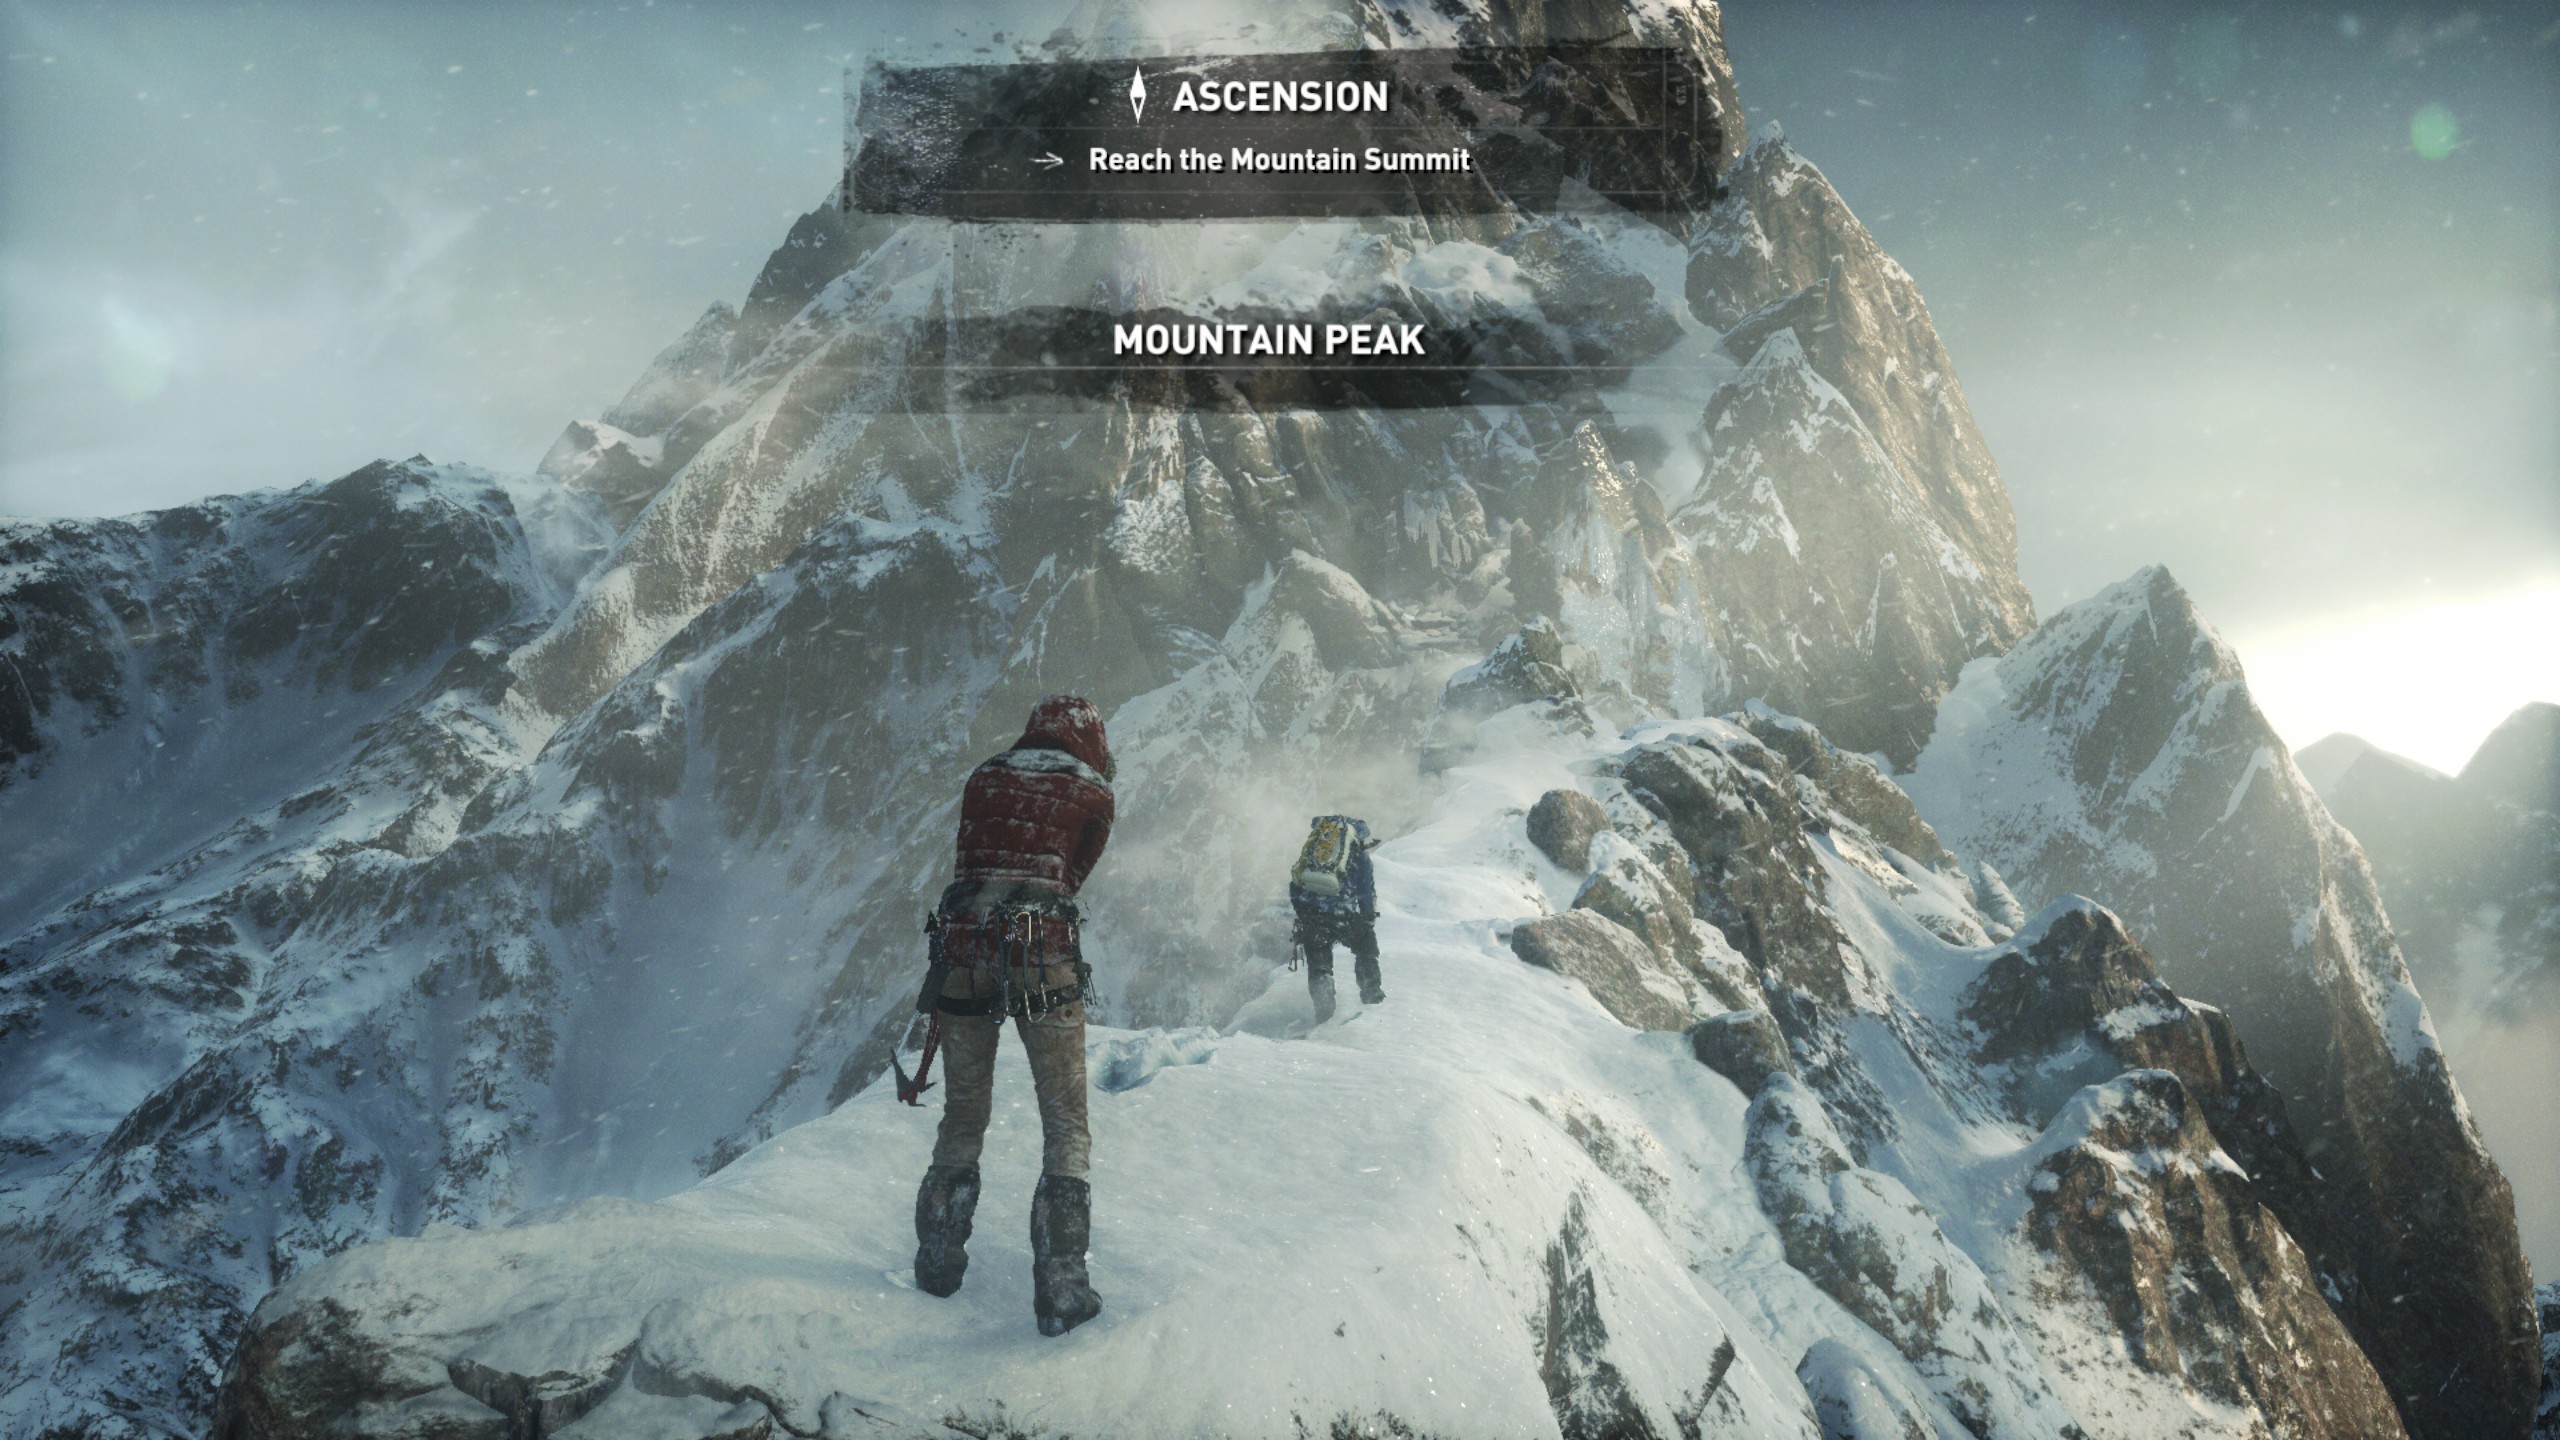
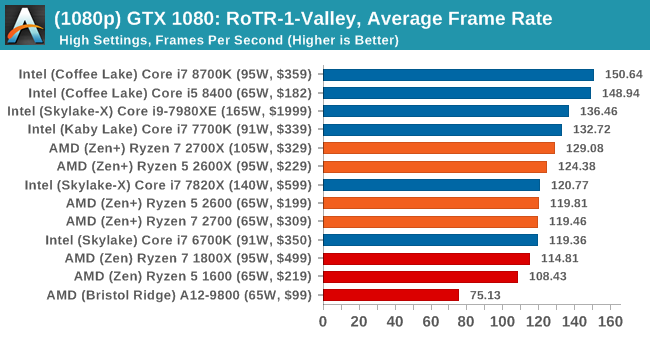
Where the old game had one benchmark scene, the new game has three different scenes with different requirements: Geothermal Valley (1-Valley), Prophet’s Tomb (2-Prophet) and Spine of the Mountain (3-Mountain) - and we test all three. These are three scenes designed to be taken from the game, but it has been noted that scenes like 2-Prophet shown in the benchmark can be the most CPU limited elements of that entire level, and the scene shown is only a small portion of that level. Because of this, we report the results for each scene on each graphics card separately.
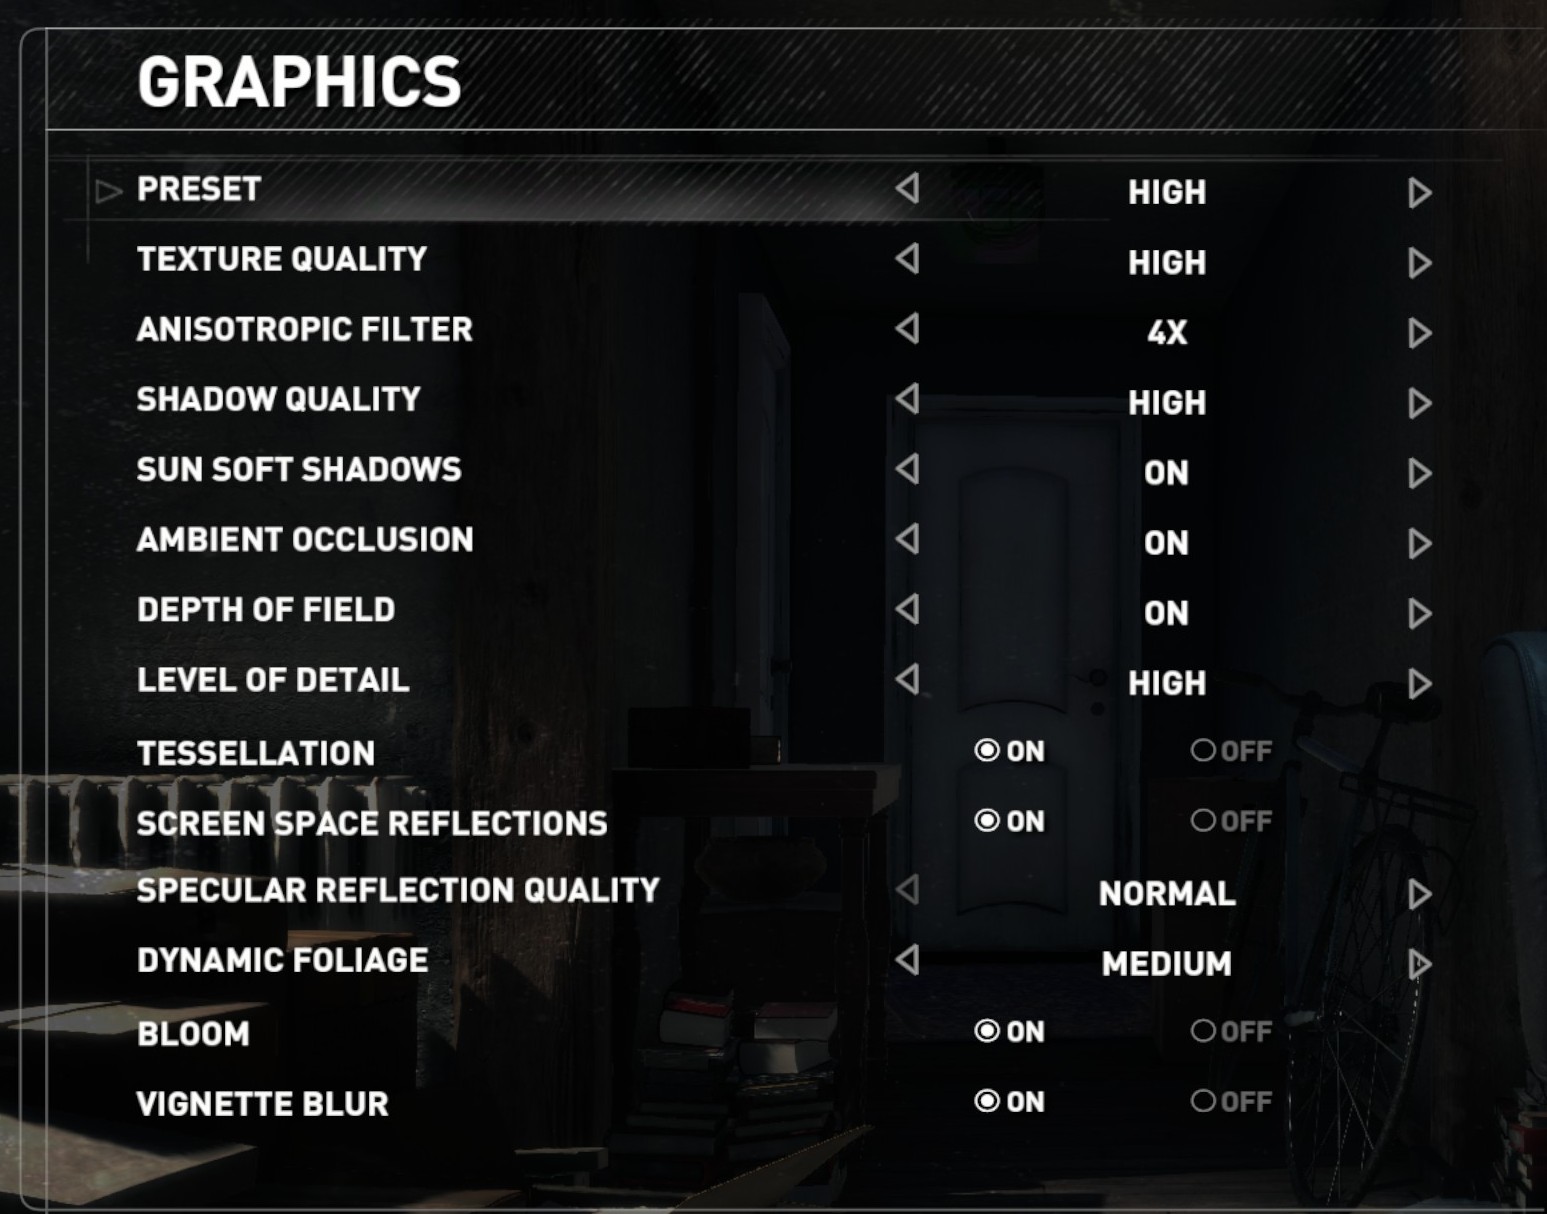
Graphics options for RoTR are similar to other games in this type, offering some presets or allowing the user to configure texture quality, anisotropic filter levels, shadow quality, soft shadows, occlusion, depth of field, tessellation, reflections, foliage, bloom, and features like PureHair which updates on TressFX in the previous game.
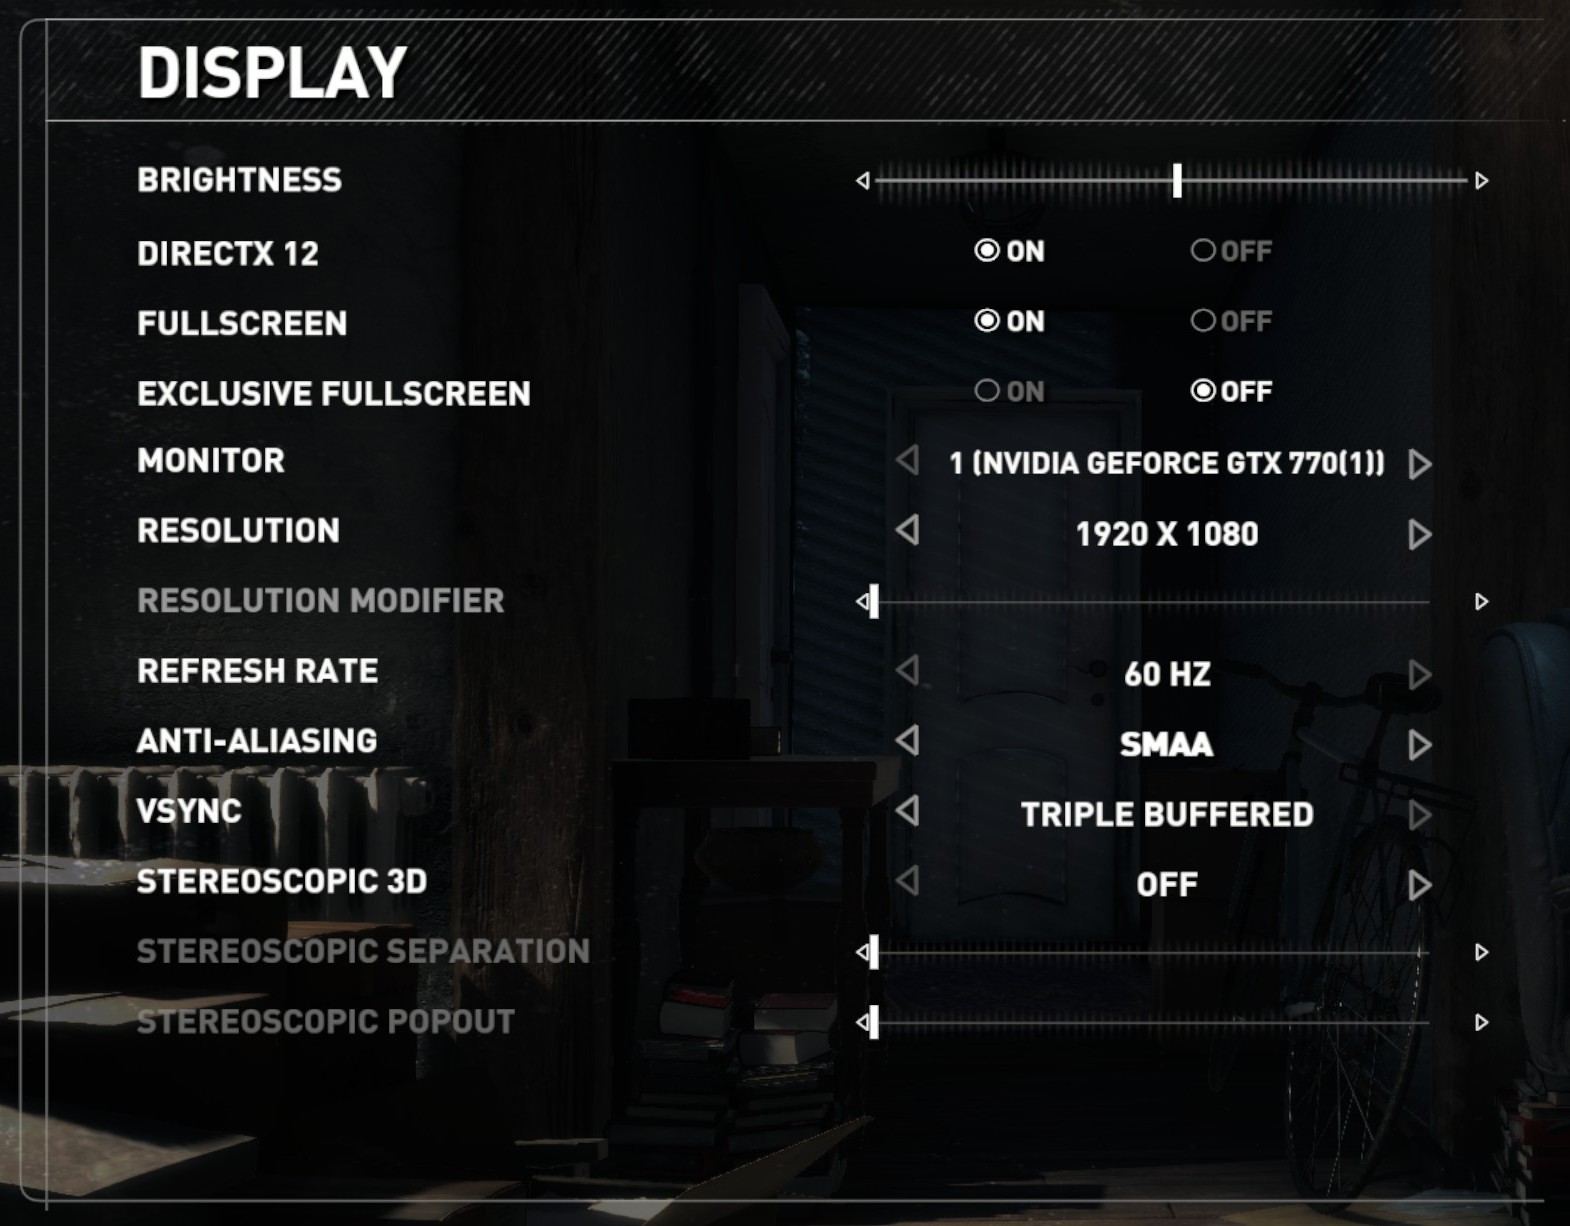
Again, we test at 1920x1080 and 4K using our native 4K displays. At 1080p we run the High preset, while at 4K we use the Medium preset which still takes a sizable hit in frame rate.
It is worth noting that RoTR is a little different to our other benchmarks in that it keeps its graphics settings in the registry rather than a standard ini file, and unlike the previous TR game the benchmark cannot be called from the command-line. Nonetheless we scripted around these issues to automate the benchmark four times and parse the results. From the frame time data, we report the averages, 99th percentiles, and our time under analysis.
All of our benchmark results can also be found in our benchmark engine, Bench.
1080p

4K


545 Comments
View All Comments
bsp2020 - Thursday, April 19, 2018 - link
Was AMD's recently announced Spectre mitigation used in the testing? I'm sorry if it was mentioned in the article. Too long and still in the process of reading.I'm a big fan of AMD but want to make sure the comparison is apples to apples. BTW, does anyone have link to performance impact analysis of AMD's Spectre mitigation?
fallaha56 - Thursday, April 19, 2018 - link
Yep, X470 is microcode parchedThis article as it stands is Intel Fanboi stuff
fallaha56 - Thursday, April 19, 2018 - link
As in the Toms articleSaturnusDK - Thursday, April 19, 2018 - link
Maybe he didn't notice that the tests are at stock speeds?DCide - Friday, April 20, 2018 - link
I can't find any other site using a BIOS as recent as the 0508 version you used (on the ASUS Crosshair VII Hero). Most sites are using older versions. These days, BIOS updates surrounding processor launches make significant performance differences. We've seen this with every Intel and AMD CPU launch since the original Ryzen.Shaheen Misra - Sunday, April 22, 2018 - link
Hi , im looking to gain some insight into your testing methods. Could you please explain why you test at such high graphics settings? Im sure you have previously stated the reasons but i am not familiar with them. My understanding has always been that this creates a graphics bottleneck?Targon - Monday, April 23, 2018 - link
When you consider that people want to see benchmark results how THEY would play the games or do work, it makes sense to focus on that sort of thing. Who plays at a 720p resolution? Yes, it may show CPU performance, or eliminate the GPU being the limiting factor, but if you have a Geforce 1080 GTX, 1080p, 1440, and then 4k performance is what people will actually game at.The ability to actually run video cards at or near their ability is also important, which can be a platform issue. If you see every CPU showing the same numbers with the same video card, then yea, it makes sense to go for the lower settings/resolutions, but since there ARE differences between the processors, running these tests the way they are makes more sense from a "these are similar to what people will see in the real world" perspective.
FlashYoshi - Thursday, April 19, 2018 - link
Intel CPUs were tested with Meltdown/Spectre patches, that's probably the discrepancy you're seeing.MuhOo - Thursday, April 19, 2018 - link
Computerbase and pcgameshardware also used the patched... every other site has completely different results from anandtechsor - Thursday, April 19, 2018 - link
Fwiw I took five minutes to see what you guys are talking about. To me it looks like Toms is screwed up. If you look at the time graphs it looks to me like it’s the purple line on top most of the time, but the summaries have that CPU in 3rd or 4th place. E.G. https://img.purch.com/r/711x457/aHR0cDovL21lZGlhLm...At any rate things are generally damn close, and they largely aren’t even benchmarking the same games, so I don’t understand why a few people are complaining.