The AMD 2nd Gen Ryzen Deep Dive: The 2700X, 2700, 2600X, and 2600 Tested
by Ian Cutress on April 19, 2018 9:00 AM ESTCPU Web Tests
One of the issues when running web-based tests is the nature of modern browsers to automatically install updates. This means any sustained period of benchmarking will invariably fall foul of the 'it's updated beyond the state of comparison' rule, especially when browsers will update if you give them half a second to think about it. Despite this, we were able to find a series of commands to create an un-updatable version of Chrome 56 for our 2017 test suite. While this means we might not be on the bleeding edge of the latest browser, it makes the scores between CPUs comparable.
All of our benchmark results can also be found in our benchmark engine, Bench.
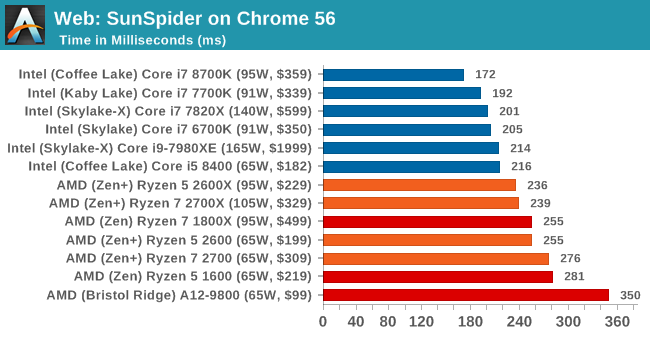
SunSpider 1.0.2: link
The oldest web-based benchmark in this portion of our test is SunSpider. This is a very basic javascript algorithm tool, and ends up being more a measure of IPC and latency than anything else, with most high-performance CPUs scoring around about the same. The basic test is looped 10 times and the average taken. We run the basic test 4 times.
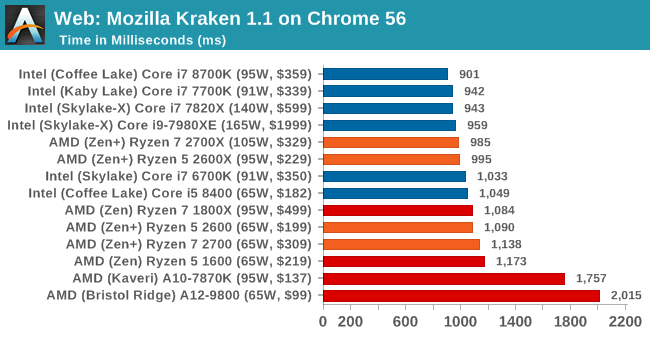
Mozilla Kraken 1.1: link
Kraken is another Javascript based benchmark, using the same test harness as SunSpider, but focusing on more stringent real-world use cases and libraries, such as audio processing and image filters. Again, the basic test is looped ten times, and we run the basic test four times.
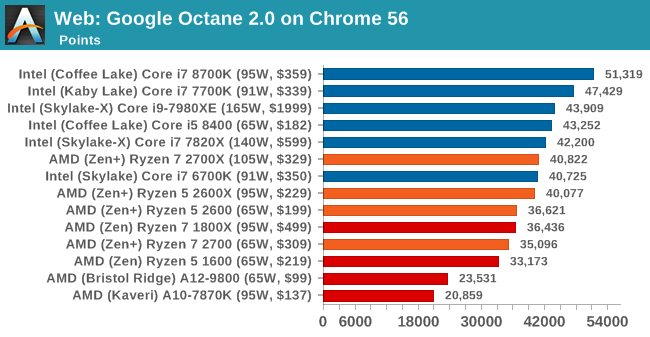
Google Octane 2.0: link
Along with Mozilla, as Google is a major browser developer, having peak JS performance is typically a critical asset when comparing against the other OS developers. In the same way that SunSpider is a very early JS benchmark, and Kraken is a bit newer, Octane aims to be more relevant to real workloads, especially in power constrained devices such as smartphones and tablets.
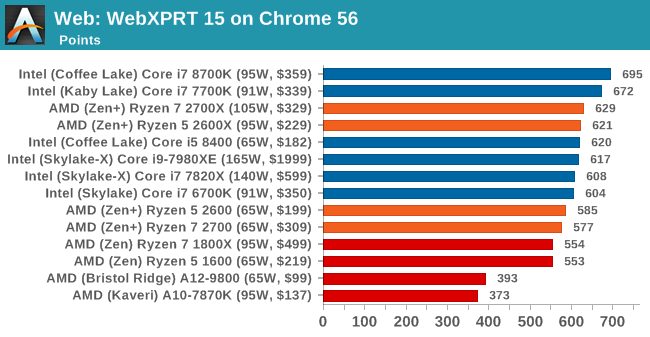
WebXPRT 2015: link
While the previous three benchmarks do calculations in the background and represent a score, WebXPRT is designed to be a better interpretation of visual workloads that a professional user might have, such as browser based applications, graphing, image editing, sort/analysis, scientific analysis and financial tools.


545 Comments
View All Comments
bsp2020 - Thursday, April 19, 2018 - link
Was AMD's recently announced Spectre mitigation used in the testing? I'm sorry if it was mentioned in the article. Too long and still in the process of reading.I'm a big fan of AMD but want to make sure the comparison is apples to apples. BTW, does anyone have link to performance impact analysis of AMD's Spectre mitigation?
fallaha56 - Thursday, April 19, 2018 - link
Yep, X470 is microcode parchedThis article as it stands is Intel Fanboi stuff
fallaha56 - Thursday, April 19, 2018 - link
As in the Toms articleSaturnusDK - Thursday, April 19, 2018 - link
Maybe he didn't notice that the tests are at stock speeds?DCide - Friday, April 20, 2018 - link
I can't find any other site using a BIOS as recent as the 0508 version you used (on the ASUS Crosshair VII Hero). Most sites are using older versions. These days, BIOS updates surrounding processor launches make significant performance differences. We've seen this with every Intel and AMD CPU launch since the original Ryzen.Shaheen Misra - Sunday, April 22, 2018 - link
Hi , im looking to gain some insight into your testing methods. Could you please explain why you test at such high graphics settings? Im sure you have previously stated the reasons but i am not familiar with them. My understanding has always been that this creates a graphics bottleneck?Targon - Monday, April 23, 2018 - link
When you consider that people want to see benchmark results how THEY would play the games or do work, it makes sense to focus on that sort of thing. Who plays at a 720p resolution? Yes, it may show CPU performance, or eliminate the GPU being the limiting factor, but if you have a Geforce 1080 GTX, 1080p, 1440, and then 4k performance is what people will actually game at.The ability to actually run video cards at or near their ability is also important, which can be a platform issue. If you see every CPU showing the same numbers with the same video card, then yea, it makes sense to go for the lower settings/resolutions, but since there ARE differences between the processors, running these tests the way they are makes more sense from a "these are similar to what people will see in the real world" perspective.
FlashYoshi - Thursday, April 19, 2018 - link
Intel CPUs were tested with Meltdown/Spectre patches, that's probably the discrepancy you're seeing.MuhOo - Thursday, April 19, 2018 - link
Computerbase and pcgameshardware also used the patched... every other site has completely different results from anandtechsor - Thursday, April 19, 2018 - link
Fwiw I took five minutes to see what you guys are talking about. To me it looks like Toms is screwed up. If you look at the time graphs it looks to me like it’s the purple line on top most of the time, but the summaries have that CPU in 3rd or 4th place. E.G. https://img.purch.com/r/711x457/aHR0cDovL21lZGlhLm...At any rate things are generally damn close, and they largely aren’t even benchmarking the same games, so I don’t understand why a few people are complaining.