The AMD 2nd Gen Ryzen Deep Dive: The 2700X, 2700, 2600X, and 2600 Tested
by Ian Cutress on April 19, 2018 9:00 AM ESTRise of the Tomb Raider
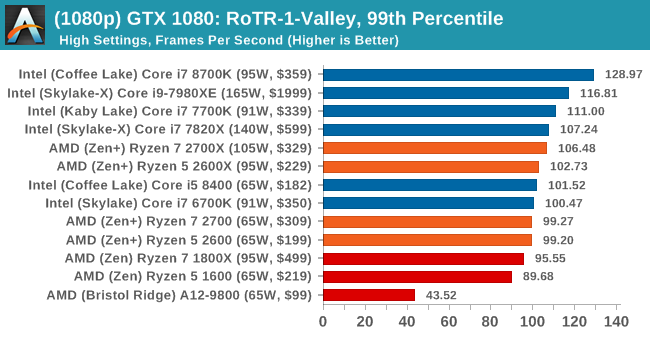
One of the newest games in the gaming benchmark suite is Rise of the Tomb Raider (RoTR), developed by Crystal Dynamics, and the sequel to the popular Tomb Raider which was loved for its automated benchmark mode. But don’t let that fool you: the benchmark mode in RoTR is very much different this time around.
Visually, the previous Tomb Raider pushed realism to the limits with features such as TressFX, and the new RoTR goes one stage further when it comes to graphics fidelity. This leads to an interesting set of requirements in hardware: some sections of the game are typically GPU limited, whereas others with a lot of long-range physics can be CPU limited, depending on how the driver can translate the DirectX 12 workload.
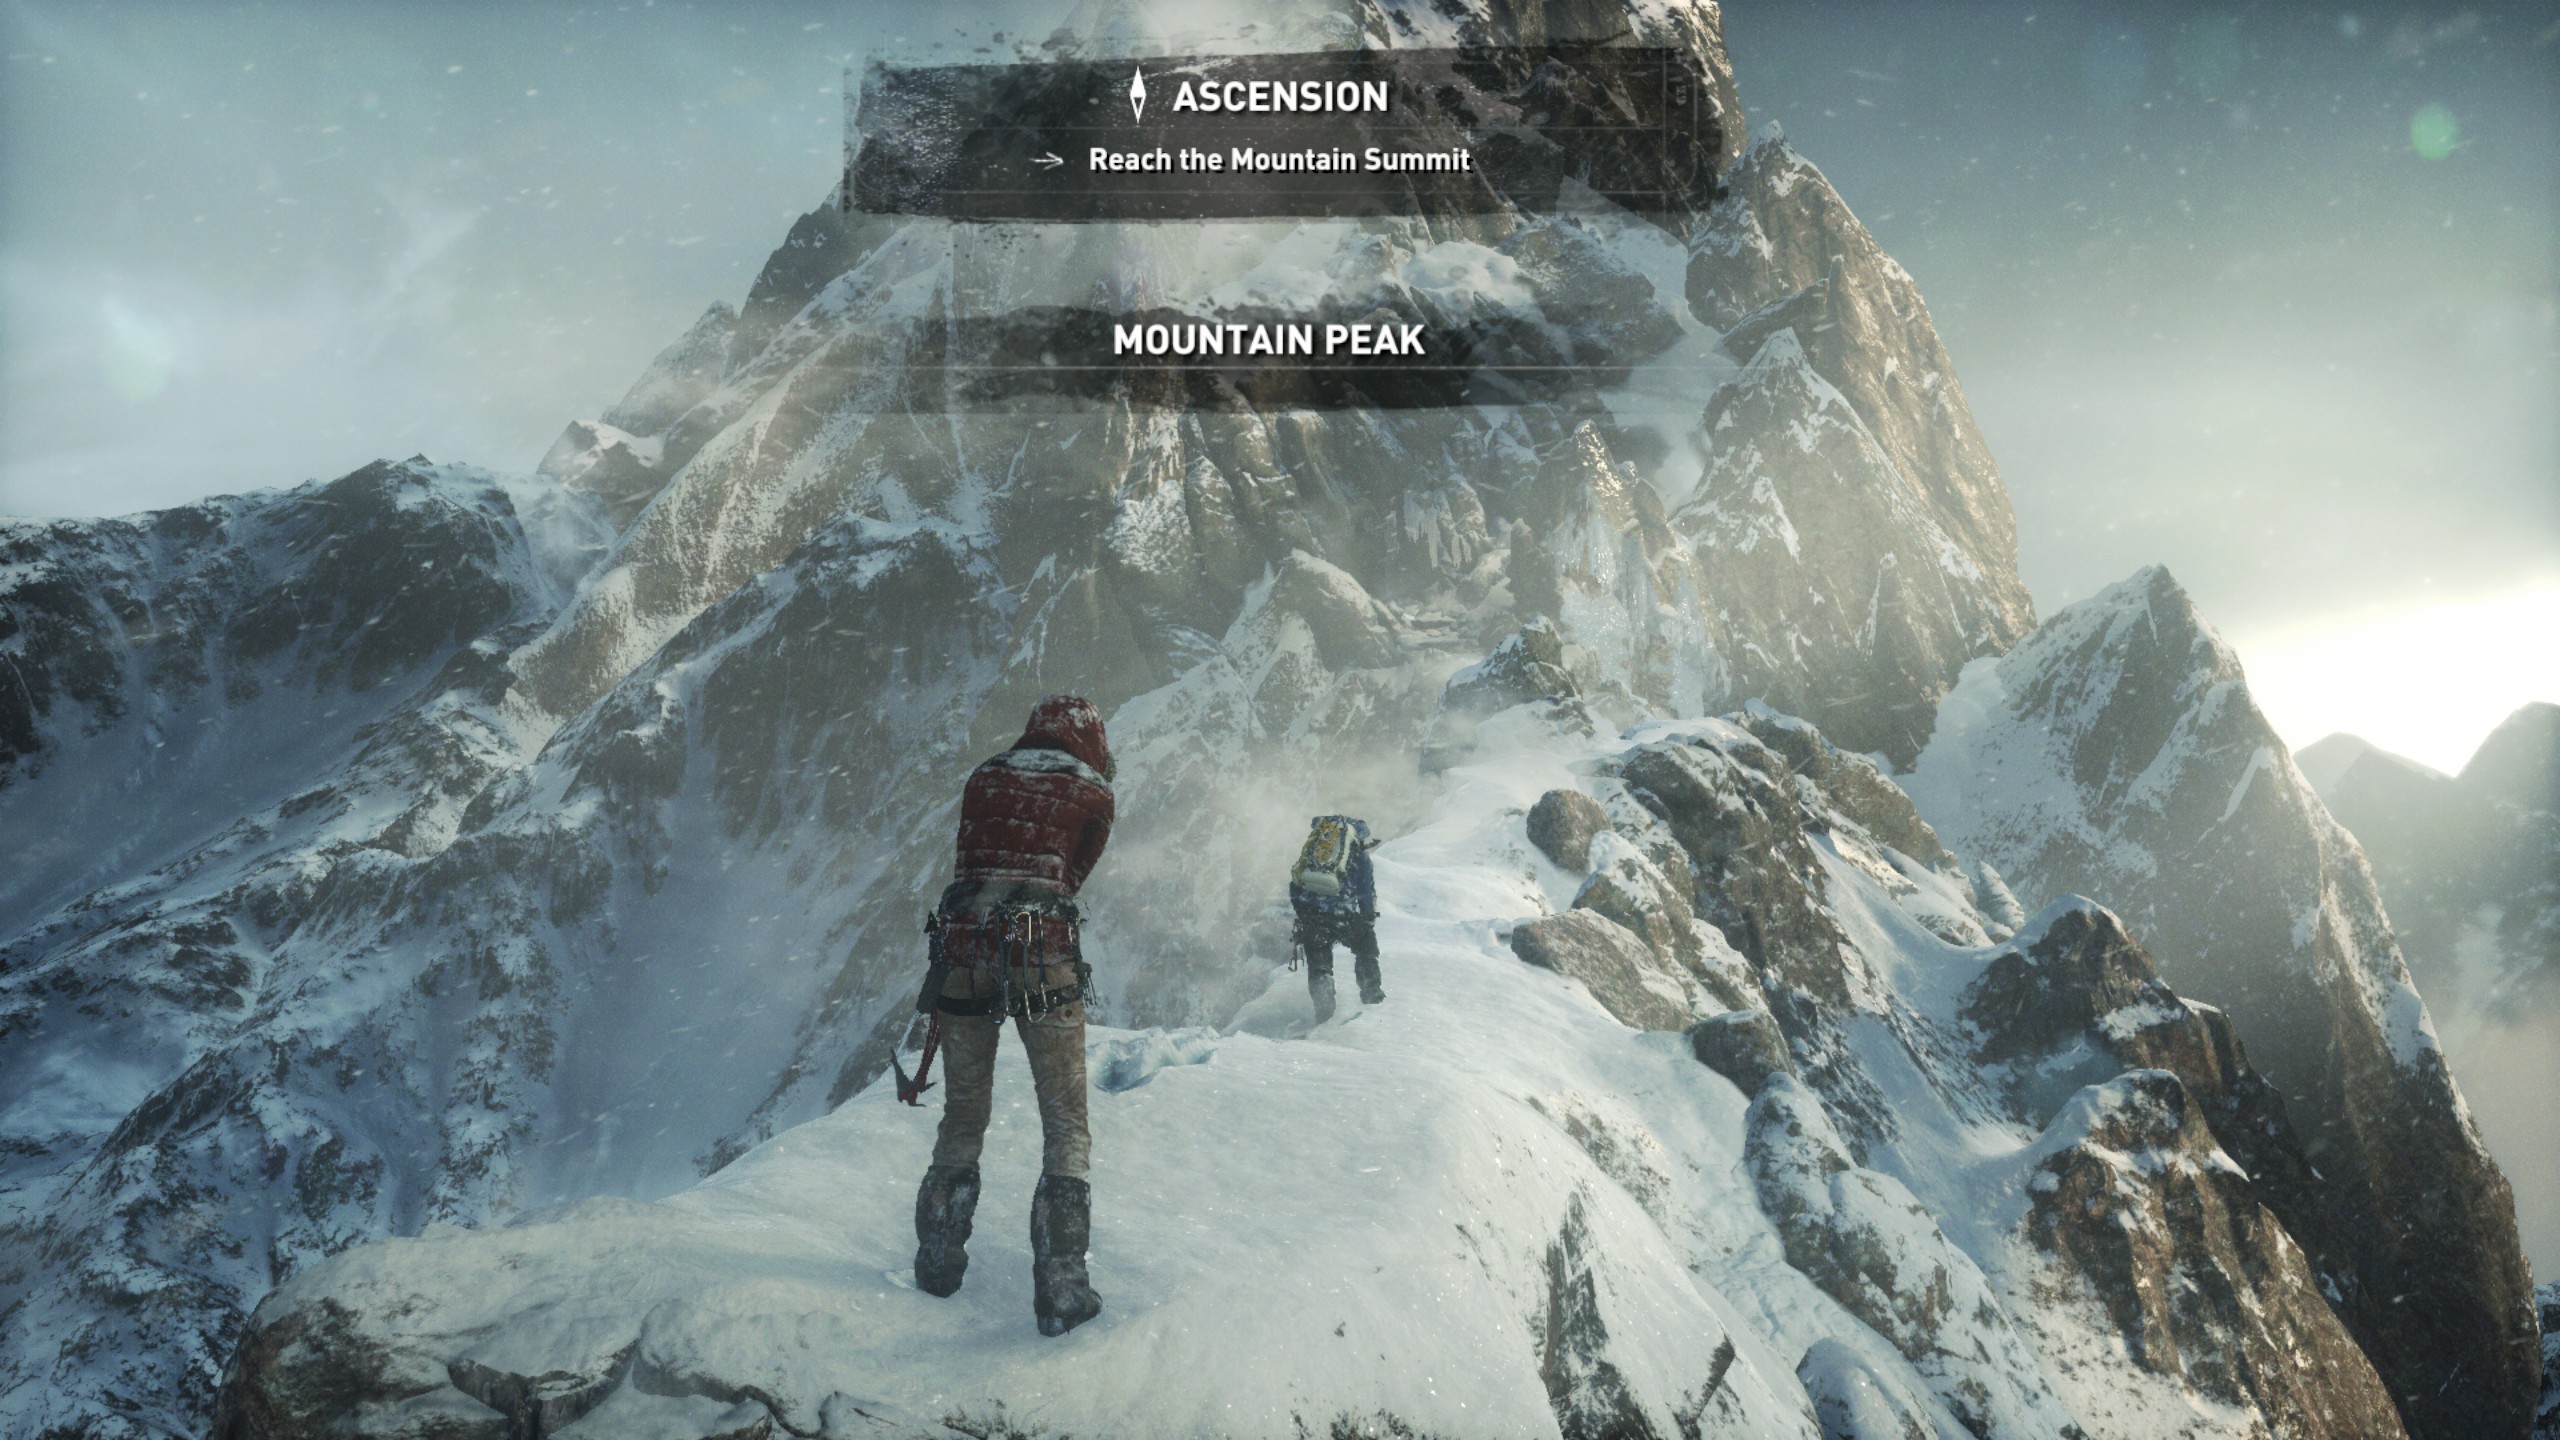
Where the old game had one benchmark scene, the new game has three different scenes with different requirements: Geothermal Valley (1-Valley), Prophet’s Tomb (2-Prophet) and Spine of the Mountain (3-Mountain) - and we test all three. These are three scenes designed to be taken from the game, but it has been noted that scenes like 2-Prophet shown in the benchmark can be the most CPU limited elements of that entire level, and the scene shown is only a small portion of that level. Because of this, we report the results for each scene on each graphics card separately.
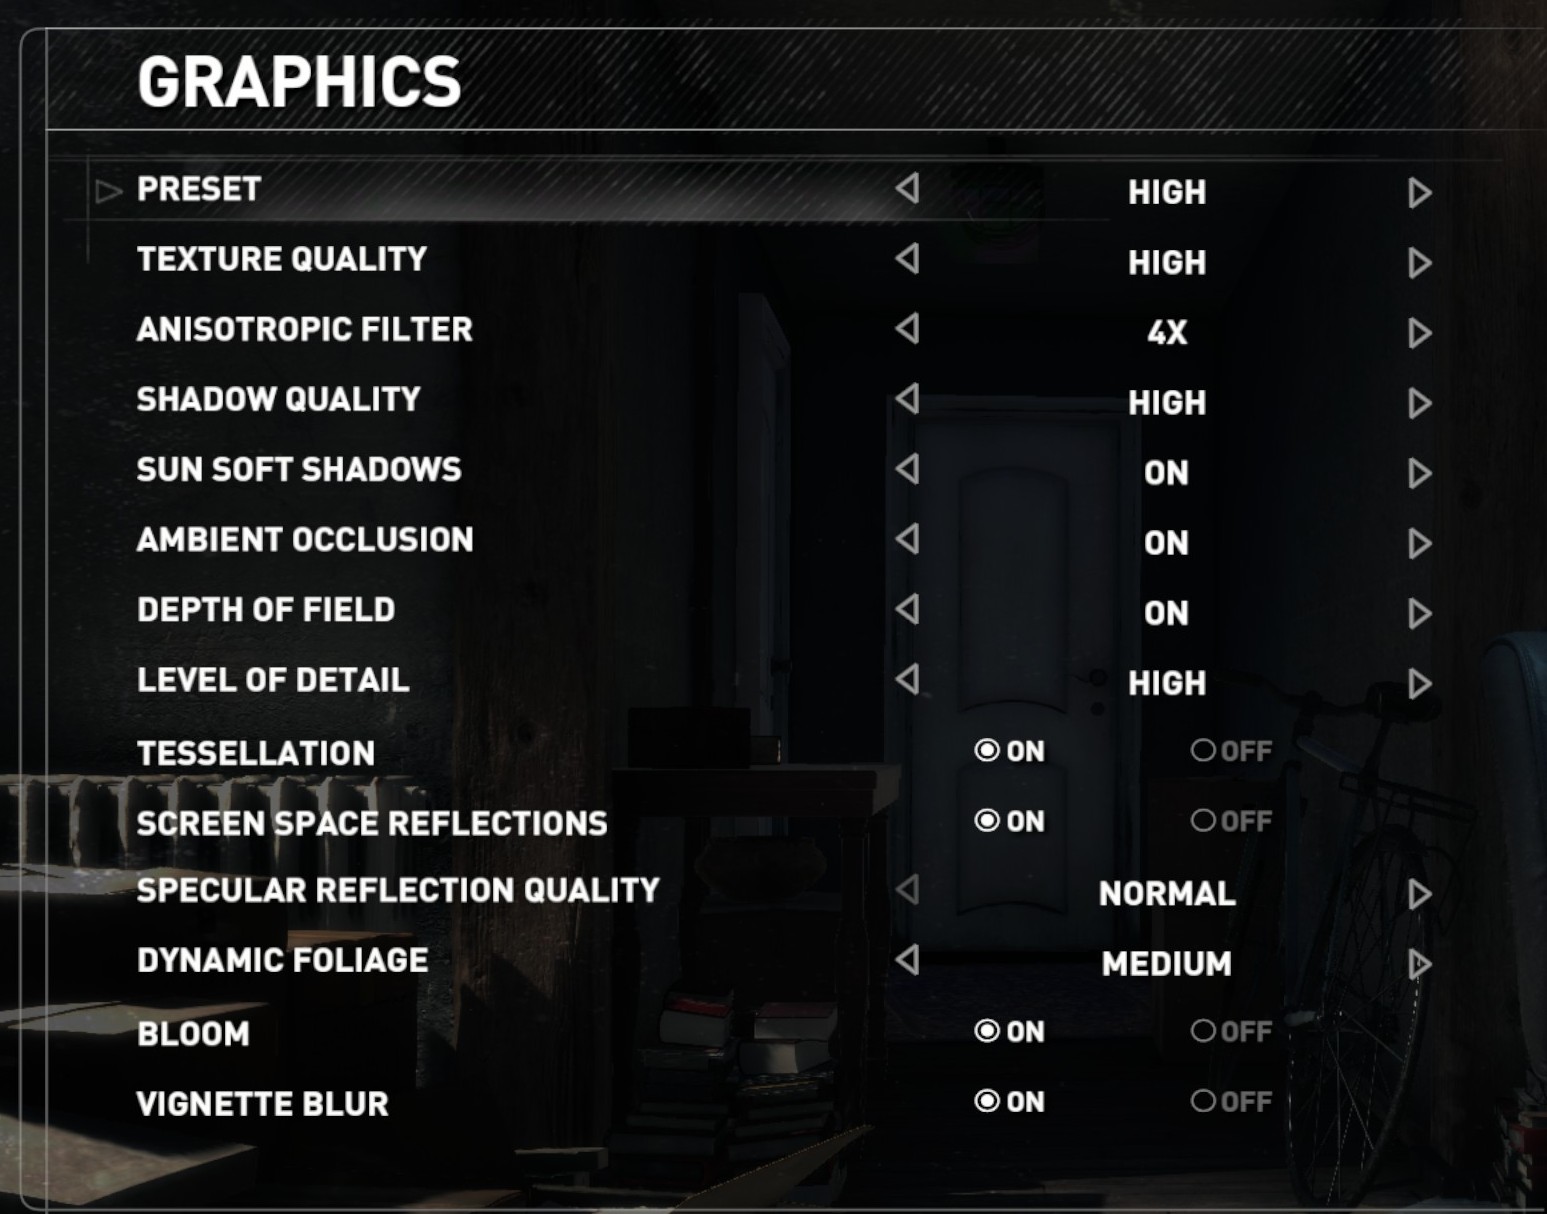
Graphics options for RoTR are similar to other games in this type, offering some presets or allowing the user to configure texture quality, anisotropic filter levels, shadow quality, soft shadows, occlusion, depth of field, tessellation, reflections, foliage, bloom, and features like PureHair which updates on TressFX in the previous game.
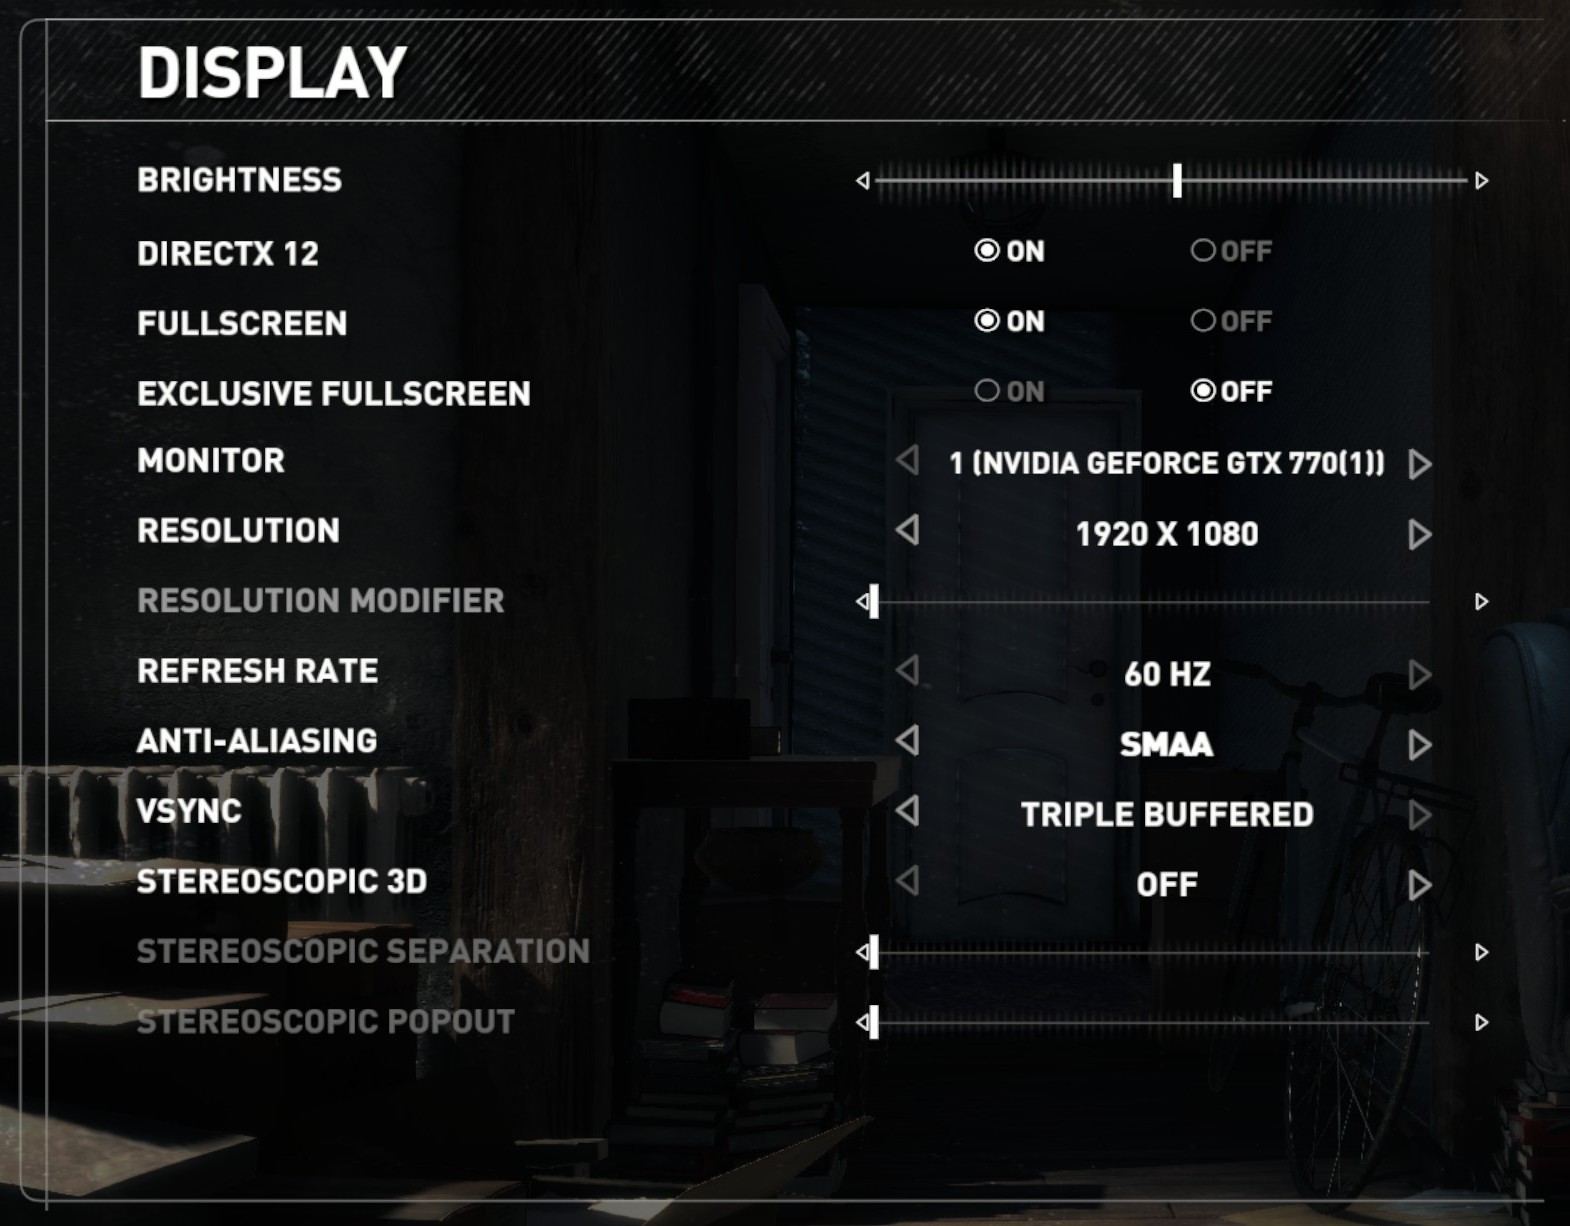
Again, we test at 1920x1080 and 4K using our native 4K displays. At 1080p we run the High preset, while at 4K we use the Medium preset which still takes a sizable hit in frame rate.
It is worth noting that RoTR is a little different to our other benchmarks in that it keeps its graphics settings in the registry rather than a standard ini file, and unlike the previous TR game the benchmark cannot be called from the command-line. Nonetheless we scripted around these issues to automate the benchmark four times and parse the results. From the frame time data, we report the averages, 99th percentiles, and our time under analysis.
All of our benchmark results can also be found in our benchmark engine, Bench.
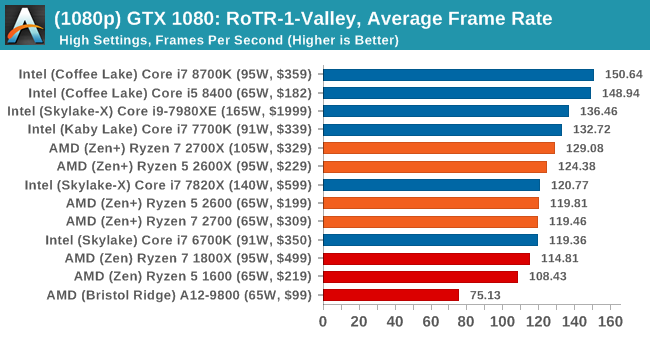
1080p

4K


545 Comments
View All Comments
John_M - Friday, May 11, 2018 - link
And still there's nothing on the StoreMI page. What's the excuse for that?AmbroseAthan - Friday, May 18, 2018 - link
Are we really over 3.5 weeks after this was updated as TBD, and you guys have fallen this far behind?This is not the standard I feel like Anandtech normally adheres to.
klatscho - Monday, May 21, 2018 - link
I second that.Maxiking - Monday, May 21, 2018 - link
LOL, the benchmarks are now updated, Ryzen+ absolutely outperformed in games by 8700k even with Meltdown and Spectre patches. So nothing new, Ryzen is still bad.klatscho - Monday, May 21, 2018 - link
If your usecase is 1080p gaming I would agree, however the difference becomes marginal as resolution increases. Also keep in mind that the 8700k currently retails for about $20 more than the 2700x and doesn't include a cooler, which means it is overall about $50 dearer...peevee - Tuesday, May 22, 2018 - link
"and the speed is limited to how the system reads from a drive that spins at 7200 or 5400 times per second"It is PER MINUTE. As in RPM.
cvearl - Friday, June 8, 2018 - link
My 2600 X at stock does 177 in single core cinebench. But that is with h100i V2 cooler. With the default cooler it gets the same score as you 173. The cooler the chip the higher the Boost. Also out-of-the-box XMP in the Bios Works 3200 no problem. In fact cl14. Out of the box versus my 1600 X in the exact same system it is 15% faster across the board.virpuain@gmail.com - Tuesday, June 19, 2018 - link
Nice review.On thing that bothers me is the inclusion of Winrar for this review without a note stating it is a underperforming compression tool. It is know that 7zip can compress almost twice as fast as Winrar.
Not that but also the lack of consistency in between compressions tests as instead of compressing and decrompressing a set file you are taking different procedures for each benchmark. I mean the job is to compress/decompress, let the user know how it does and why it does that.
0ldman79 - Monday, July 23, 2018 - link
I realize they probably don't have an FX 6300 and 83xx system for comparison.The FX 8350 scores 23719 MIPS on the 64 MB 7zip test, a good deal higher than the Kaveri or Bristol Ridge. I need to bench my 6300 just for giggles.
mrinmaydhar - Friday, July 27, 2018 - link
Try and run a S.M.A.R.T. test on the drives. The virtual adapter is unable to provide any data and causes a Blue-Screen. At least the last time I used the Enmotus version did.