The AMD 2nd Gen Ryzen Deep Dive: The 2700X, 2700, 2600X, and 2600 Tested
by Ian Cutress on April 19, 2018 9:00 AM ESTCPU Office Tests
The office programs we use for benchmarking aren't specific programs per-se, but industry standard tests that hold weight with professionals. The goal of these tests is to use an array of software and techniques that a typical office user might encounter, such as video conferencing, document editing, architectural modelling, and so on and so forth.
All of our benchmark results can also be found in our benchmark engine, Bench.
Chromium Compile (v56)
Our new compilation test uses Windows 10 Pro, VS Community 2015.3 with the Win10 SDK to combile a nightly build of Chromium. We've fixed the test for a build in late March 2017, and we run a fresh full compile in our test. Compilation is the typical example given of a variable threaded workload - some of the compile and linking is linear, whereas other parts are multithreaded.
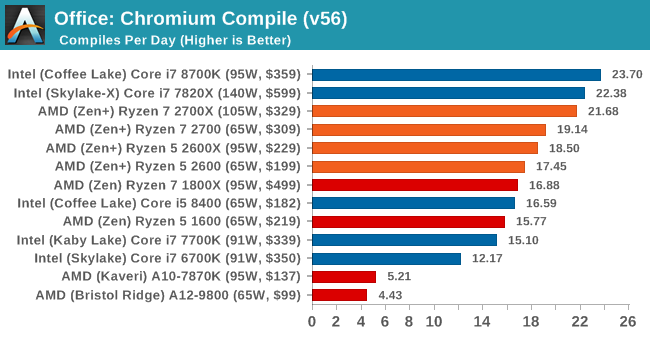
Having redone our compile testing, we can see that the new Ryzen-2000 series parts do provide a good uplift over the first generation, likely due to the decreased cache latencies and better precision boost. Performance per dollar between the 8700K and the 2700X would seem to be about equal as well.
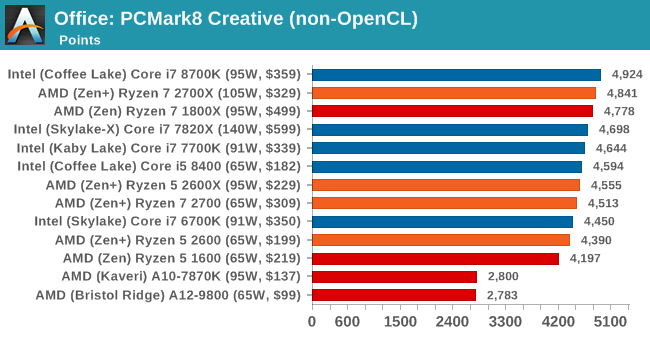
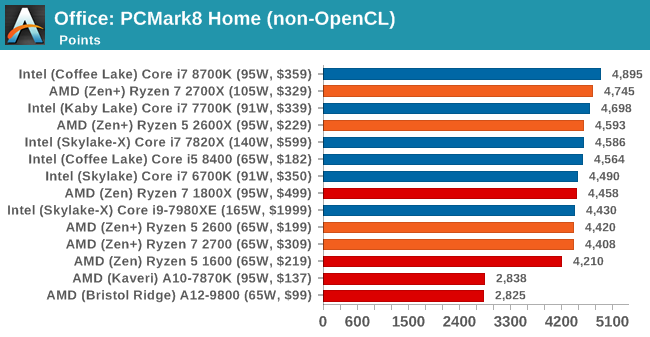
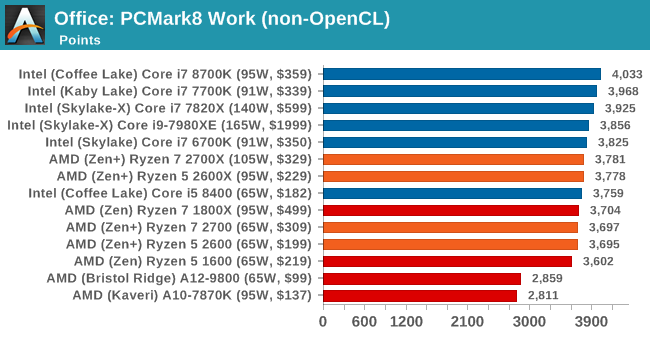
PCMark8: link
Despite originally coming out in 2008/2009, Futuremark has maintained PCMark8 to remain relevant in 2017. On the scale of complicated tasks, PCMark focuses more on the low-to-mid range of professional workloads, making it a good indicator for what people consider 'office' work. We run the benchmark from the commandline in 'conventional' mode, meaning C++ over OpenCL, to remove the graphics card from the equation and focus purely on the CPU. PCMark8 offers Home, Work and Creative workloads, with some software tests shared and others unique to each benchmark set.
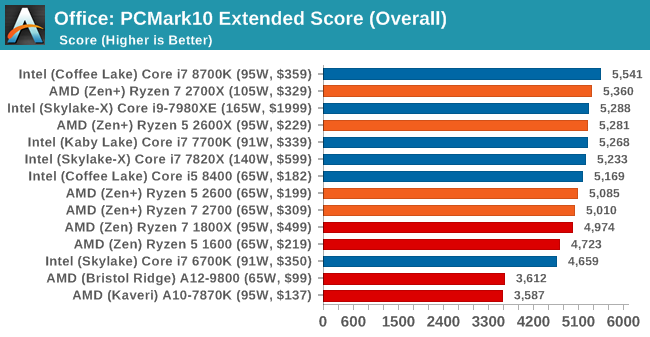
PCMark 10
GeekBench4
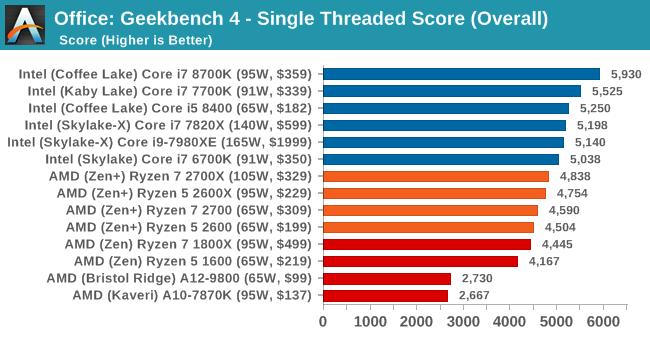
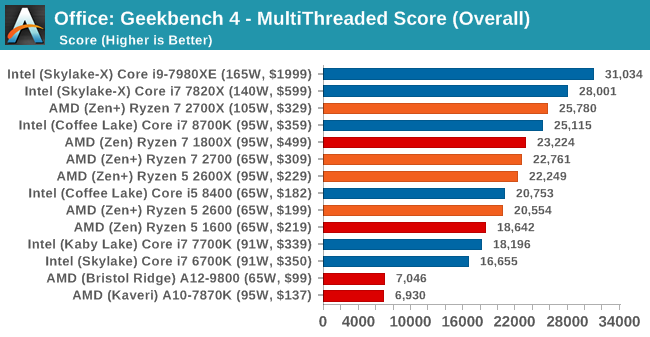
If you live and breathe GeekBench 4, then the single threaded results put Intel firmly in first place. For the multi-threaded tests, the top Intel and AMD mainstream parts are going at it almost neck-and-neck, however it is clear that the previous generation quad-cores are falling behind.


545 Comments
View All Comments
John_M - Friday, May 11, 2018 - link
And still there's nothing on the StoreMI page. What's the excuse for that?AmbroseAthan - Friday, May 18, 2018 - link
Are we really over 3.5 weeks after this was updated as TBD, and you guys have fallen this far behind?This is not the standard I feel like Anandtech normally adheres to.
klatscho - Monday, May 21, 2018 - link
I second that.Maxiking - Monday, May 21, 2018 - link
LOL, the benchmarks are now updated, Ryzen+ absolutely outperformed in games by 8700k even with Meltdown and Spectre patches. So nothing new, Ryzen is still bad.klatscho - Monday, May 21, 2018 - link
If your usecase is 1080p gaming I would agree, however the difference becomes marginal as resolution increases. Also keep in mind that the 8700k currently retails for about $20 more than the 2700x and doesn't include a cooler, which means it is overall about $50 dearer...peevee - Tuesday, May 22, 2018 - link
"and the speed is limited to how the system reads from a drive that spins at 7200 or 5400 times per second"It is PER MINUTE. As in RPM.
cvearl - Friday, June 8, 2018 - link
My 2600 X at stock does 177 in single core cinebench. But that is with h100i V2 cooler. With the default cooler it gets the same score as you 173. The cooler the chip the higher the Boost. Also out-of-the-box XMP in the Bios Works 3200 no problem. In fact cl14. Out of the box versus my 1600 X in the exact same system it is 15% faster across the board.virpuain@gmail.com - Tuesday, June 19, 2018 - link
Nice review.On thing that bothers me is the inclusion of Winrar for this review without a note stating it is a underperforming compression tool. It is know that 7zip can compress almost twice as fast as Winrar.
Not that but also the lack of consistency in between compressions tests as instead of compressing and decrompressing a set file you are taking different procedures for each benchmark. I mean the job is to compress/decompress, let the user know how it does and why it does that.
0ldman79 - Monday, July 23, 2018 - link
I realize they probably don't have an FX 6300 and 83xx system for comparison.The FX 8350 scores 23719 MIPS on the 64 MB 7zip test, a good deal higher than the Kaveri or Bristol Ridge. I need to bench my 6300 just for giggles.
mrinmaydhar - Friday, July 27, 2018 - link
Try and run a S.M.A.R.T. test on the drives. The virtual adapter is unable to provide any data and causes a Blue-Screen. At least the last time I used the Enmotus version did.