The AMD 2nd Gen Ryzen Deep Dive: The 2700X, 2700, 2600X, and 2600 Tested
by Ian Cutress on April 19, 2018 9:00 AM ESTCPU System Tests
Our first set of tests is our general system tests. These set of tests are meant to emulate more about what people usually do on a system, like opening large files or processing small stacks of data. This is a bit different to our office testing, which uses more industry standard benchmarks, and a few of the benchmarks here are relatively new and different.
All of our benchmark results can also be found in our benchmark engine, Bench.
FCAT Processing: link
One of the more interesting workloads that has crossed our desks in recent quarters is FCAT - the tool we use to measure stuttering in gaming due to dropped or runt frames. The FCAT process requires enabling a color-based overlay onto a game, recording the gameplay, and then parsing the video file through the analysis software. The software is mostly single-threaded, however because the video is basically in a raw format, the file size is large and requires moving a lot of data around. For our test, we take a 90-second clip of the Rise of the Tomb Raider benchmark running on a GTX 980 Ti at 1440p, which comes in around 21 GB, and measure the time it takes to process through the visual analysis tool.
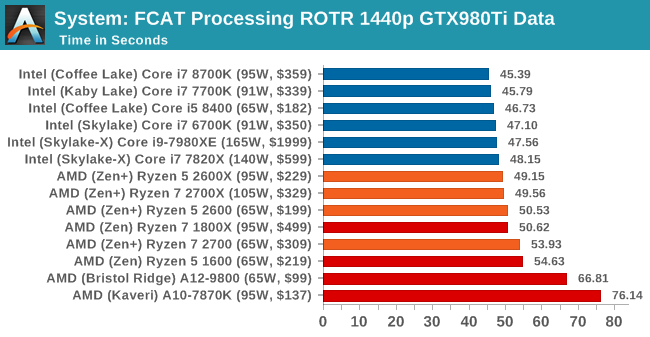
FCAT is a purely single threaded task, and it takes benefits from the top frequency parts and high IPC from Intel. On the AMD front, the Ryzen 5 parts are scoring better than the Ryzen 7 parts, but are within an error margin.
Dolphin Benchmark: link
Many emulators are often bound by single thread CPU performance, and general reports tended to suggest that Haswell provided a significant boost to emulator performance. This benchmark runs a Wii program that ray traces a complex 3D scene inside the Dolphin Wii emulator. Performance on this benchmark is a good proxy of the speed of Dolphin CPU emulation, which is an intensive single core task using most aspects of a CPU. Results are given in minutes, where the Wii itself scores 17.53 minutes (1052 seconds).
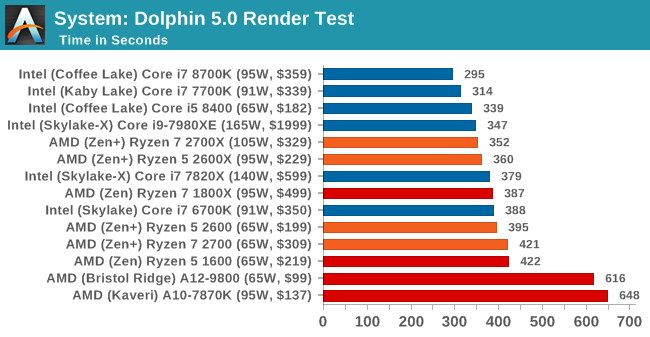
Dolphin is also a single threaded test, and has historically had benefits on Intel CPUs. The new Ryzen-2000 series, with extra IPC and frequency, are pushing ahead of Intel's Skylake parts.
3D Movement Algorithm Test v2.1: link
This is the latest version of the self-penned 3DPM benchmark. The goal of 3DPM is to simulate semi-optimized scientific algorithms taken directly from my doctorate thesis. Version 2.1 improves over 2.0 by passing the main particle structs by reference rather than by value, and decreasing the amount of double->float->double recasts the compiler was adding in. It affords a ~25% speed-up over v2.0, which means new data.
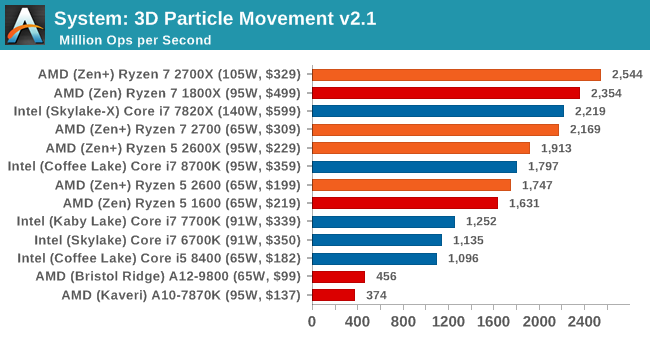
For this multi-threaded test, the new 8-core Ryzen 7 2700X pulls further head of Intel's 8-core Skylake-X compared to the 1800X. At six cores however, the Coffee Lake i7-8700K is sandwiched between the Ryzen 5 2600X and Ryzen 5 2600.
Agisoft Photoscan 1.3: link
Photoscan stays in our benchmark suite from the previous version, however now we are running on Windows 10 so features such as Speed Shift on the latest processors come into play. The concept of Photoscan is translating many 2D images into a 3D model - so the more detailed the images, and the more you have, the better the model. The algorithm has four stages, some single threaded and some multi-threaded, along with some cache/memory dependency in there as well. For some of the more variable threaded workload, features such as Speed Shift and XFR will be able to take advantage of CPU stalls or downtime, giving sizeable speedups on newer microarchitectures.
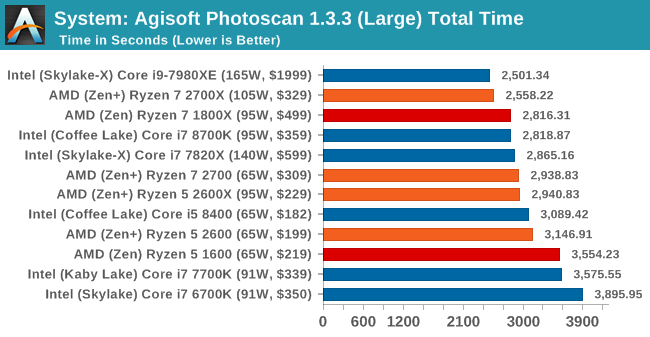
Photoscan is a variable threaded test, and time improvement from the 1800X to the 2700X shows the extra TDP and Precision Boost 2 can literally shave minutes from a test. Intel's slower mesh architecture of Skylake-X on the 8-core 7820X compared to the ring architecture of the Coffee Lake 8700K means that the two fewer cores on the 8700K allows them to draw level, but they are still four minutes or so behind the Ryzen 7 2700X. The big 18-core Intel CPU, the i9-7980XE, is needed to win here.
Civilization6 AI Test
Our Civilization AI test uses the steam version of Civilization 6 and runs the in-game AI test to process 25 rounds of an example end-game. We run the benchmark on our GTX 1080 at 1080p Medium to ensure that rendering is not a limiting factor, and the results are given as the geometric mean of the 25 rounds in the test, to give the average time to process one round of AI.
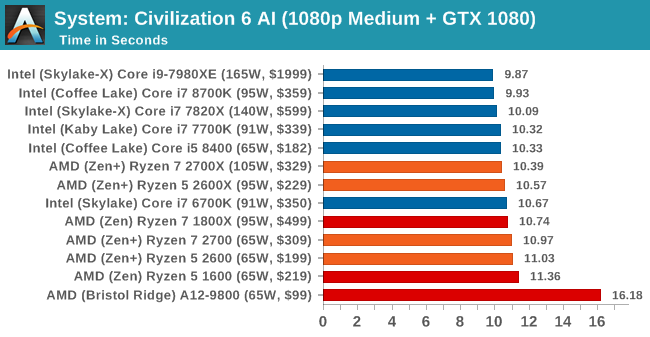
Parts of the AI test can use multiple threads, however the extra single core performance on Intel does push those parts into the lead.


545 Comments
View All Comments
jor5 - Thursday, April 26, 2018 - link
Pull this shambles and repost when you've corrected it fully.mapesdhs - Monday, May 14, 2018 - link
Not an argument. It is just as interesting to learn about how and why this issue occured, to understand the nature of benchmarking. Life isn't just about being spoonfed end nuggets of things, the process itself is relevant. Or would you rather we don't learn from history?peevee - Thursday, April 26, 2018 - link
When 65W i7 8700 is 15% faster in Octane 2.0 than 105W Rizen 7 2700x, it is just sad.Of course, the horrible x64 practically demands than compilers must optimize for a very specific CPU implementation (choosing and sorting instructions in the code accordingly), AMD could have at least realized the fact and optimize their own implementation for the same Intel-optimized code generators...
GreenReaper - Thursday, April 26, 2018 - link
Intel compilers and libraries tend not to use the ideal instructions unless they detect a GenuineIntel signature via CPUID - it'll likely use the default lowest-common-denominator pathway instead.TDP is more of a guideline - it doesn't determine actual power usage (we've seen Coffee Lake use way more than the TDP), let alone the power used in a particular operation. Having said that, I wouldn't be surprised if Intel were more efficient in this particular test. But it'd be interesting to know how much impact Meltdown patches have in that area; they might well increase the amount of time the CPU spends idle (but not idle enough to go into a sleep mode) as it waited to fetch instructions.
SaturnusDK - Thursday, April 26, 2018 - link
Compare power consumption to blender score. Ryzen is about 9% more power efficient.TDP is literally Thermal Design Power. It has nothing to do with power consumption.
peevee - Thursday, April 26, 2018 - link
"TDP is literally Thermal Design Power. It has nothing to do with power consumption."Unless you have invented a way to overcome energy conservation law, power consumed = power dissipated.
SaturnusDK - Friday, April 27, 2018 - link
It's a guideline for cooling solutions. Look at the power consumption numbers in this test for example.Ryzen 2700X power consumption under full load 110W.
Intel i7 8700K power consumption under full load 120W.
Both are at stock speeds with the Ryzen having 8 cores versus 6 cores, and scoring 2700X 24% higher Cinebench scores. Ryzen is rated at 105W TDP so actual power consumption at stock speed is pretty close. The 8700K uses 120W so it's pretty far from the 95W TDP it is rated at.
ijdat - Saturday, April 28, 2018 - link
The 8700 also uses 120W so it's even further from the 65W TDP it's rated at. In comparison Ryzen 2700 uses 45W when it has the same rated 65W TDP. I know which one I'd prefer to put into a quiet low-power system...mapesdhs - Monday, May 14, 2018 - link
Perhaps this is AMD's biggest win this time round, potent HTPC setups.peevee - Thursday, April 26, 2018 - link
"Intel compilers "What Intel compilers have to do with it?