The AMD 2nd Gen Ryzen Deep Dive: The 2700X, 2700, 2600X, and 2600 Tested
by Ian Cutress on April 19, 2018 9:00 AM ESTRise of the Tomb Raider
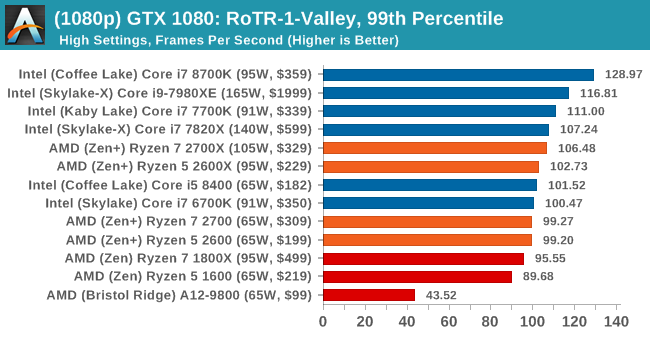
One of the newest games in the gaming benchmark suite is Rise of the Tomb Raider (RoTR), developed by Crystal Dynamics, and the sequel to the popular Tomb Raider which was loved for its automated benchmark mode. But don’t let that fool you: the benchmark mode in RoTR is very much different this time around.
Visually, the previous Tomb Raider pushed realism to the limits with features such as TressFX, and the new RoTR goes one stage further when it comes to graphics fidelity. This leads to an interesting set of requirements in hardware: some sections of the game are typically GPU limited, whereas others with a lot of long-range physics can be CPU limited, depending on how the driver can translate the DirectX 12 workload.
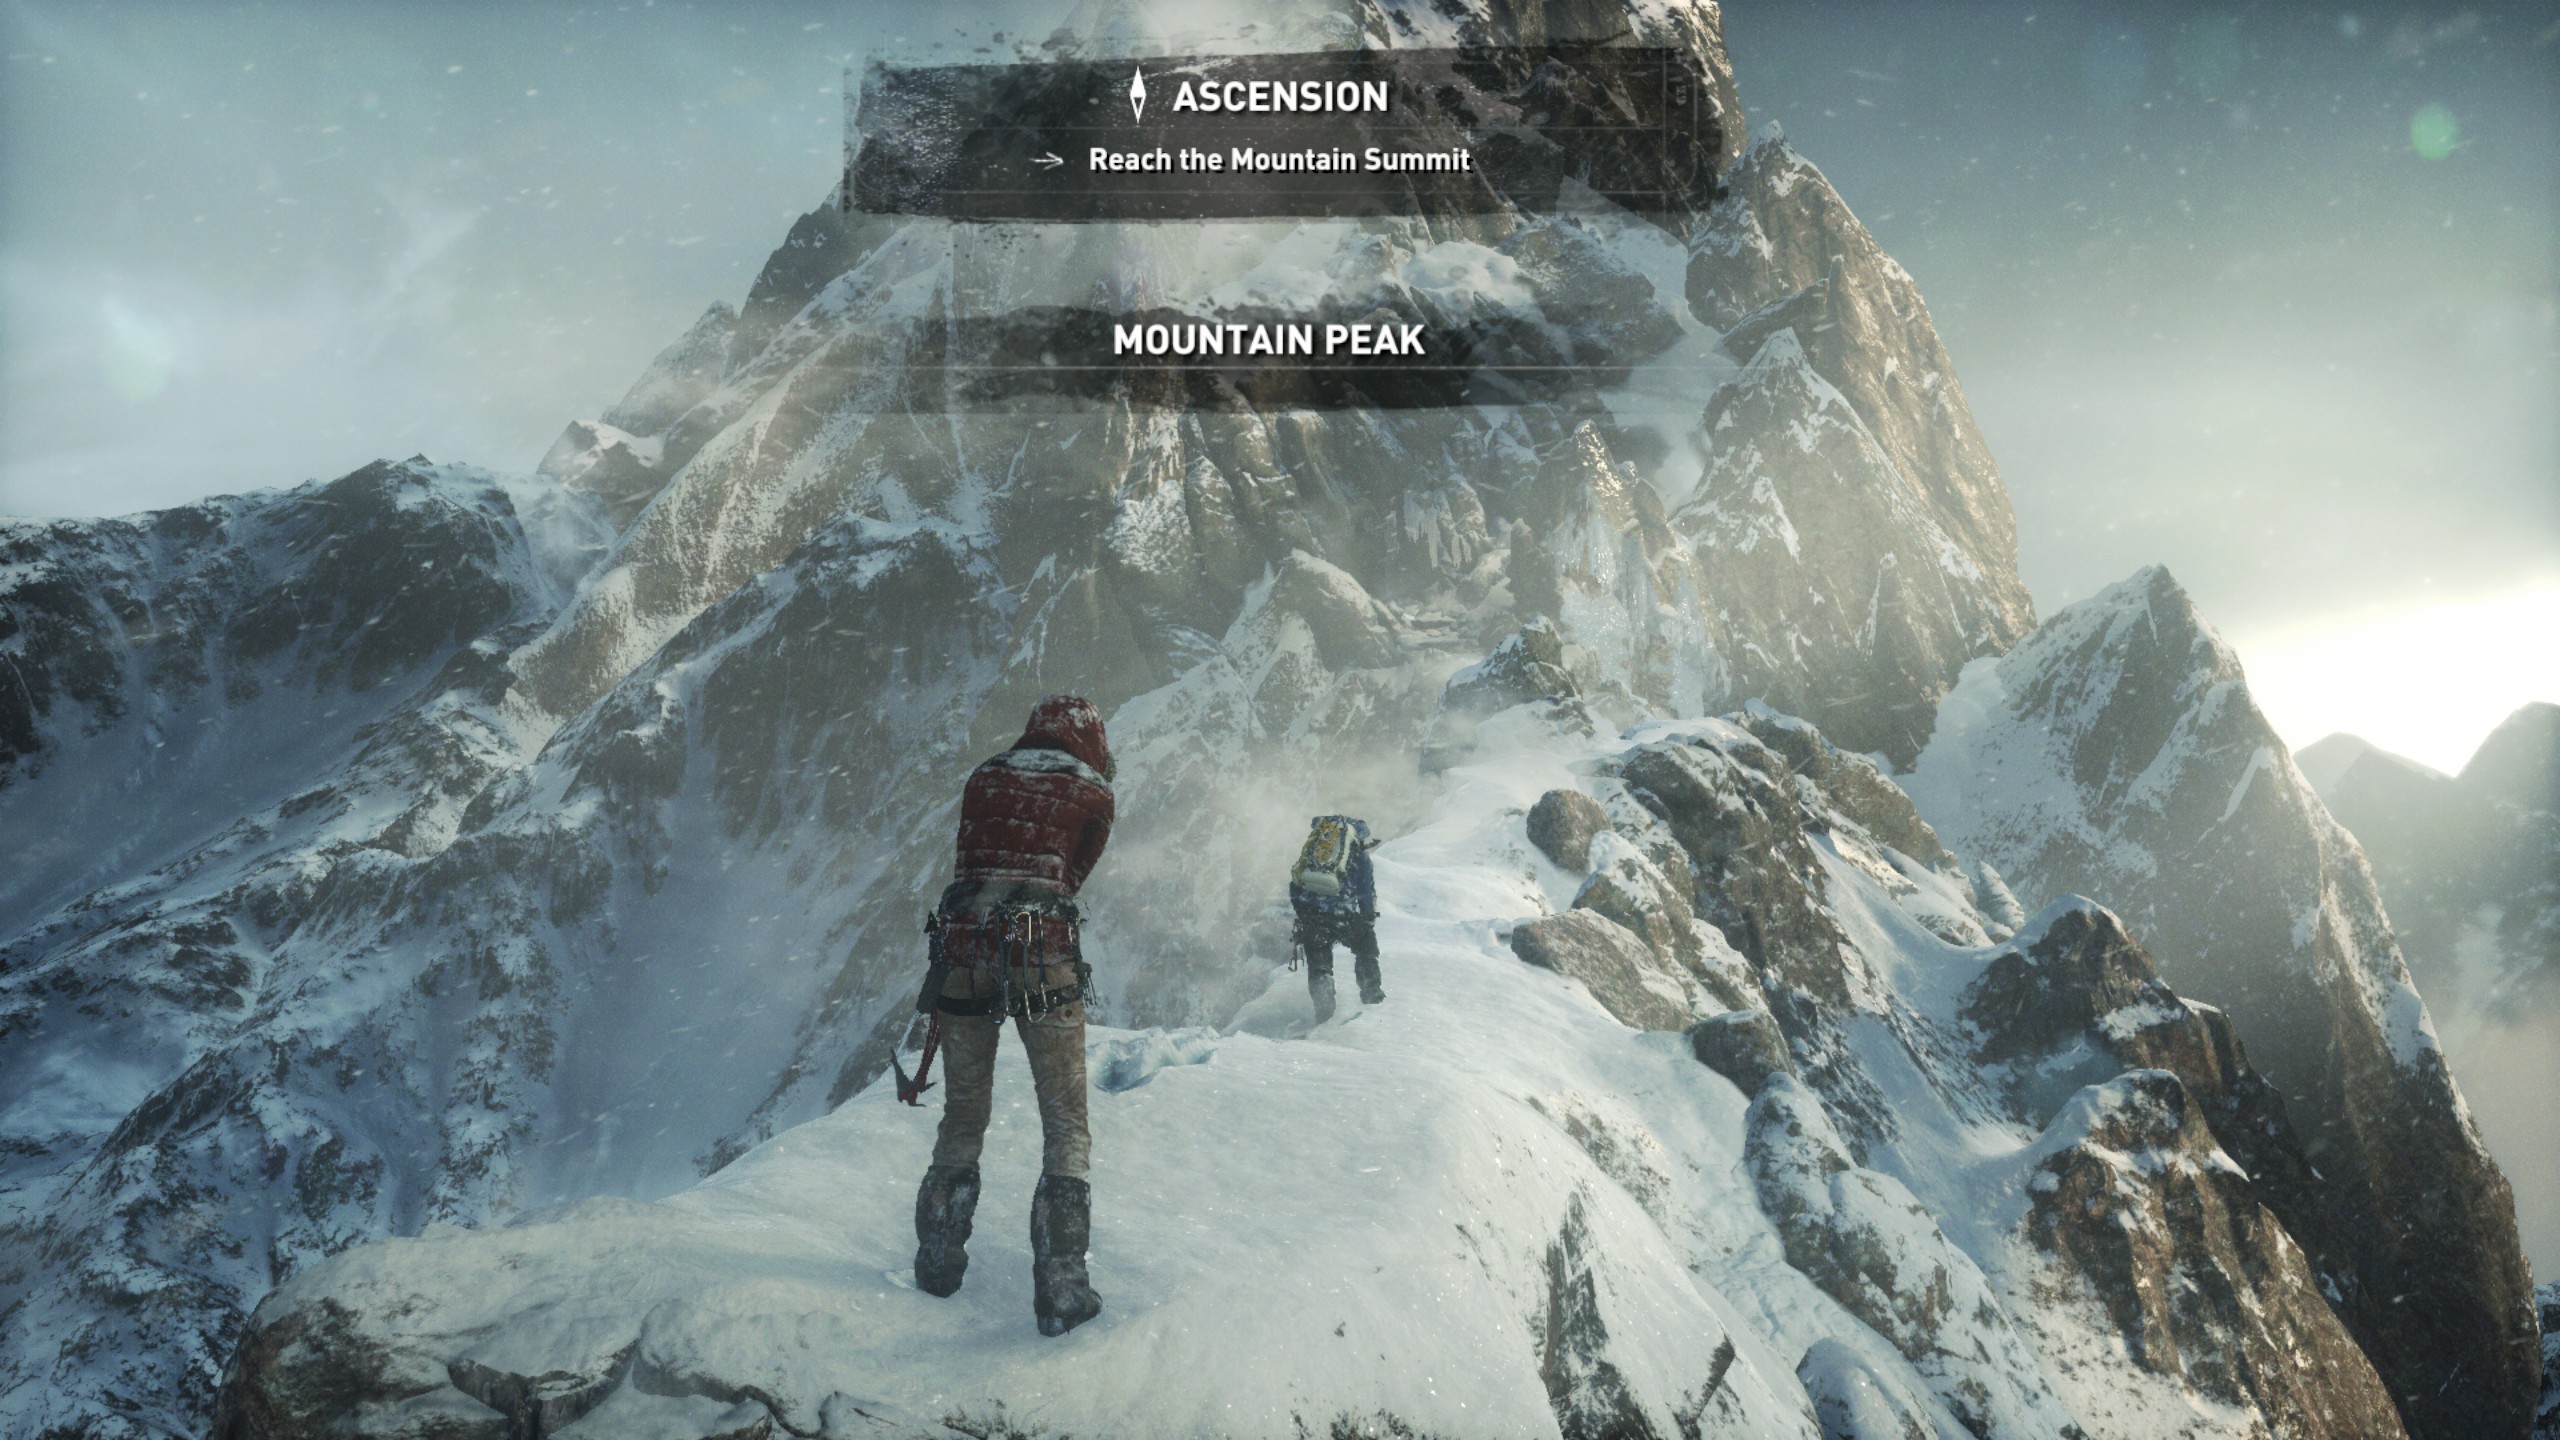
Where the old game had one benchmark scene, the new game has three different scenes with different requirements: Geothermal Valley (1-Valley), Prophet’s Tomb (2-Prophet) and Spine of the Mountain (3-Mountain) - and we test all three. These are three scenes designed to be taken from the game, but it has been noted that scenes like 2-Prophet shown in the benchmark can be the most CPU limited elements of that entire level, and the scene shown is only a small portion of that level. Because of this, we report the results for each scene on each graphics card separately.
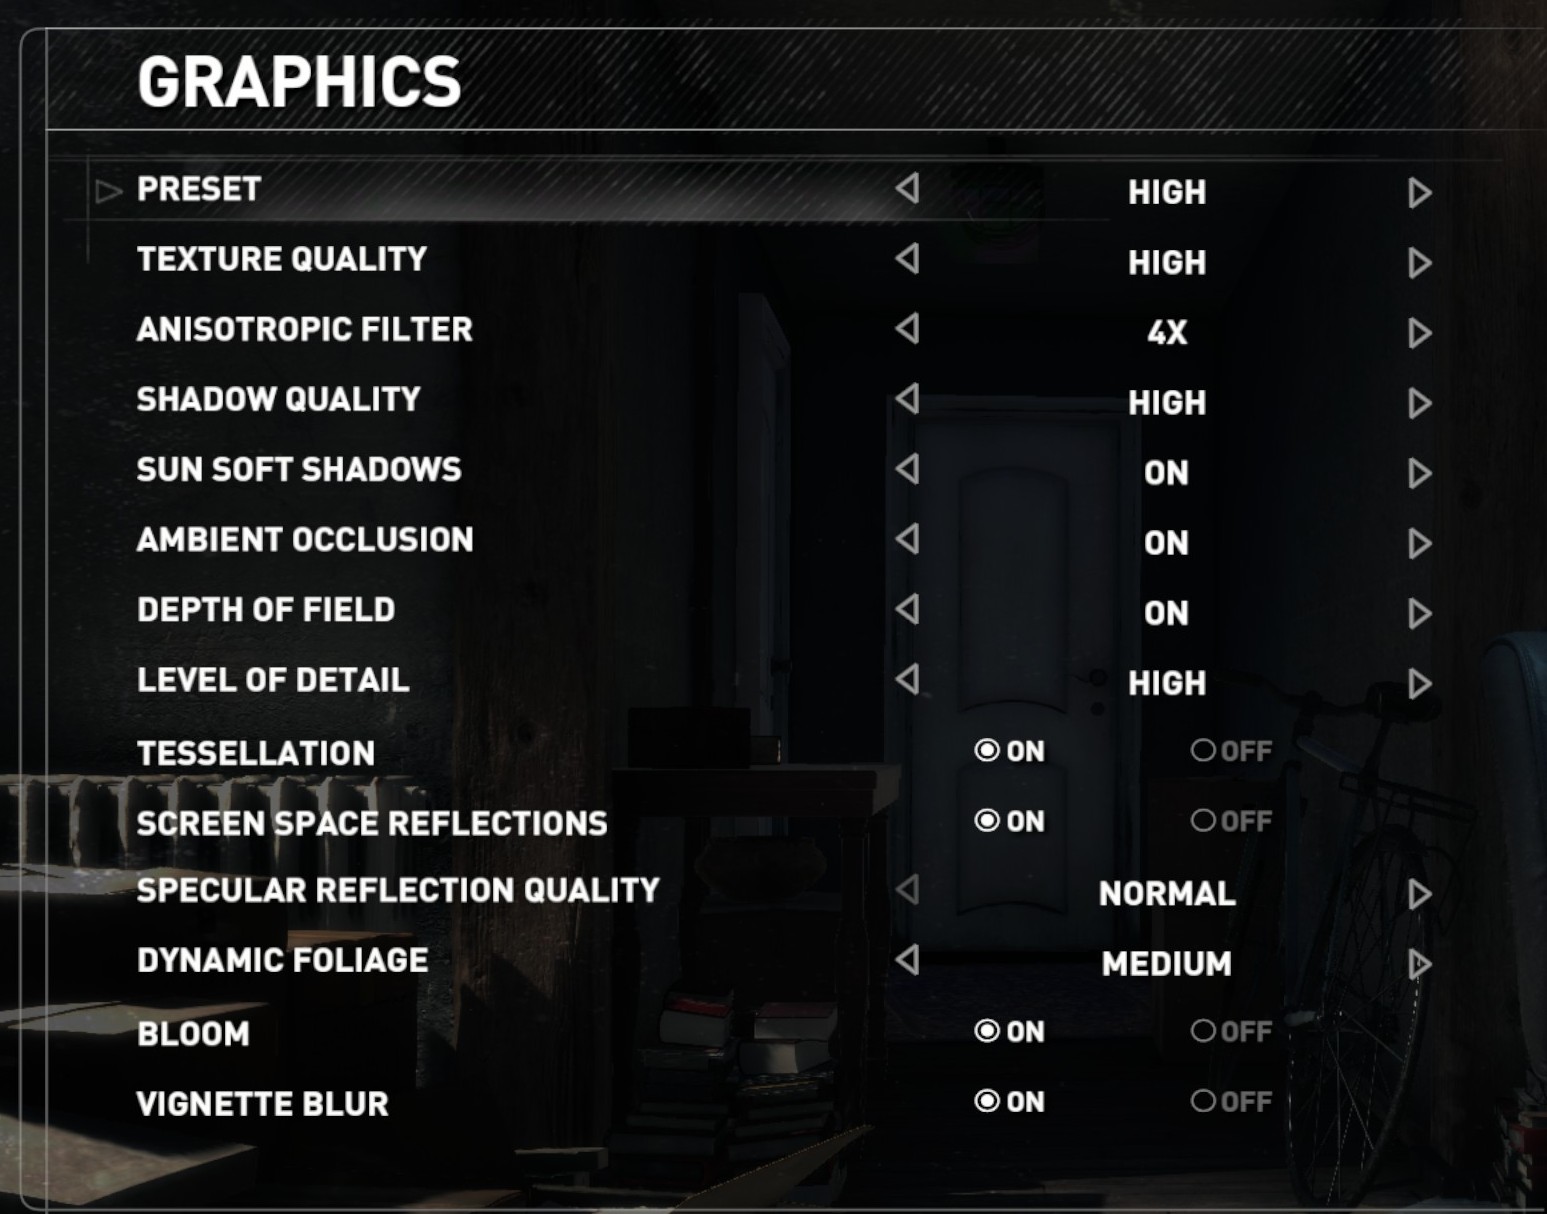
Graphics options for RoTR are similar to other games in this type, offering some presets or allowing the user to configure texture quality, anisotropic filter levels, shadow quality, soft shadows, occlusion, depth of field, tessellation, reflections, foliage, bloom, and features like PureHair which updates on TressFX in the previous game.
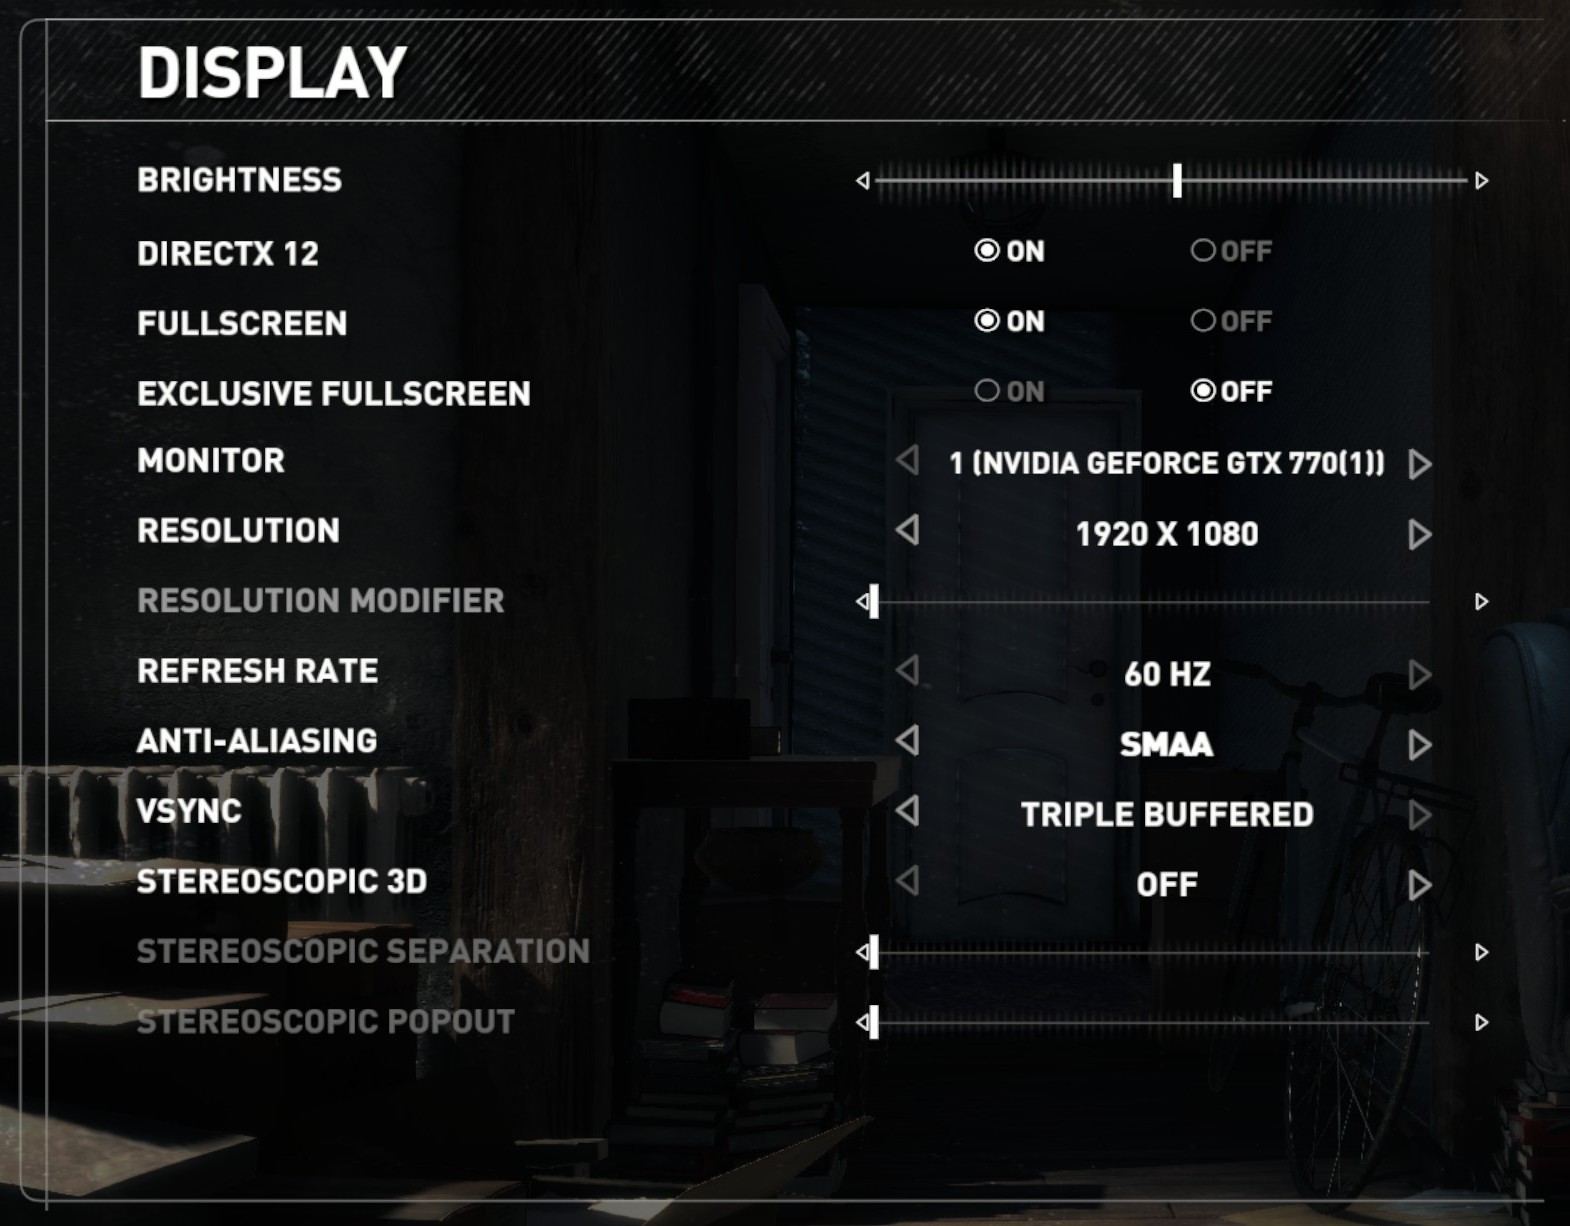
Again, we test at 1920x1080 and 4K using our native 4K displays. At 1080p we run the High preset, while at 4K we use the Medium preset which still takes a sizable hit in frame rate.
It is worth noting that RoTR is a little different to our other benchmarks in that it keeps its graphics settings in the registry rather than a standard ini file, and unlike the previous TR game the benchmark cannot be called from the command-line. Nonetheless we scripted around these issues to automate the benchmark four times and parse the results. From the frame time data, we report the averages, 99th percentiles, and our time under analysis.
All of our benchmark results can also be found in our benchmark engine, Bench.
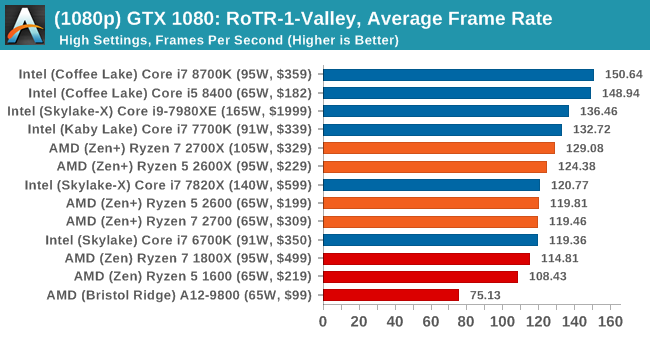
1080p

4K


545 Comments
View All Comments
jor5 - Thursday, April 26, 2018 - link
Pull this shambles and repost when you've corrected it fully.mapesdhs - Monday, May 14, 2018 - link
Not an argument. It is just as interesting to learn about how and why this issue occured, to understand the nature of benchmarking. Life isn't just about being spoonfed end nuggets of things, the process itself is relevant. Or would you rather we don't learn from history?peevee - Thursday, April 26, 2018 - link
When 65W i7 8700 is 15% faster in Octane 2.0 than 105W Rizen 7 2700x, it is just sad.Of course, the horrible x64 practically demands than compilers must optimize for a very specific CPU implementation (choosing and sorting instructions in the code accordingly), AMD could have at least realized the fact and optimize their own implementation for the same Intel-optimized code generators...
GreenReaper - Thursday, April 26, 2018 - link
Intel compilers and libraries tend not to use the ideal instructions unless they detect a GenuineIntel signature via CPUID - it'll likely use the default lowest-common-denominator pathway instead.TDP is more of a guideline - it doesn't determine actual power usage (we've seen Coffee Lake use way more than the TDP), let alone the power used in a particular operation. Having said that, I wouldn't be surprised if Intel were more efficient in this particular test. But it'd be interesting to know how much impact Meltdown patches have in that area; they might well increase the amount of time the CPU spends idle (but not idle enough to go into a sleep mode) as it waited to fetch instructions.
SaturnusDK - Thursday, April 26, 2018 - link
Compare power consumption to blender score. Ryzen is about 9% more power efficient.TDP is literally Thermal Design Power. It has nothing to do with power consumption.
peevee - Thursday, April 26, 2018 - link
"TDP is literally Thermal Design Power. It has nothing to do with power consumption."Unless you have invented a way to overcome energy conservation law, power consumed = power dissipated.
SaturnusDK - Friday, April 27, 2018 - link
It's a guideline for cooling solutions. Look at the power consumption numbers in this test for example.Ryzen 2700X power consumption under full load 110W.
Intel i7 8700K power consumption under full load 120W.
Both are at stock speeds with the Ryzen having 8 cores versus 6 cores, and scoring 2700X 24% higher Cinebench scores. Ryzen is rated at 105W TDP so actual power consumption at stock speed is pretty close. The 8700K uses 120W so it's pretty far from the 95W TDP it is rated at.
ijdat - Saturday, April 28, 2018 - link
The 8700 also uses 120W so it's even further from the 65W TDP it's rated at. In comparison Ryzen 2700 uses 45W when it has the same rated 65W TDP. I know which one I'd prefer to put into a quiet low-power system...mapesdhs - Monday, May 14, 2018 - link
Perhaps this is AMD's biggest win this time round, potent HTPC setups.peevee - Thursday, April 26, 2018 - link
"Intel compilers "What Intel compilers have to do with it?