The AMD 2nd Gen Ryzen Deep Dive: The 2700X, 2700, 2600X, and 2600 Tested
by Ian Cutress on April 19, 2018 9:00 AM ESTCPU Legacy Tests
Our legacy tests represent benchmarks that were once at the height of their time. Some of these are industry standard synthetics, and we have data going back over 10 years. All of the data here has been rerun on Windows 10, and we plan to go back several generations of components to see how performance has evolved.
All of our benchmark results can also be found in our benchmark engine, Bench.
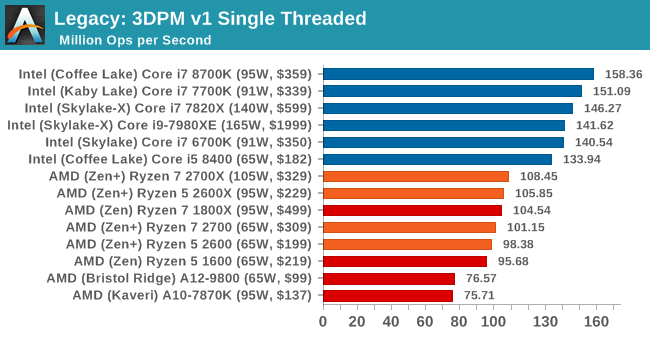
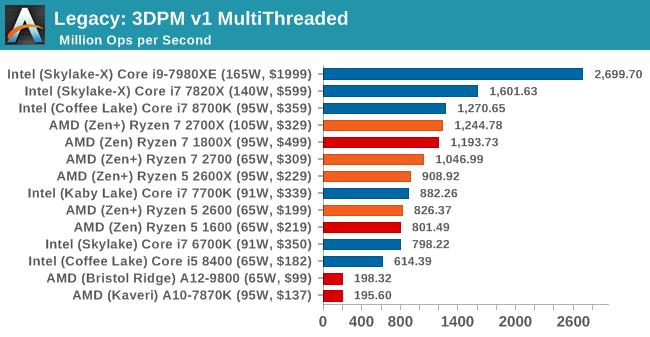
3D Particle Movement v1
3DPM is a self-penned benchmark, taking basic 3D movement algorithms used in Brownian Motion simulations and testing them for speed. High floating point performance, MHz and IPC wins in the single thread version, whereas the multithread version has to handle the threads and loves more cores. This is the original version, written in the style of a typical non-computer science student coding up an algorithm for their theoretical problem, and comes without any non-obvious optimizations not already performed by the compiler, such as false sharing.
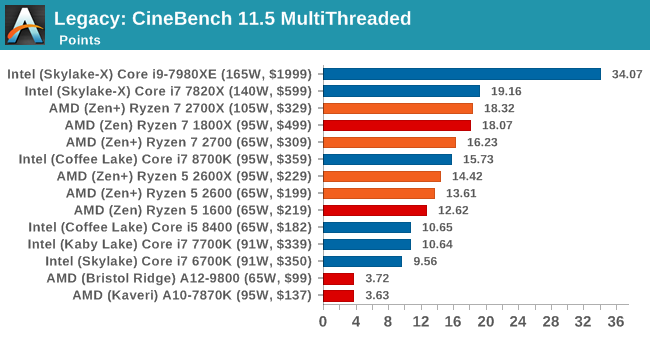
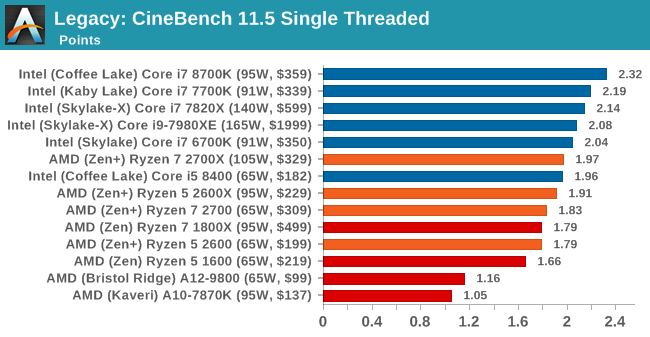
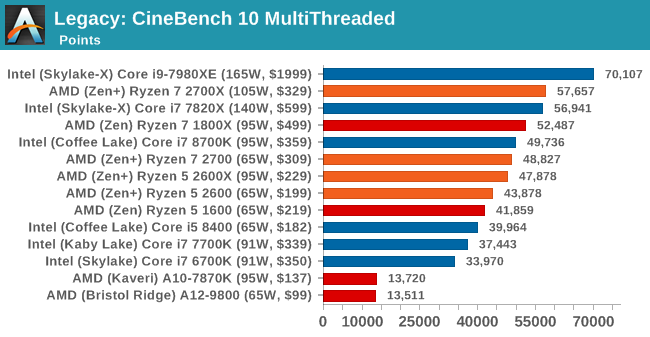
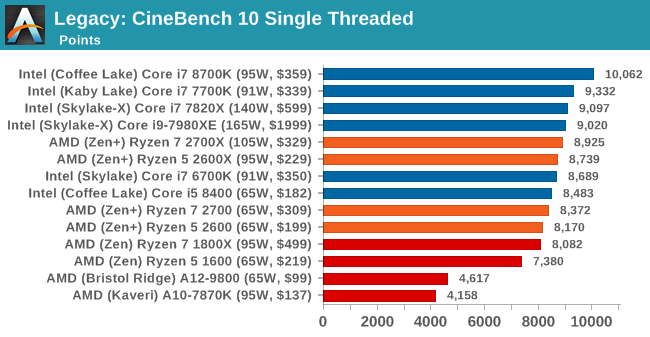
CineBench 11.5 and 10
Cinebench is a widely known benchmarking tool for measuring performance relative to MAXON's animation software Cinema 4D. Cinebench has been optimized over a decade and focuses on purely CPU horsepower, meaning if there is a discrepancy in pure throughput characteristics, Cinebench is likely to show that discrepancy. Arguably other software doesn't make use of all the tools available, so the real world relevance might purely be academic, but given our large database of data for Cinebench it seems difficult to ignore a small five minute test. We run the modern version 15 in this test, as well as the older 11.5 and 10 due to our back data.
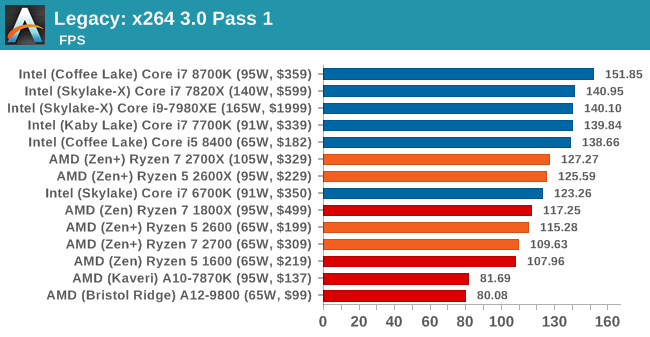
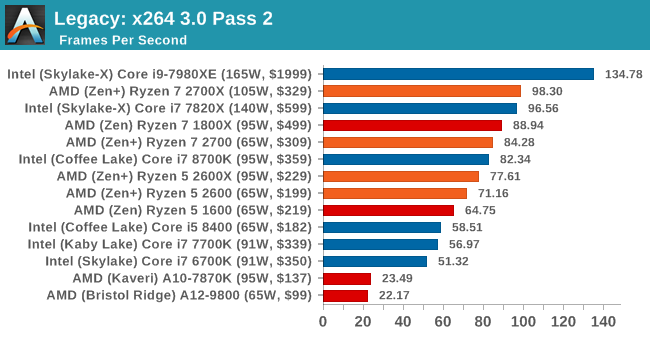
x264 HD 3.0
Similarly, the x264 HD 3.0 package we use here is also kept for historic regressional data. The latest version is 5.0.1, and encodes a 1080p video clip into a high quality x264 file. Version 3.0 only performs the same test on a 720p file, and in most circumstances the software performance hits its limit on high end processors, but still works well for mainstream and low-end. Also, this version only takes a few minutes, whereas the latest can take over 90 minutes to run.


545 Comments
View All Comments
jor5 - Thursday, April 26, 2018 - link
Pull this shambles and repost when you've corrected it fully.mapesdhs - Monday, May 14, 2018 - link
Not an argument. It is just as interesting to learn about how and why this issue occured, to understand the nature of benchmarking. Life isn't just about being spoonfed end nuggets of things, the process itself is relevant. Or would you rather we don't learn from history?peevee - Thursday, April 26, 2018 - link
When 65W i7 8700 is 15% faster in Octane 2.0 than 105W Rizen 7 2700x, it is just sad.Of course, the horrible x64 practically demands than compilers must optimize for a very specific CPU implementation (choosing and sorting instructions in the code accordingly), AMD could have at least realized the fact and optimize their own implementation for the same Intel-optimized code generators...
GreenReaper - Thursday, April 26, 2018 - link
Intel compilers and libraries tend not to use the ideal instructions unless they detect a GenuineIntel signature via CPUID - it'll likely use the default lowest-common-denominator pathway instead.TDP is more of a guideline - it doesn't determine actual power usage (we've seen Coffee Lake use way more than the TDP), let alone the power used in a particular operation. Having said that, I wouldn't be surprised if Intel were more efficient in this particular test. But it'd be interesting to know how much impact Meltdown patches have in that area; they might well increase the amount of time the CPU spends idle (but not idle enough to go into a sleep mode) as it waited to fetch instructions.
SaturnusDK - Thursday, April 26, 2018 - link
Compare power consumption to blender score. Ryzen is about 9% more power efficient.TDP is literally Thermal Design Power. It has nothing to do with power consumption.
peevee - Thursday, April 26, 2018 - link
"TDP is literally Thermal Design Power. It has nothing to do with power consumption."Unless you have invented a way to overcome energy conservation law, power consumed = power dissipated.
SaturnusDK - Friday, April 27, 2018 - link
It's a guideline for cooling solutions. Look at the power consumption numbers in this test for example.Ryzen 2700X power consumption under full load 110W.
Intel i7 8700K power consumption under full load 120W.
Both are at stock speeds with the Ryzen having 8 cores versus 6 cores, and scoring 2700X 24% higher Cinebench scores. Ryzen is rated at 105W TDP so actual power consumption at stock speed is pretty close. The 8700K uses 120W so it's pretty far from the 95W TDP it is rated at.
ijdat - Saturday, April 28, 2018 - link
The 8700 also uses 120W so it's even further from the 65W TDP it's rated at. In comparison Ryzen 2700 uses 45W when it has the same rated 65W TDP. I know which one I'd prefer to put into a quiet low-power system...mapesdhs - Monday, May 14, 2018 - link
Perhaps this is AMD's biggest win this time round, potent HTPC setups.peevee - Thursday, April 26, 2018 - link
"Intel compilers "What Intel compilers have to do with it?