The AMD 2nd Gen Ryzen Deep Dive: The 2700X, 2700, 2600X, and 2600 Tested
by Ian Cutress on April 19, 2018 9:00 AM EST
With 2017 finished, and Ryzen being very successful for AMD, the inevitable question was due: what happens next? Early in 2018, the plans were laid bare: a second generation Ryzen processor was set to come in mid-year, followed by a second generation Threadripper, using GlobalFoundries’ 12nm process. This is not AMD’s next big microarchitecture, which we know is called Zen 2 on 7nm, but an opportunity to launch a wave of components with minor improvements and take advantage of a manufacturing process that gives more frequency and more performance. Today AMD is launching four CPUs, and we have tested them all.
Updates
- (4/21) Some of our results, initially thought due to Spectre/Meltdown patches, were not in line with others. Testing audit was started.
- (4/25) Our extensive internal audit showed reasons for the differences, as documented in detail in this follow-up article. In short, an issue with a non-standard use timers on Windows was causing the performance of both AMD and Intel processors to dip, particularly impacting the latter.
- (5/2) Benchmark results have been updated.
- (5/22) X470 Motherboard. StoreMI, and Power Analysis pages updated.
- (5/26) Conclusion Updated, Performance Per Dollar graphs added.
Straight To The Scene: The New CPUs
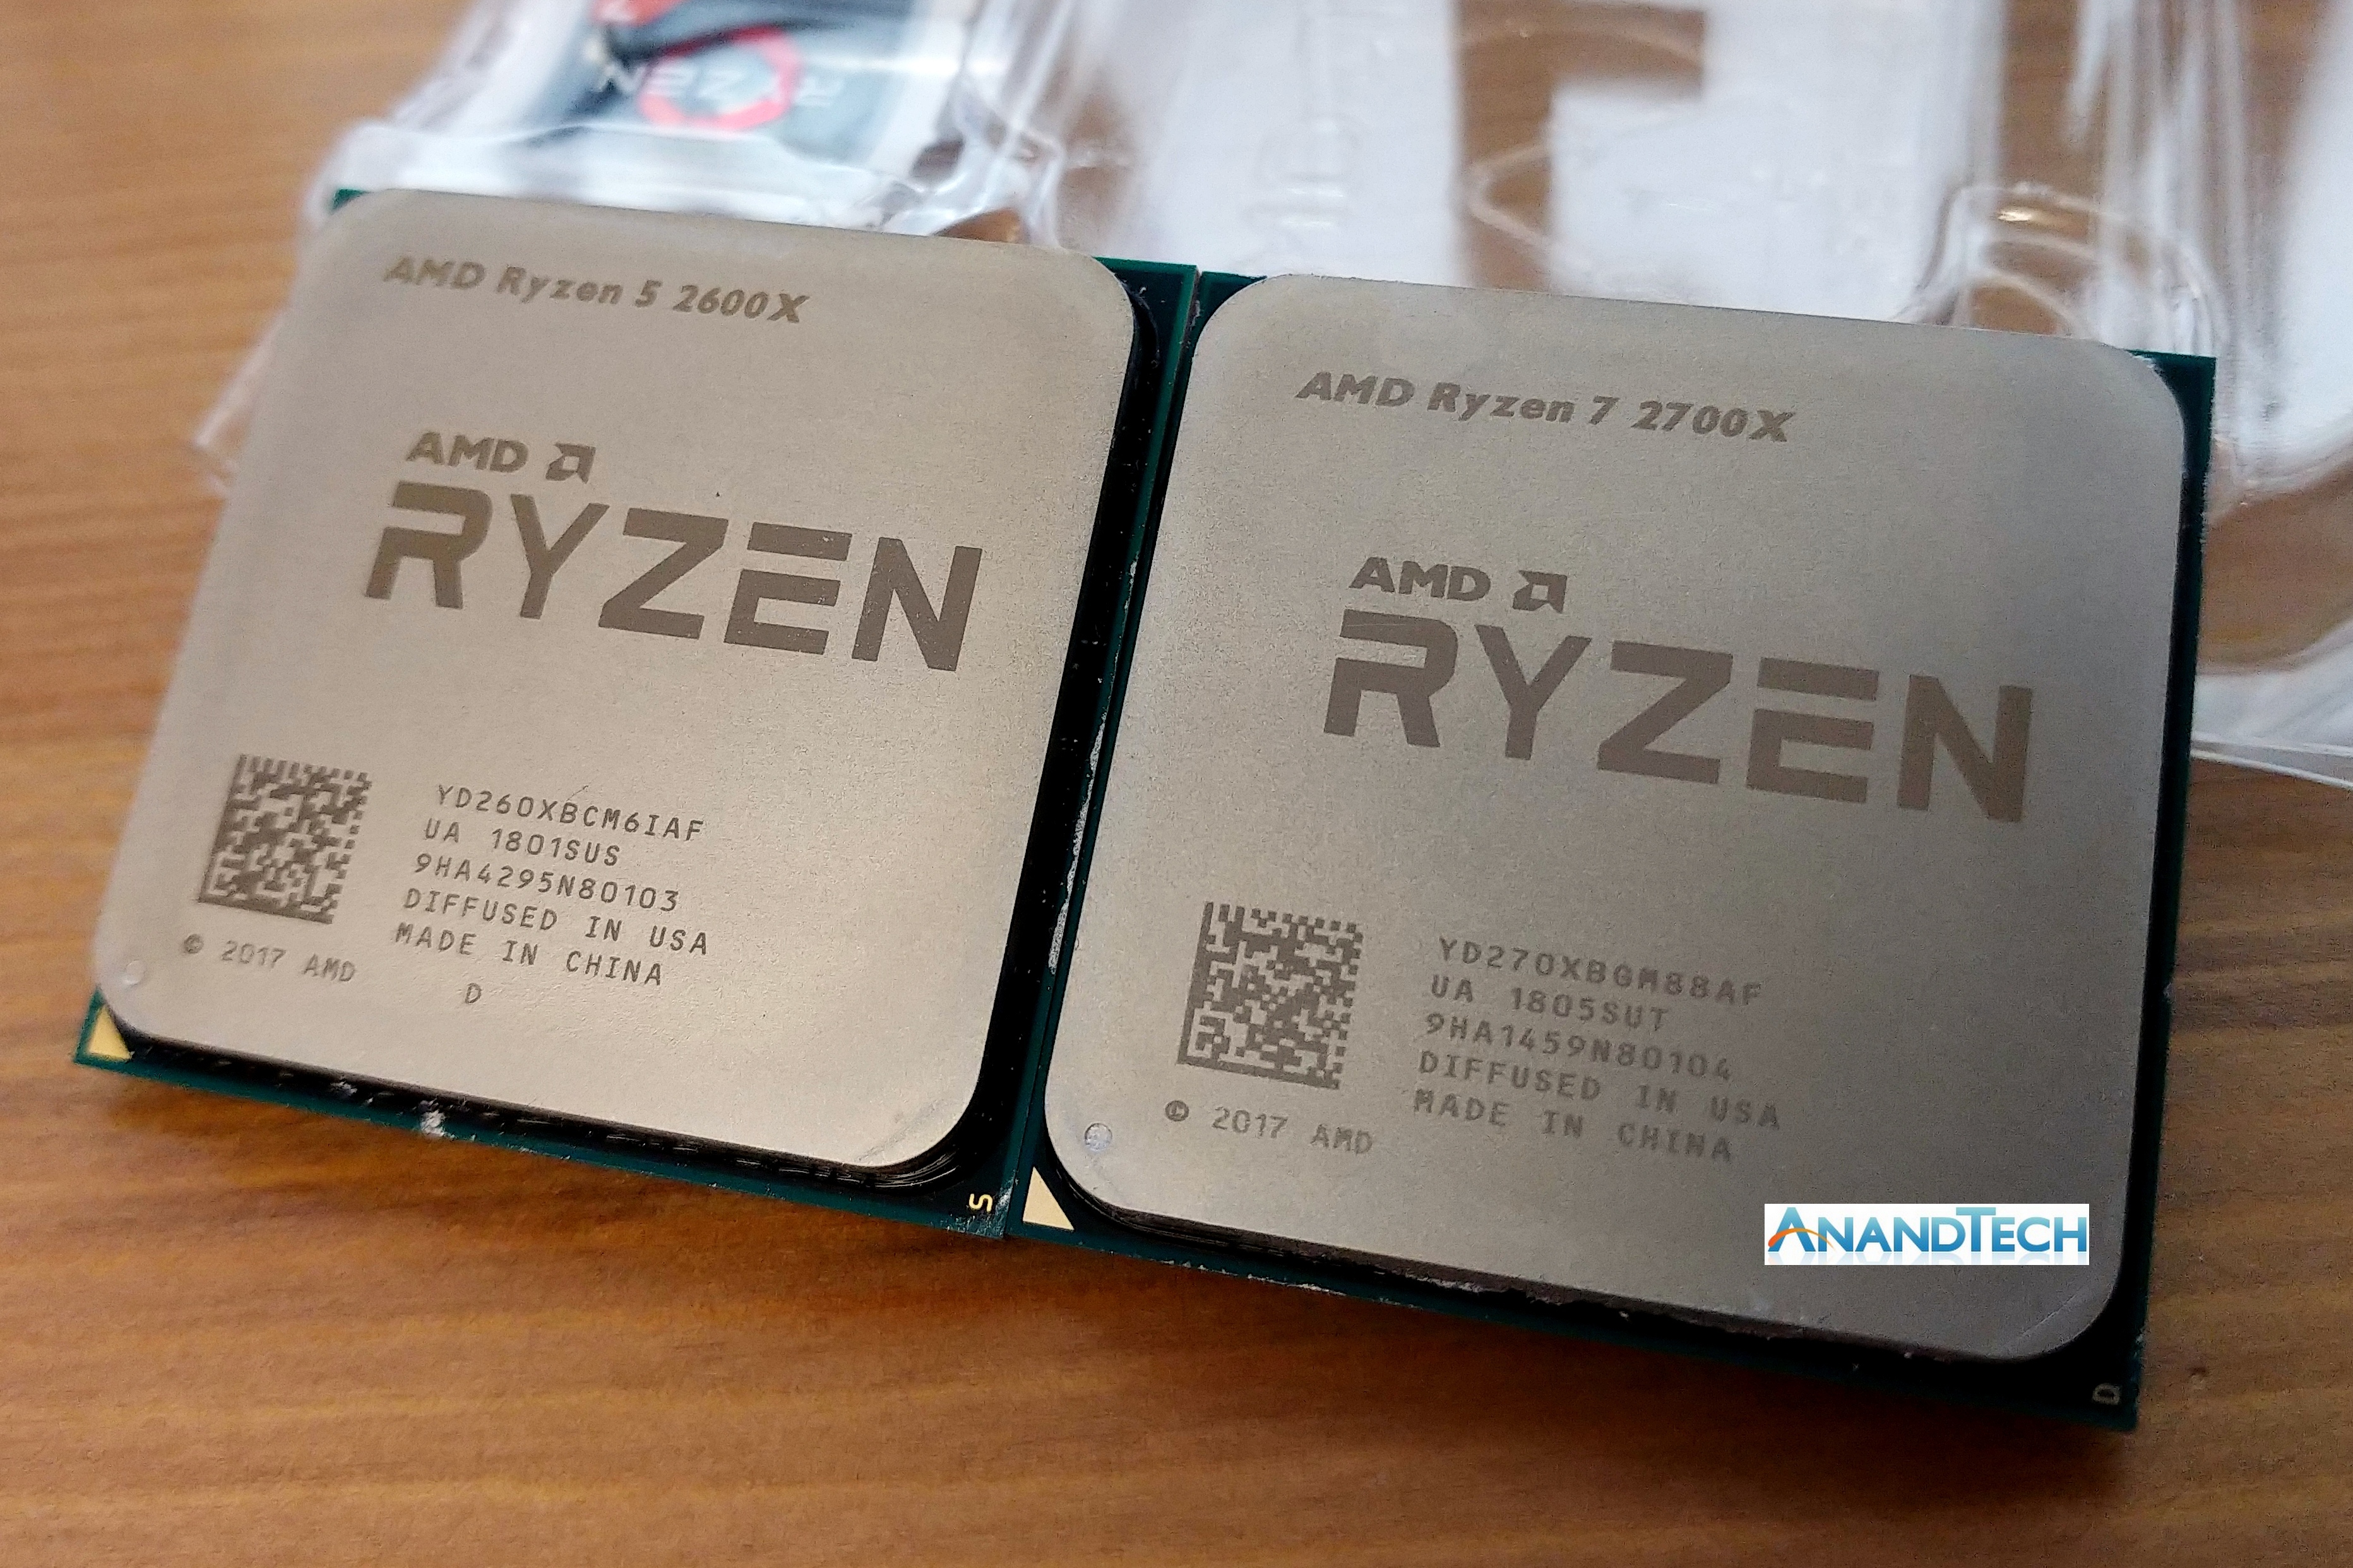
For readers that only want one piece of information, this is it: AMD is launching the Ryzen 7 2700X, the Ryzen 7 2700, the Ryzen 5 2600X, and the Ryzen 5 2600.
| AMD Ryzen 2000-Series CPUss | ||||
| Ryzen 7 2700X | Ryzen 7 2700 | Ryzen 5 2600X | Ryzen 5 2600 | |
| CPU Cores/Threads | 8 / 16 | 8 / 16 | 6 / 12 | 6 / 12 |
| Base CPU Frequency | 3.7 GHz | 3.2 GHz | 3.6 GHz | 3.4 GHz |
| Turbo CPU Frequency | 4.3 GHz | 4.1 GHz | 4.2 GHz | 3.9 GHz |
| TDP @ Base Frequency | 105 W | 65 W | 95 W | 65 W |
| L1 Cache | I: 64K. D: 32K | I: 64K. D: 32K | I: 64K. D: 32K | I: 64K. D: 32K |
| L2 Cache | 512 KB/core | 512 KB/core | 512 KB/core | 512 KB/core |
| L3 Cache | 16 MB | 16 MB | 16 MB | 16 MB |
| DRAM Support | DDR4-2933 Dual Channel |
DDR4-2933 Dual Channel |
DDR4-2933 Dual Channel |
DDR4-2933 Dual Channel |
| PCIe Lanes (CPU) | 16 Free + 4 NVMe | 16 Free + 4 NVMe | 16 Free + 4 NVMe | 16 Free + 4 NVMe |
| Price | $329 | $299 | $229 | $199 |
| Bundled Cooler | AMD Prism RGB | AMD Spire RGB | AMD Spire | AMD Stealth |
The Ryzen 7 2700X takes over the top spot from the Ryzen 7 1800X, and for an extra 10 W in TDP will provide a base frequency of 3.7 GHz and a turbo frequency of 4.3 GHz on its eight cores, with simultaneous multi-threading. This is an extra +100 MHz and +300 MHz respectively, going above the average limits of the 1800X when overclocked.
The 2700X also reduces the top cost for the best AM4 Ryzen processor: when launched, the 1800X was set at $499, without a bundled cooler, and was recently dropped to $349 as a price-competitor to Intel’s most powerful mainstream processor. The 2700X undercuts both, by being listed at a suggested e-tail price of $329, and is bundled with the best stock cooler in the business: AMD’s Wraith Prism RGB. AMD is attempting to hit all the targets: aggressive pricing, top performance, and best value, all in one go.
The Ryzen 5 2600X is the six-core option, also with an aggressive frequency strategy: 3.6 GHz base and 4.2 GHz turbo. At a 95W TDP and a suggested retail price of $229, it comes bundled with AMD’s Wraith Spire cooler, which again is an impressive stock cooler.
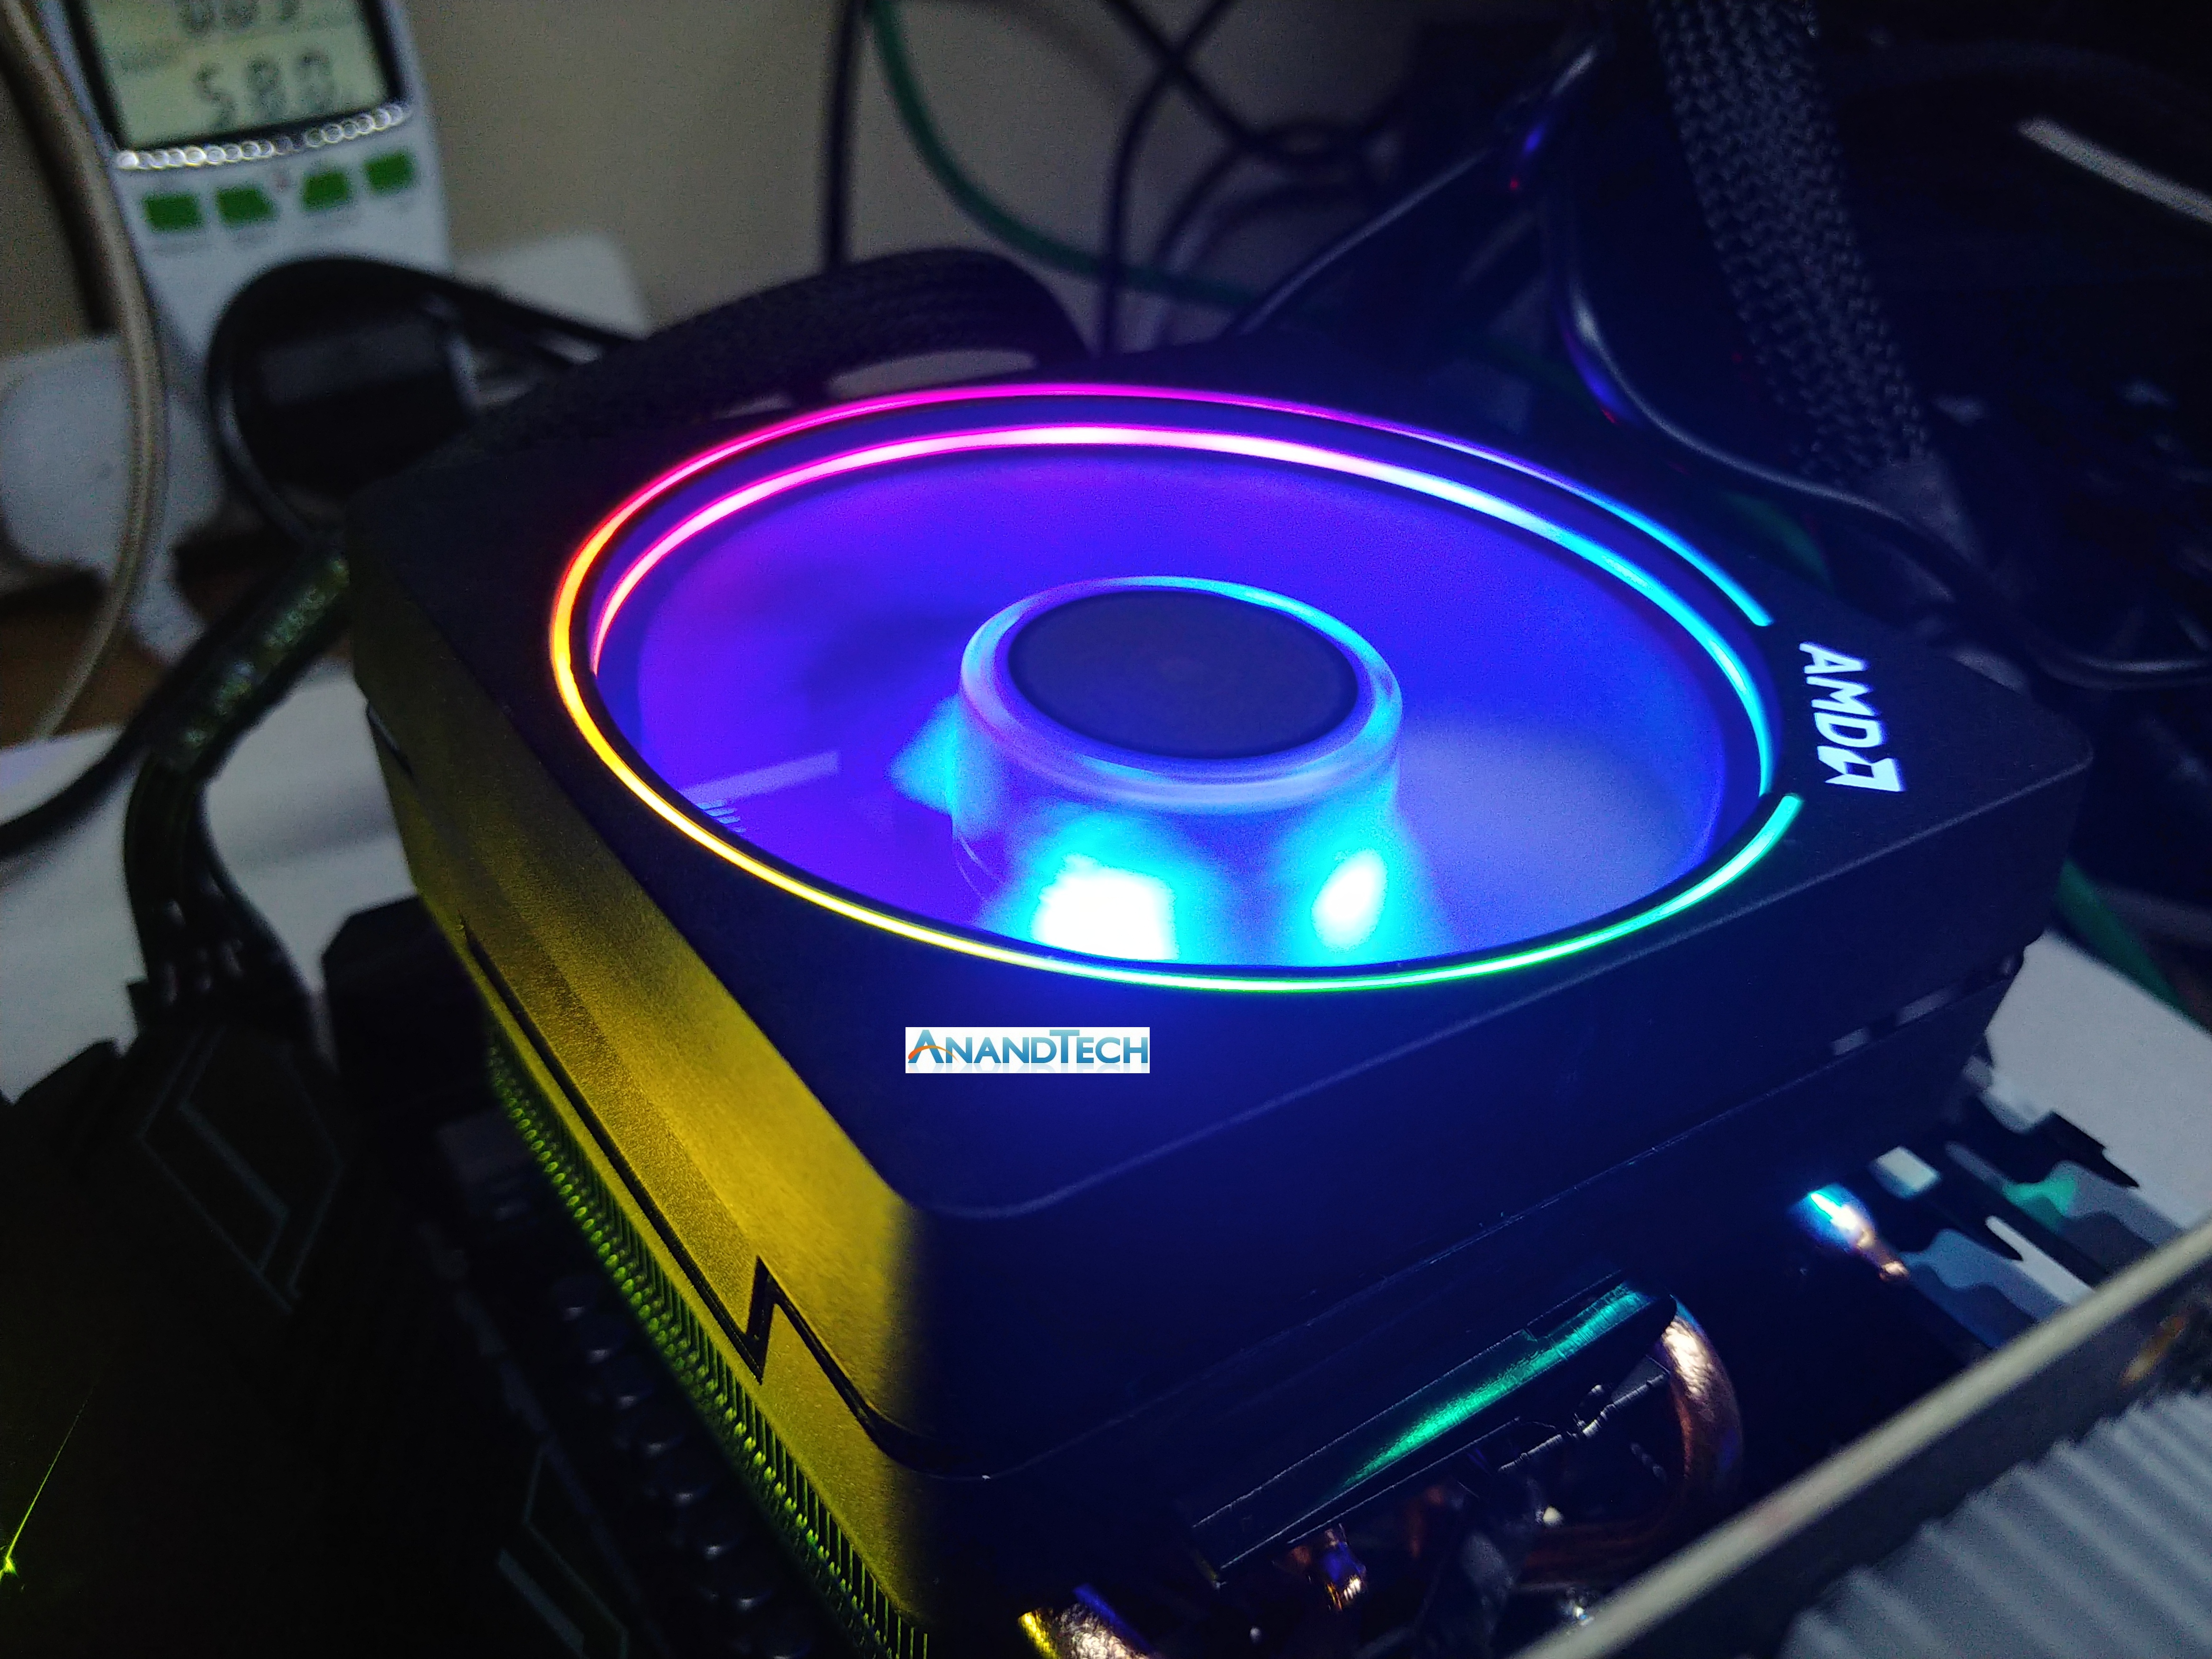
The Ryzen 7 2700 and Ryzen 5 2600 are the 65W versions of the X counterparts, offering near-similar frequencies for $30 less. All the CPUs will support dual-channel DDR4-2933 memory, up from the DDR4-2666 memory support of the 2017 Ryzen processors. One of the big changes is that now every processor comes with a bundled stock cooler, ranging from the Silent 65W Stealth models up to the big Prism RGB, all of which are easily sufficient for good turbo performance.
AMD’s intended AM4 Ryzen product line is now going to look like this:
| AMD Ryzen Product Stacks & Launch Prices | |||
| Ryzen 1000 (2017) | Ryzen 2000 (2018) | ||
| Ryzen 7 1800X | $499 | Ryzen 7 2700X | $329 |
| Ryzen 7 1700X | $399 | ||
| Ryzen 7 1700 | $329 | Ryzen 7 2700 | $299 |
| Ryzen 5 1600X | $249 | Ryzen 5 2600X | $229 |
| Ryzen 5 1600 | $219 | Ryzen 5 2600 | $199 |
| Ryzen 5 1500X | $189 | Ryzen 5 1500X | $159 |
| Ryzen 5 1400 | $169 | Ryzen 5 2400G | $169 |
| Ryzen 3 1300X | $129 | Ryzen 3 1300X | $114 |
| Ryzen 3 1200 | $109 | Ryzen 3 2200G | $99 |
At the top, the 2700X takes over from both the 1700X and 1800X. Rather than having three Ryzen 7 CPUs in the market for this generation, AMD examined its product line and opted on two, perhaps based on sales figures. As seen in this review, the 2700X is already pushing the silicon process to the limit, so there is not much headroom to go above this product for a new model in the future.
The full list ends up being a mix of Ryzen 2000-series CPUs (the new ones), Ryzen 2000-series APUs, and a pair of Ryzen 1000-series. We already examined the APUs in great detail in the past few weeks, showing that they directly replaced some of the original first-generation parts very easily. So far the four new 2000-series will sit at the top of the pile, however AMD’s strategy is often to drip feed its new parts, so we might see some more 2000-series as time goes on.
The Other Information From Today’s Launch
No launch is complete without talking about the features. AMD is using GlobalFoundries’ 12nm manufacturing process which has obvious on-paper benefits, however there are a number of internal firmware adjustments to touch upon, updated features and roles for AMD’s Precision Boost and XFR technologies that can have direct impacts on performance, a new chipset (along with 30+ motherboards) to run alongside the current offerings, and also new/renamed features such StoreMI. We also want to examine how these new products fit into AMD’s longer term plans and whether they are on track.
We’ll cover these in the next few pages, as well as the results from our testing.
- Talking 12nm: GlobalFoundries and Extra Performance
- Improvements to the Cache Hierarchy: +3% IPC and +10% Overall
- Precision Boost 2: Getting More Hertz Across The Board
- XFR2: A Dynamic Response to Cooling
- New X470 Chipset and Motherboards: A Focus on Power
- StoreMI: The Way To A Faster JBOD
- Power Analysis
- Our CPU Benchmarking Results
- Our Gaming CPU Benchmarking Results
- Conclusions
AMD’s Ryzen 2000 Competition: Intel’s Coffee Lake
As part of today’s launch, AMD went into extensive benchmarking detail about its new chips. It was abundantly clear from the data provided that these new processors are aimed squarely at Intel’s most recent mainstream processors: Coffee Lake. This is in contrast to when the Ryzen 1000-series was launched last year, when the octo-core Ryzen 7 1800X was compared against an 8-core Broadwell-E: in the interim Intel has updated its mainstream processor line to six-cores with high frequencies.
As a result, AMD is suggesting to compare the Ryzen 7 2700X against the Core i7-8700K and the Ryzen 5 2600X against the Core i5-8500K. This is significant – now both of the main x86 players in the processor market are keen to pit their most recent products against each other in a head to head battle. This hasn’t really happened like this for a number of generations. However, certain metrics will still run true as to the launch last year:
- Intel is expected to have a frequency and IPC advantage
- AMD’s counter is to come close on frequency and offer more cores at the same price
It is easy for AMD to wave the multi-threaded crown with its internal testing, however the single thread performance is still a little behind. A number of the new features with the Ryzen 2000-series are designed to help this: slightly higher IPC, higher frequencies, a higher TDP, and a better dynamic frequency boost model. We will cover these over the next few pages.
| Comparison: Ryzen 7 2700X vs Core i7-8700K | ||
| AMD Ryzen 7 2700X |
Features | Intel Core i7-8700K |
| 8 / 16 | Cores/Threads | 6 / 12 |
| 3.7 / 4.3 GHz | Base/Turbo | 3.7 / 4.7 |
| 16 (Free) + 4 (NVMe) | PCIe 3.0 Lanes | 16 (Free) |
| 512 KB/core | L2 Cache | 256 KB/core |
| 16 MB | L3 Cache | 12 MB |
| 105 W | TDP | 95 W |
| $329 | Price (List) | $349 |
Frequencies and core counts are one part of the equation, though the way that AMD and Intel have different cache models will also play a significant part. One of the things we will see in this analysis is the comparative cache metrics, as well as the tuning AMD has done to close the gap. For pricing, AMD has put the Ryzen 7 2700X below the i7-8700K, as well as bundling the Wraith Prism RGB stock cooler which easily replaces any $30-40 cooler, saving the user some money.
| Comparison: Ryzen 5 2600X vs Core i5-8600K | ||
| AMD Ryzen 5 2600X |
Features | Intel Core i5-8600K |
| 6 / 12 | Cores/Threads | 6 / 6 |
| 3.6 / 4.2 GHz | Base/Turbo | 3.6 / 4.3 |
| 16 (Free) + 4 (NVMe) | PCIe 3.0 Lanes | 16 (Free) |
| 512 KB/core | L2 Cache | 256 KB/core |
| 16 MB | L3 Cache | 9 MB |
| 95 W | TDP | 95 W |
| $229 | Price (List) | $239 |
The Ryzen 5 2600X comparison with the Core i5-8600K is much closer than the higher-end parts. These components share core counts, although the Ryzen 5 has double the threads. For any multithreaded workload that can take advantage of simultaneous multithreading is likely to pull ahead. The Core i5-8600K is slightly ahead in core frequency, and is expected to have an IPC advantage as well. Again, AMD bundles the CPU with a good stock cooler, whereas Intel’s offering is poor-to-nil.
Overall, AMD is claiming that its high-end processors will come in within 1-2% of the competition at 1440p gaming, but give +20% in ‘creative performance’. We’ve got a few ways to test this.


545 Comments
View All Comments
Flying Aardvark - Monday, April 23, 2018 - link
There's usually a lag from 6-12 months on any change that's already in place. Any topic really. Humans aren't very good at seeing what's in front of them. It requires enough people repeating it over and over around them, until they accept reality.Before that reassurance from society around them, they don't have the confidence to see/admit reality. Just something I've noticed. :)
mapesdhs - Monday, May 14, 2018 - link
That's why I like Goodkind's "1st Rule": people will believe a lie either because they want to believe it's true, or they're afraid it's true.Kaihekoa - Tuesday, April 24, 2018 - link
I don't know what reviews you read, but the WCCF review shows slight favor to 8700K in gaming. However, it's an incomplete review of gaming as they only test at 1440p Ultra, where the GPU bears most of the workload, and only show average framerate. Tech Report doesn't even go into any detail whatsoever on gaming and only broaches the topic in a couple paragraphs on the conclusion page. Still, they even show a lead to Intel. Anandtech shows the 2700X leading every game in framerate, which is flat out inaccurate when compared to other reviews.The Spectre BS has marginal, if any, impact on game performance. I don't know how you get the idea that CPU IO is related to loading textures in a game when textures are loaded into VRAM by the GPU. Looking further into the test setup, Anand uses slower RAM on Intel platforms, an ECC mobo for Z170, doesn't disclose GPU driver versions and uses an enterprise OS on consumer hardware. I'm guessing these and/or other factors contributed to the inaccurate numbers, relative to other reviewers, causing me to lose a lot of respect for this once well-regarded hardware reviewer. I'll get my benchmark numbers from PC Perspective and Gamers Nexus instead.
Not hating on AMD, and I even own stock in both AMD and Intel. They offer tremendous value at their price points, but I spend alot of money on my PC and use it for gaming, overclocking/benching, and basic tasks, which all seem better suited to Intel's IPC/clock speed advantage. I need reviews to post accurate numbers so that I can make my upgrade decisions, and this incomplete review with numbers not reflective of actual gaming performance fails to meet that need.
Flying Aardvark - Tuesday, April 24, 2018 - link
Come on man. I almost stop responding to replies like this. WCCF benches the base 2700, of course the 8700K wins, they don't include the 2700X. Again, the results line up with AT's. I wrote TR but meant TechRadar.Eh, I'm not going to keep going on addressing all these "points". IO is a syscall, reading/writing to disk is a syscall and that's where Intel takes up to a 50% perf hit with their Spectre v3 patches in place. This is known, and been known for months on the impact for games that do lots of texture steaming like ROTR. I even provided user provided evidence, that beat Anandtech here to the punch by 3 months.
Anand used Intel/AMD memory spec. That's what you're supposed to do when testing a product advertised to use certain components (for good reason, BTW, stupid gamer kids discounted).
Bottom line is that you and people flipping out just like you are wrong. I already knew about this being under the surface months ago. Now that it's impossible to cover it up with the 2000 series launch, more people are simply aware that AMD has taken over.
GreenMeters - Tuesday, April 24, 2018 - link
But Anandtech has the 2700, and even the 2600X and 2600, beating the 8700K. So how are the WCCF benchmarks lining up with Anandtech's?Maxiking - Tuesday, April 24, 2018 - link
"I just finished running Rise of the Tomb Raider benchmarks, 1080p, very high preset, FXAA.Unpatched:
Mountain Peak: 131.48 FPS (min: 81.19 max: 197.02)
Syria: 101.99 FPS (min: 62.73, max: 122.24)
Geothermal Valley: 98.93 FPS (min:76.48, max: 117.00)
Overall score: 111.31 FPS
Windows patch only:
Mountain Peak: 135.34 FPS (min: 38.21 max: 212.84)
Syria: 102.54 FPS (min: 44.22, max: 144.03)
Geothermal Valley: 96.36 FPS (min:41.35, max: 148.46)
Overall score: 111.93 FPS
Windows patch and BIOS update:
Mountain Peak: 134.01 FPS (min: 59.91 max: 216.16)
Syria: 101.68 FPS (min: 38.95, max: 143.44)
Geothermal Valley: 97.55 FPS (min:46.18, max: 143.97)
Overall score: 111.62 FPS
Average framerates don't seem affected."
From the link you posted, you got rekt by yourself.
Maxiking - Tuesday, April 24, 2018 - link
Actually, I can't bother waiting because, it's futile.The benchmark from that thread shows there has been no noticable performance regression after the updates had been applied.
I know what you gonna do. Look at those min fps. I WAS RIGHT. I WAS RIGHT. You are thinking right now. No, you weren't. If you ever had run TOR benchmarks, you would have experienced it. There are quite severe discrepancies in the inbuilt benchmark when comes to min/max fps. I noticed it myself when I was overclocking 6700k and running game benchmarks, stability tests. Since you are mostly using anecdotal evidence, you do not know how to make proper arguments, don't provide valid sources, we are really limited here, but that's what we have.
To support my statement, here is the video:
https://www.youtube.com/watch?v=BZEhkcs9hpU
It is not mine, but it is proving my point, there is an issue in the benchmark. It shows wrong/misleading min/max fps pretty often which other benchmarking solutions doesn't record.
The video was published on 7 Jul 2016, so no meltdown/spectre for you. I know you will argue it is no coincidence with those min fps, but look at the max as well.
Maxiking - Tuesday, April 24, 2018 - link
*solutionFlying Aardvark - Wednesday, April 25, 2018 - link
Are you retarded? I know you are because I ran those benchmarks myself and it's reproducible on more games than ROTR. Where's your contradicting information to back your claim, you do know that trying to poke holes in info is not an argument.Ranger1065 - Wednesday, April 25, 2018 - link
So sad the review failed to meet your expectations. Enjoy your time at Gamer's Nexus (cough).