The AMD 2nd Gen Ryzen Deep Dive: The 2700X, 2700, 2600X, and 2600 Tested
by Ian Cutress on April 19, 2018 9:00 AM ESTPrecision Boost 2 and XFR2: Ensuring It Hertz More
One of the biggest changes for the new Ryzen-2000 series is in how the processor implements its turbo. Up until this point (except the recent APU launch), processors have relied on a step function implementation: the system determines how many threads are loaded, attempts to implement a specific frequency on those cores if possible, and then follows the look-up table relating thread count to frequency. AMD’s goal in Precision Boost 2 is to make this process more dynamic.
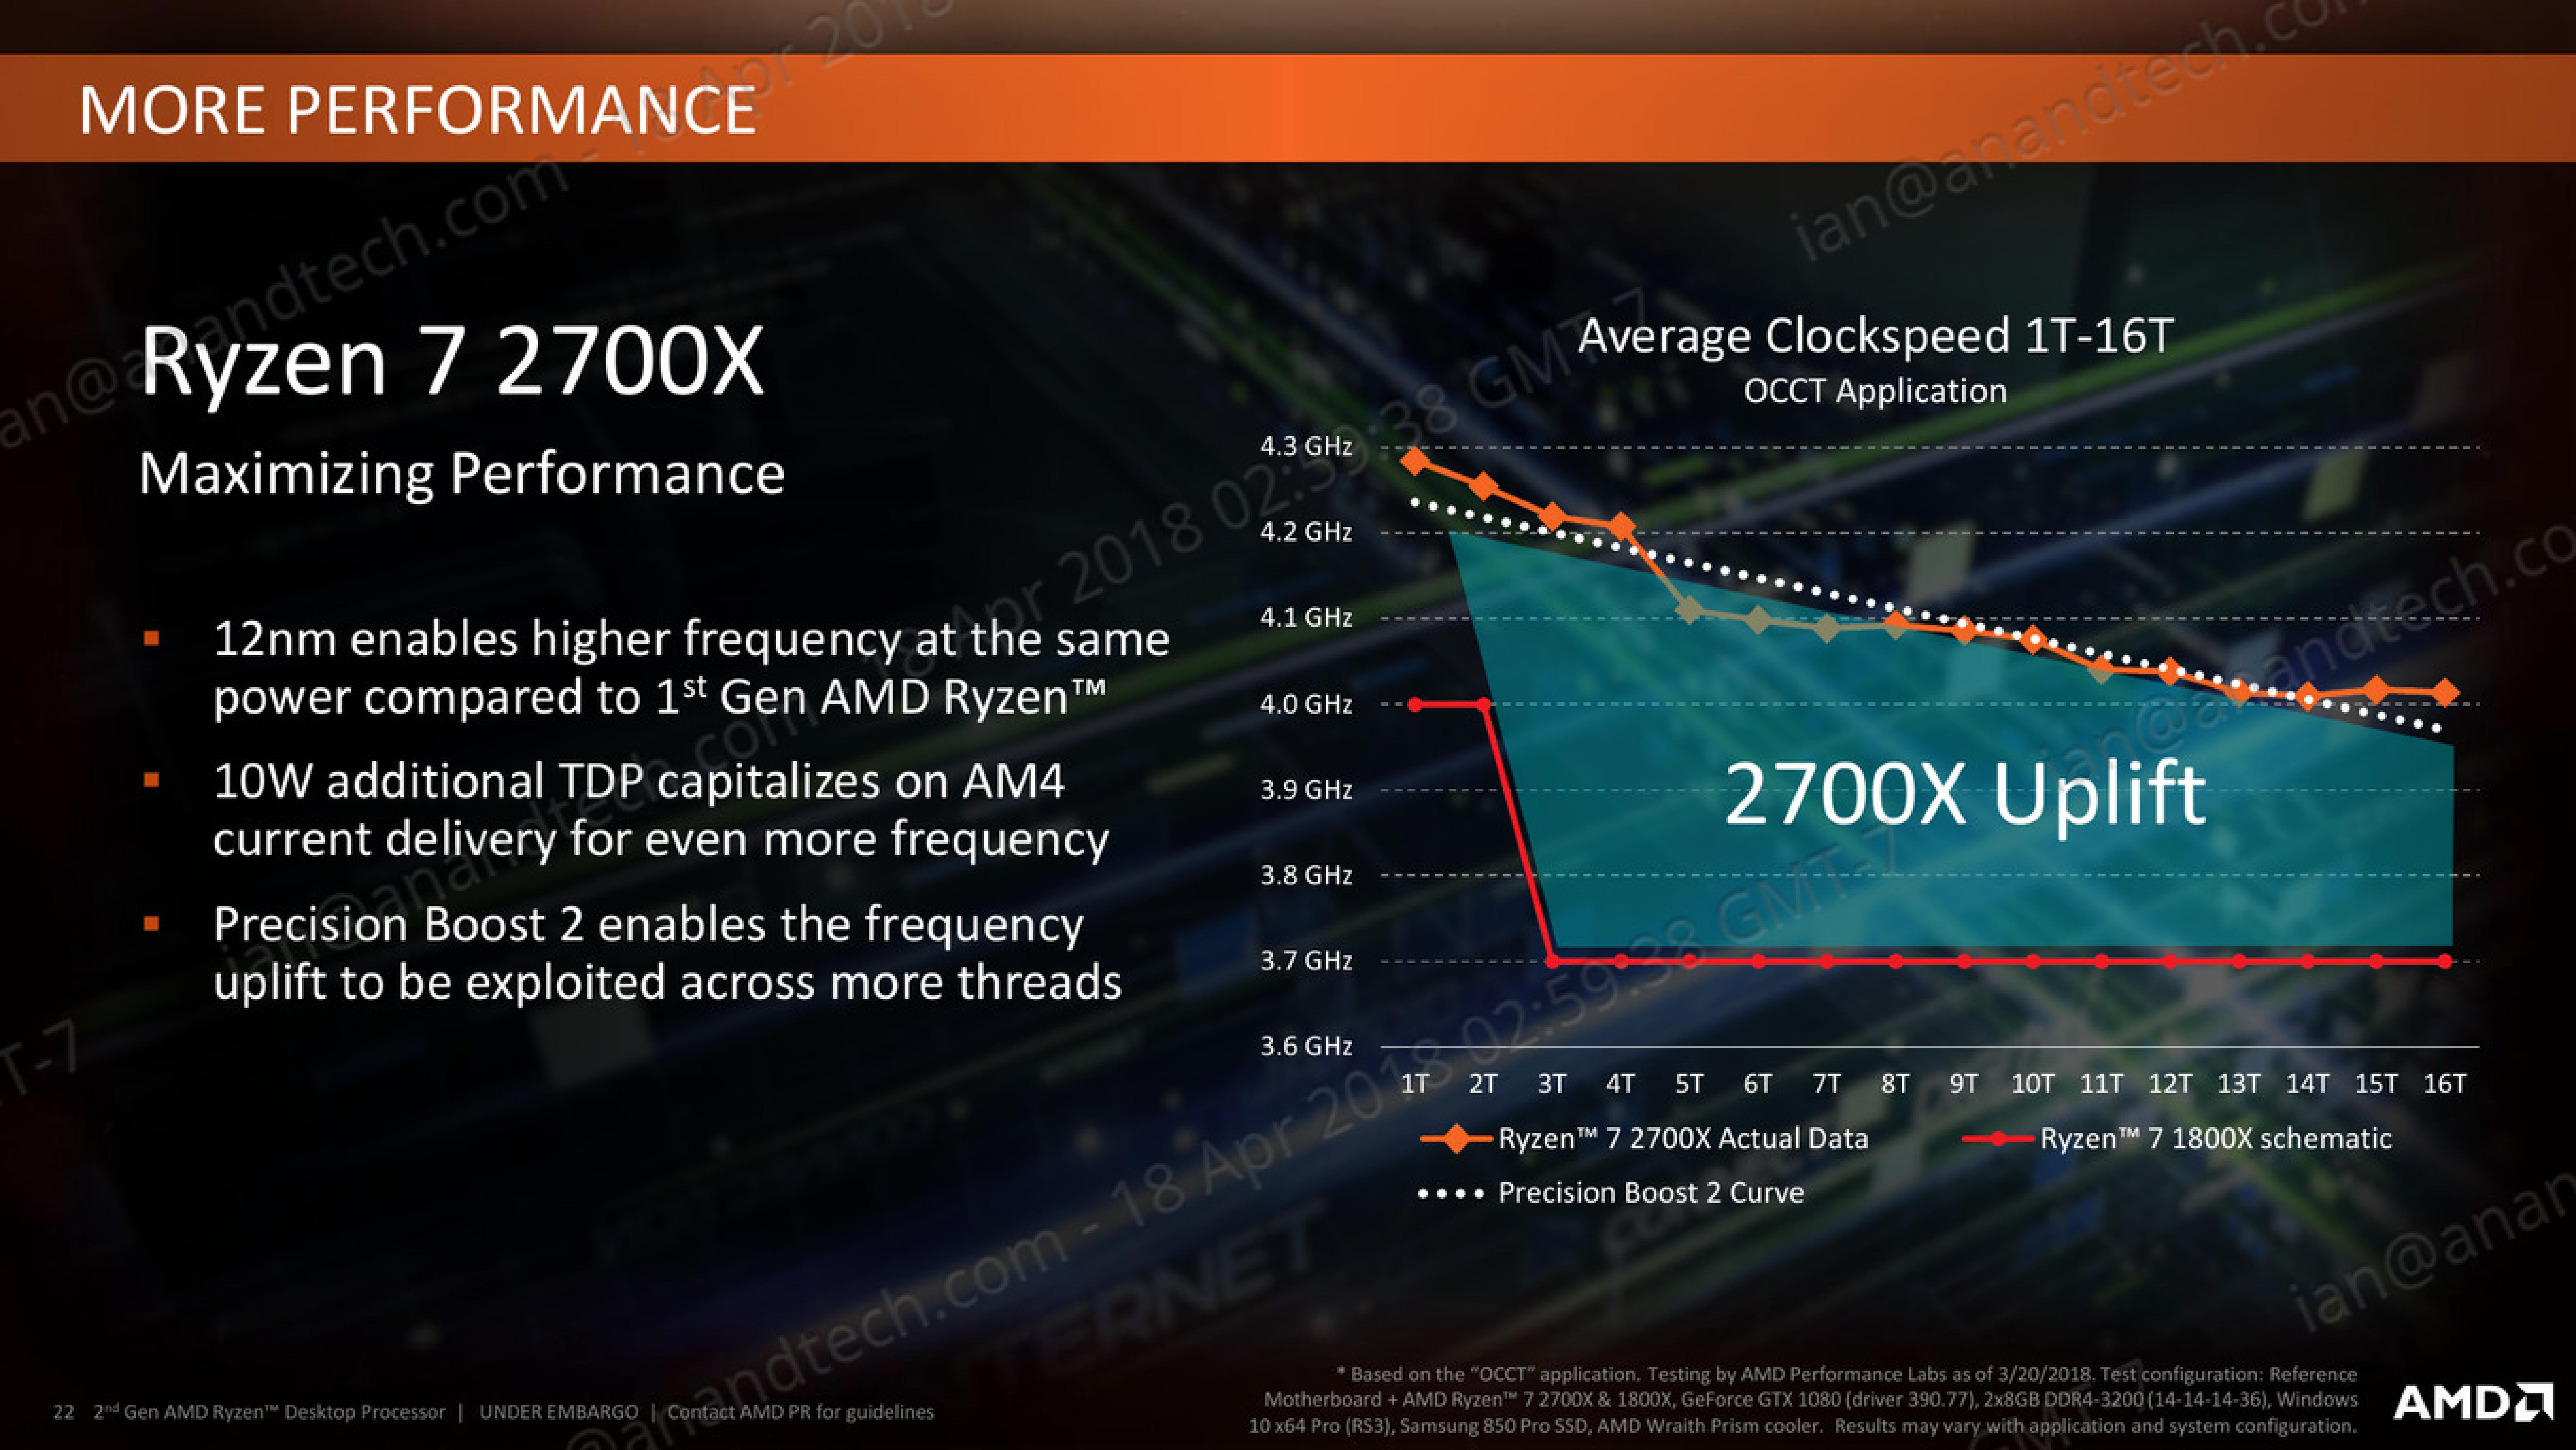
This image from AMD is how the feature is being represented: the system will determine how much of the power budget is still available, and turbo as much as possible until it hits one of the limiting factors. These factors can be any of, but not limited to, the following:
- Total chip peak power
- Individual core voltage/frequency response
- Thermal interactions between neighboring cores
- Power delivery limitations to individual cores/groups of cores
- Overall thermal performance
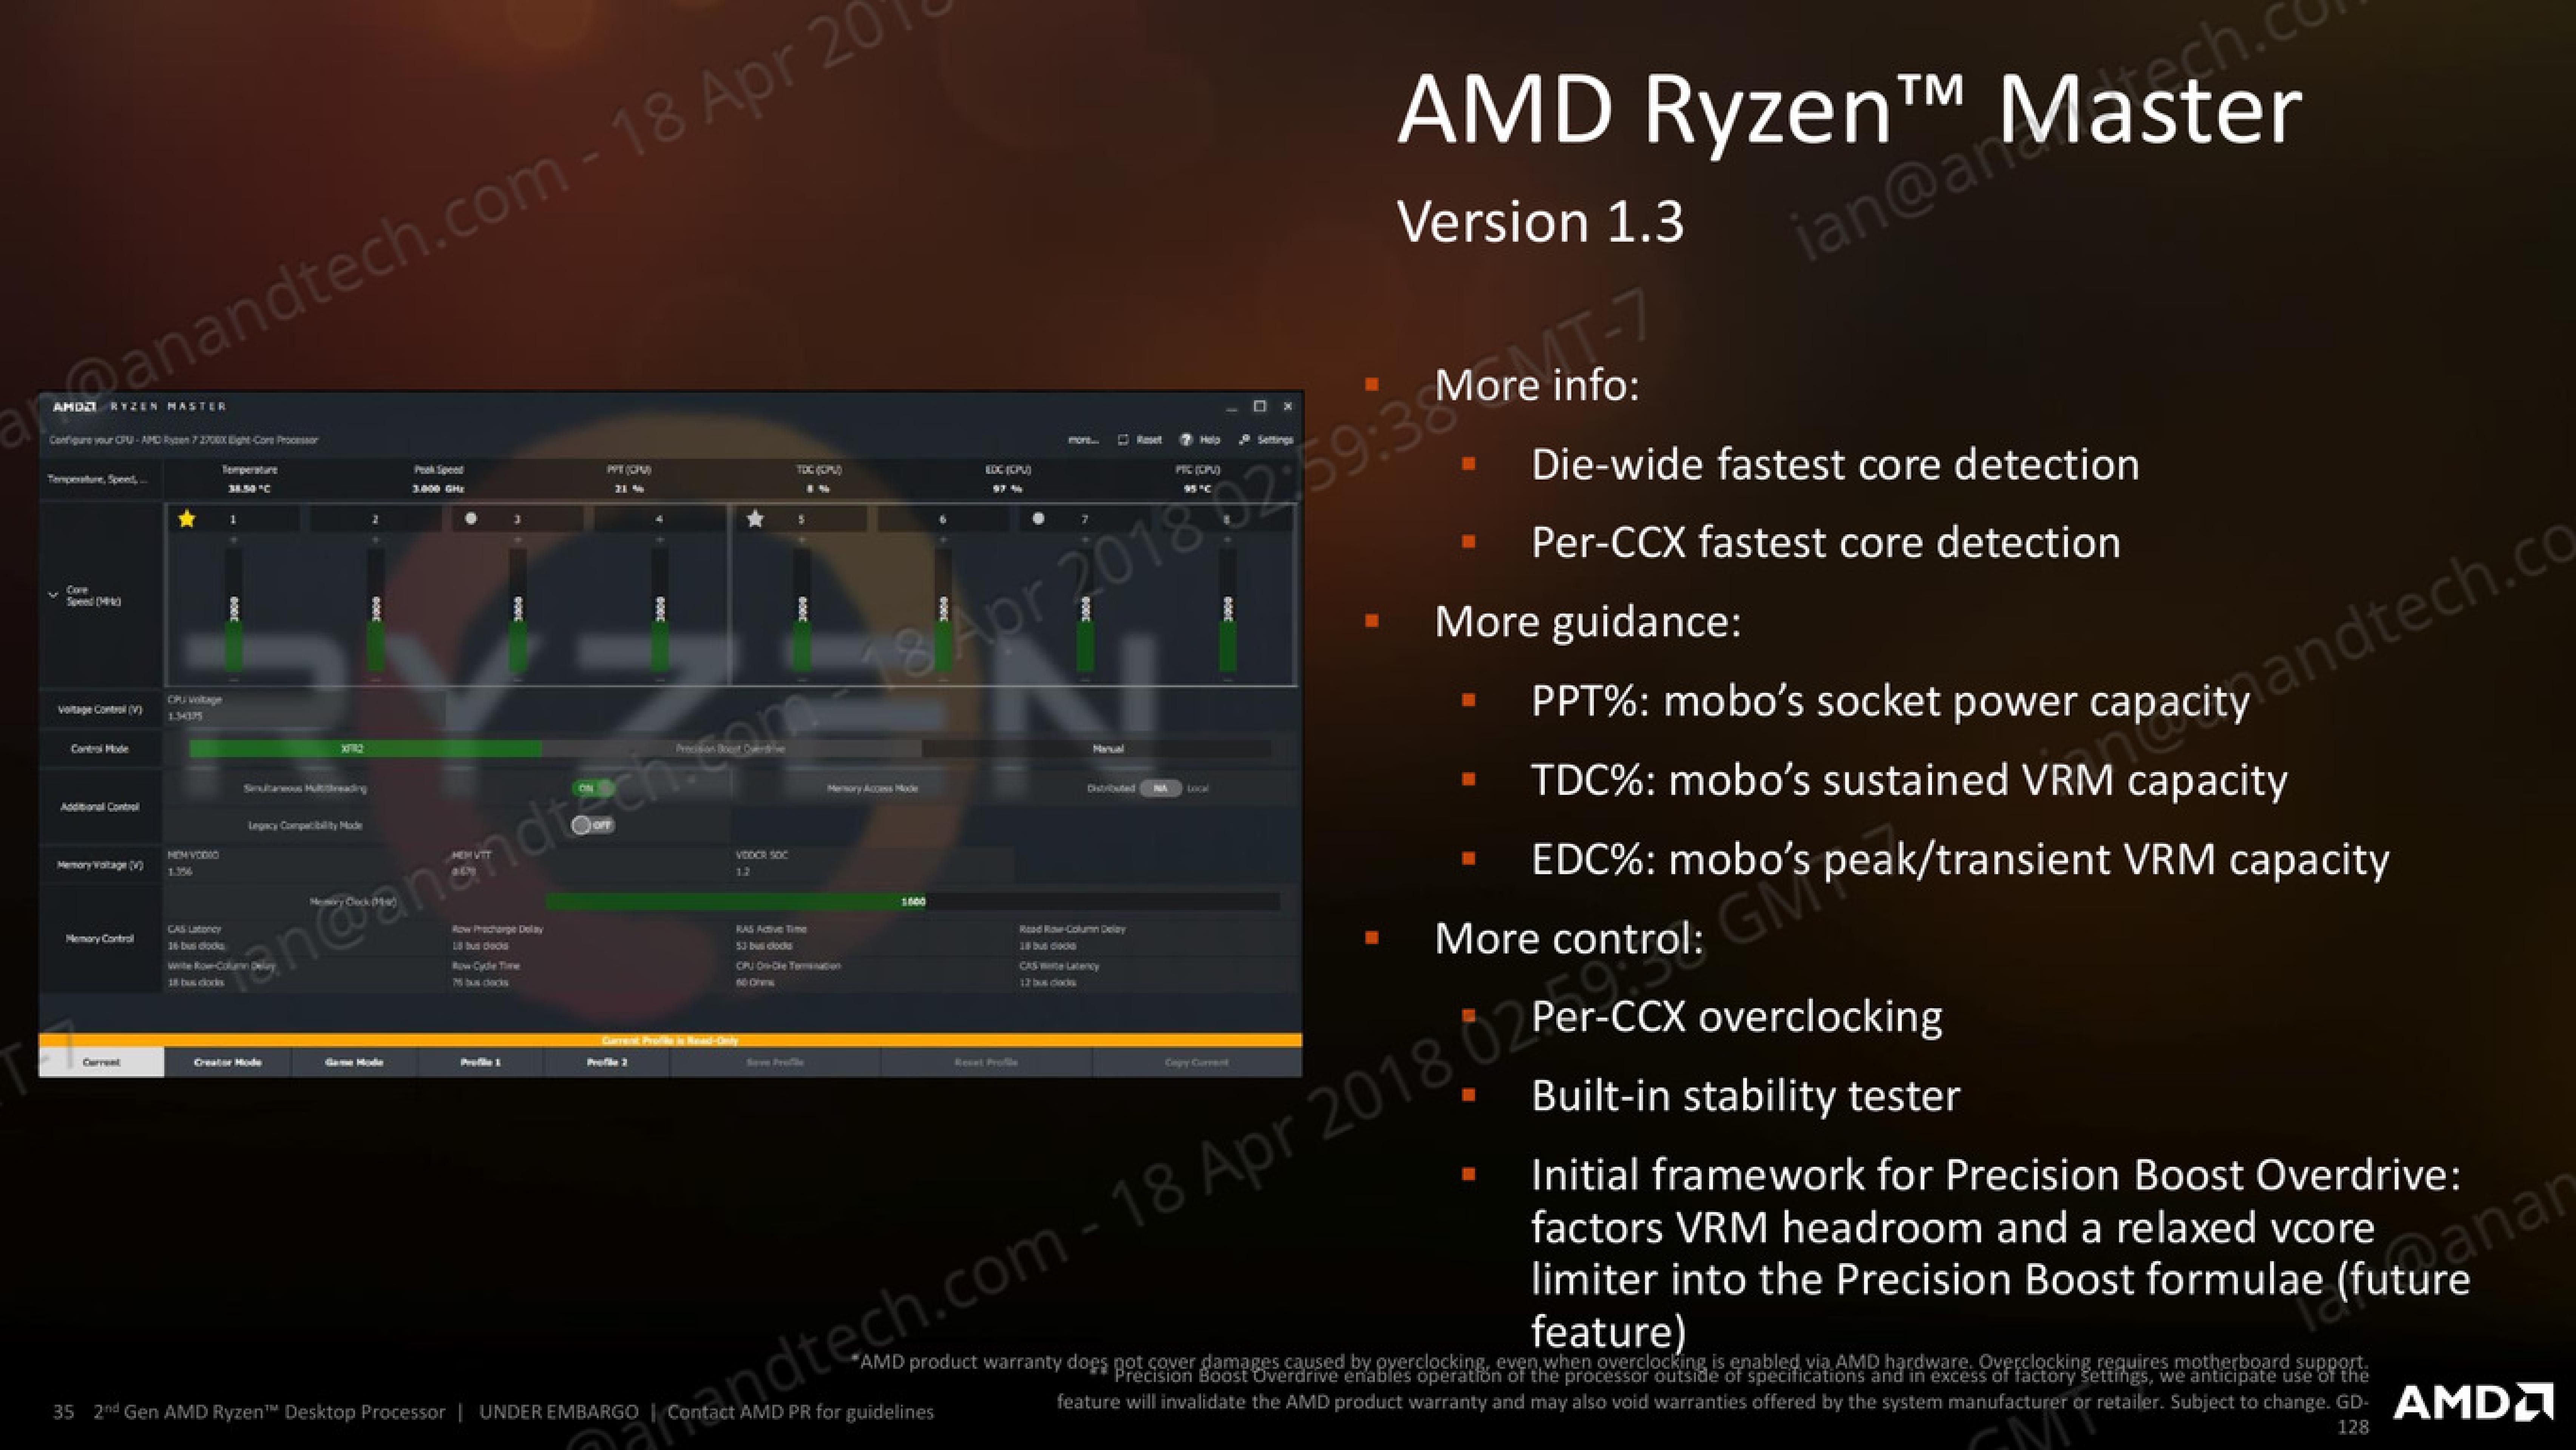
AMD’s new Ryzen Master 1.3 software, when used on a Ryzen 2000-series processor, has several indicators to determine what the limiting factors are. For the most part, the way the processor will boost and respond to the environment, will be transparent to the user.
The best way to test this in action, from my perspective, is to look at the power draw of the first generation and second generation Ryzen processors. We can examine the internal estimated power consumption of each core individually as thankfully AMD has left these registers exposed, to give the following data:
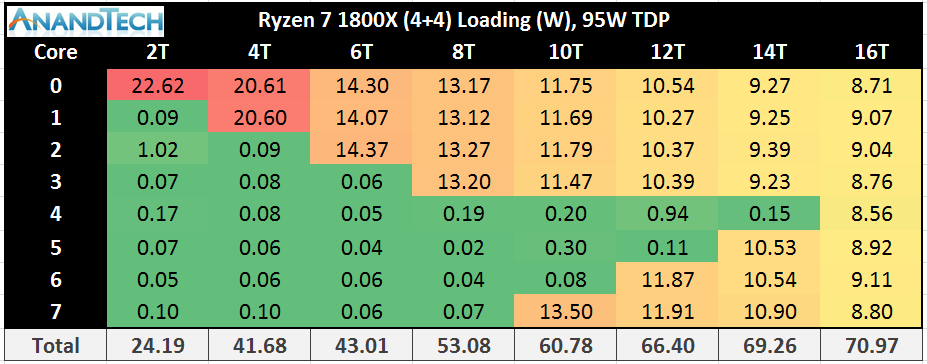
This is only the core consumption power, not the package power, which would include the DRAM controller, the Infinity Fabric, and the processor IO. This means we get numbers different to the rated TDP, but the danger here is that because the Ryzen 7 2700X has a 10W TDP higher than the Ryzen 7 1800X, where the 2700X draws more power it could seem as if that is the TDP response.
Just plotting the power consumption gives this graph:
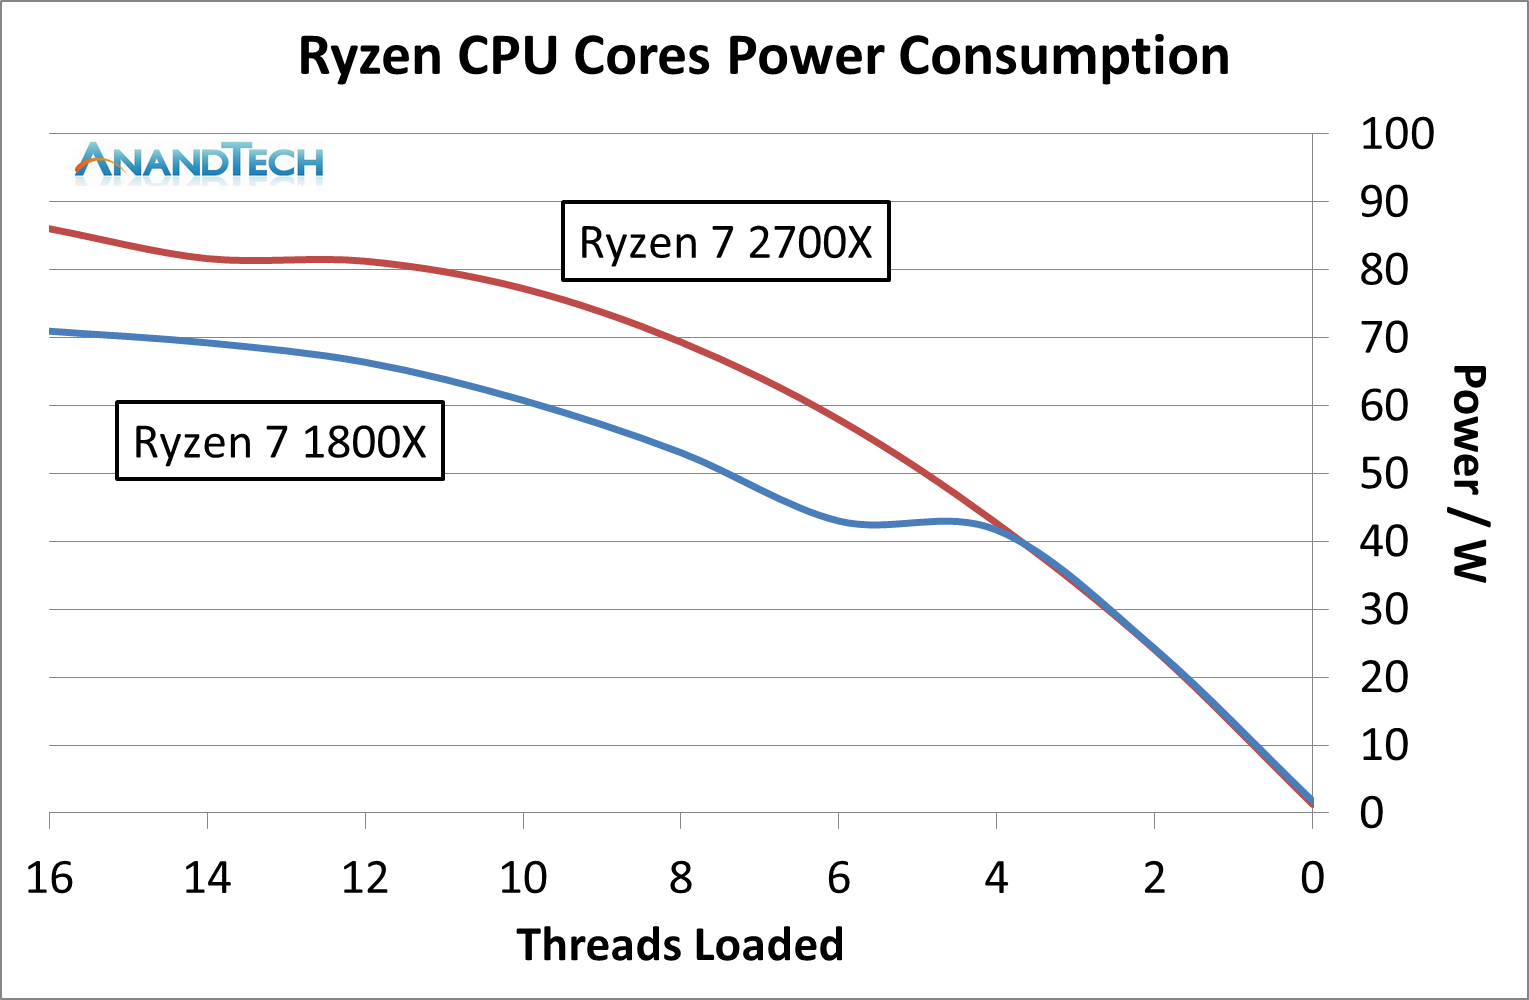
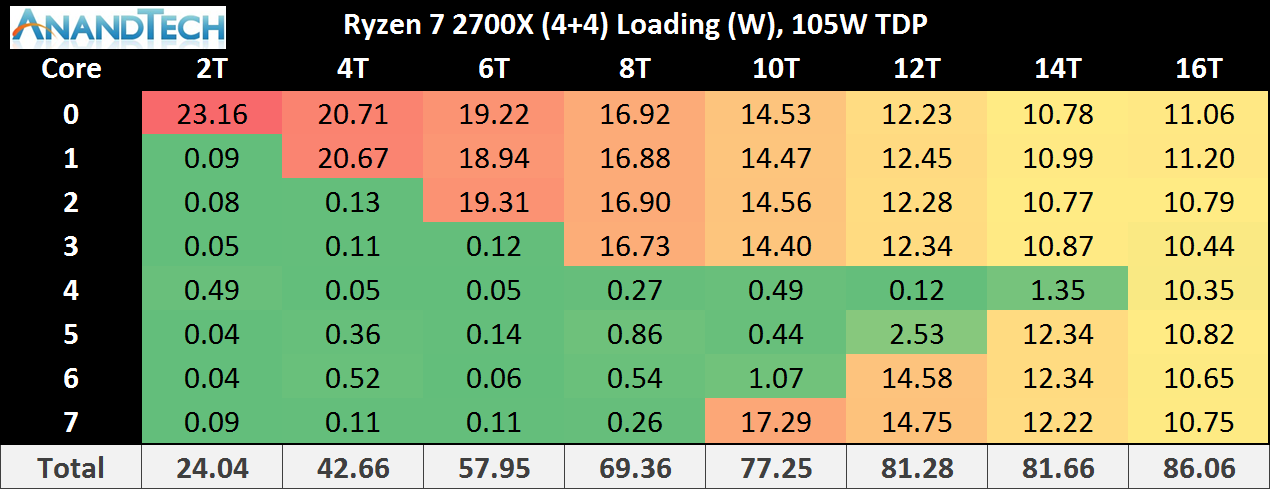
Even in this case it is clear that the Ryzen 7 2700X is drawing more power, up to 20W more, for a variable threaded load. If we change the graph to be a function of peak power:
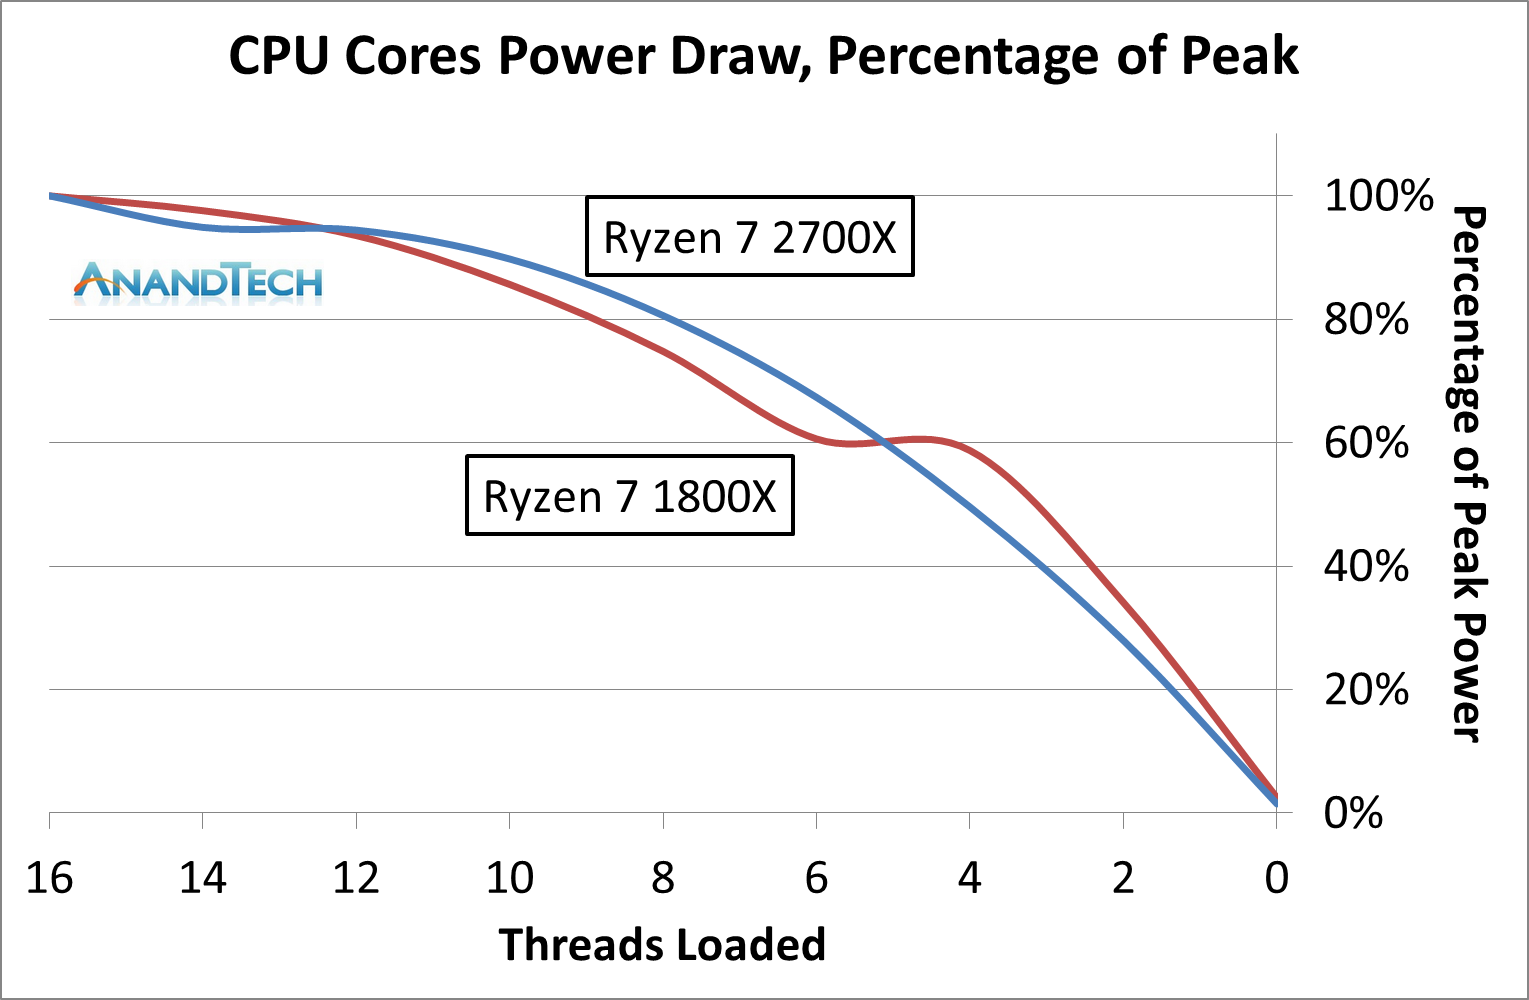
The results are not quite as clear: it would seem that the 1800X draws, as a percentage of peak power, more at low thread count, but the 2700X draws more at a middling thread count.
It is worth noting that the end result of Precision Boost 2 is two-fold: more performance, but also more power consumption. Users looking to place one of the lower powered processors into a small form factor system might look at disabling this feature and returning to a standard step-function response in order to keep the thermal capabilities in check.
A side note – despite the marketing name being called ‘Precision Boost 2’, the internal BIOS name is called ‘Core Performance Boost’. It sounds similar to Multi-Core Enhancement, which is a feature on some Intel motherboards designed to go above and beyond the turbo mechanism. However, this is just AMD’s standard PB2: disabling it will disable PB2. Initially we turned it off, thinking it was a motherboard manufacturer tool, only to throw away some testing because there is this odd disconnect between AMD’s engineers and AMD’s marketing.
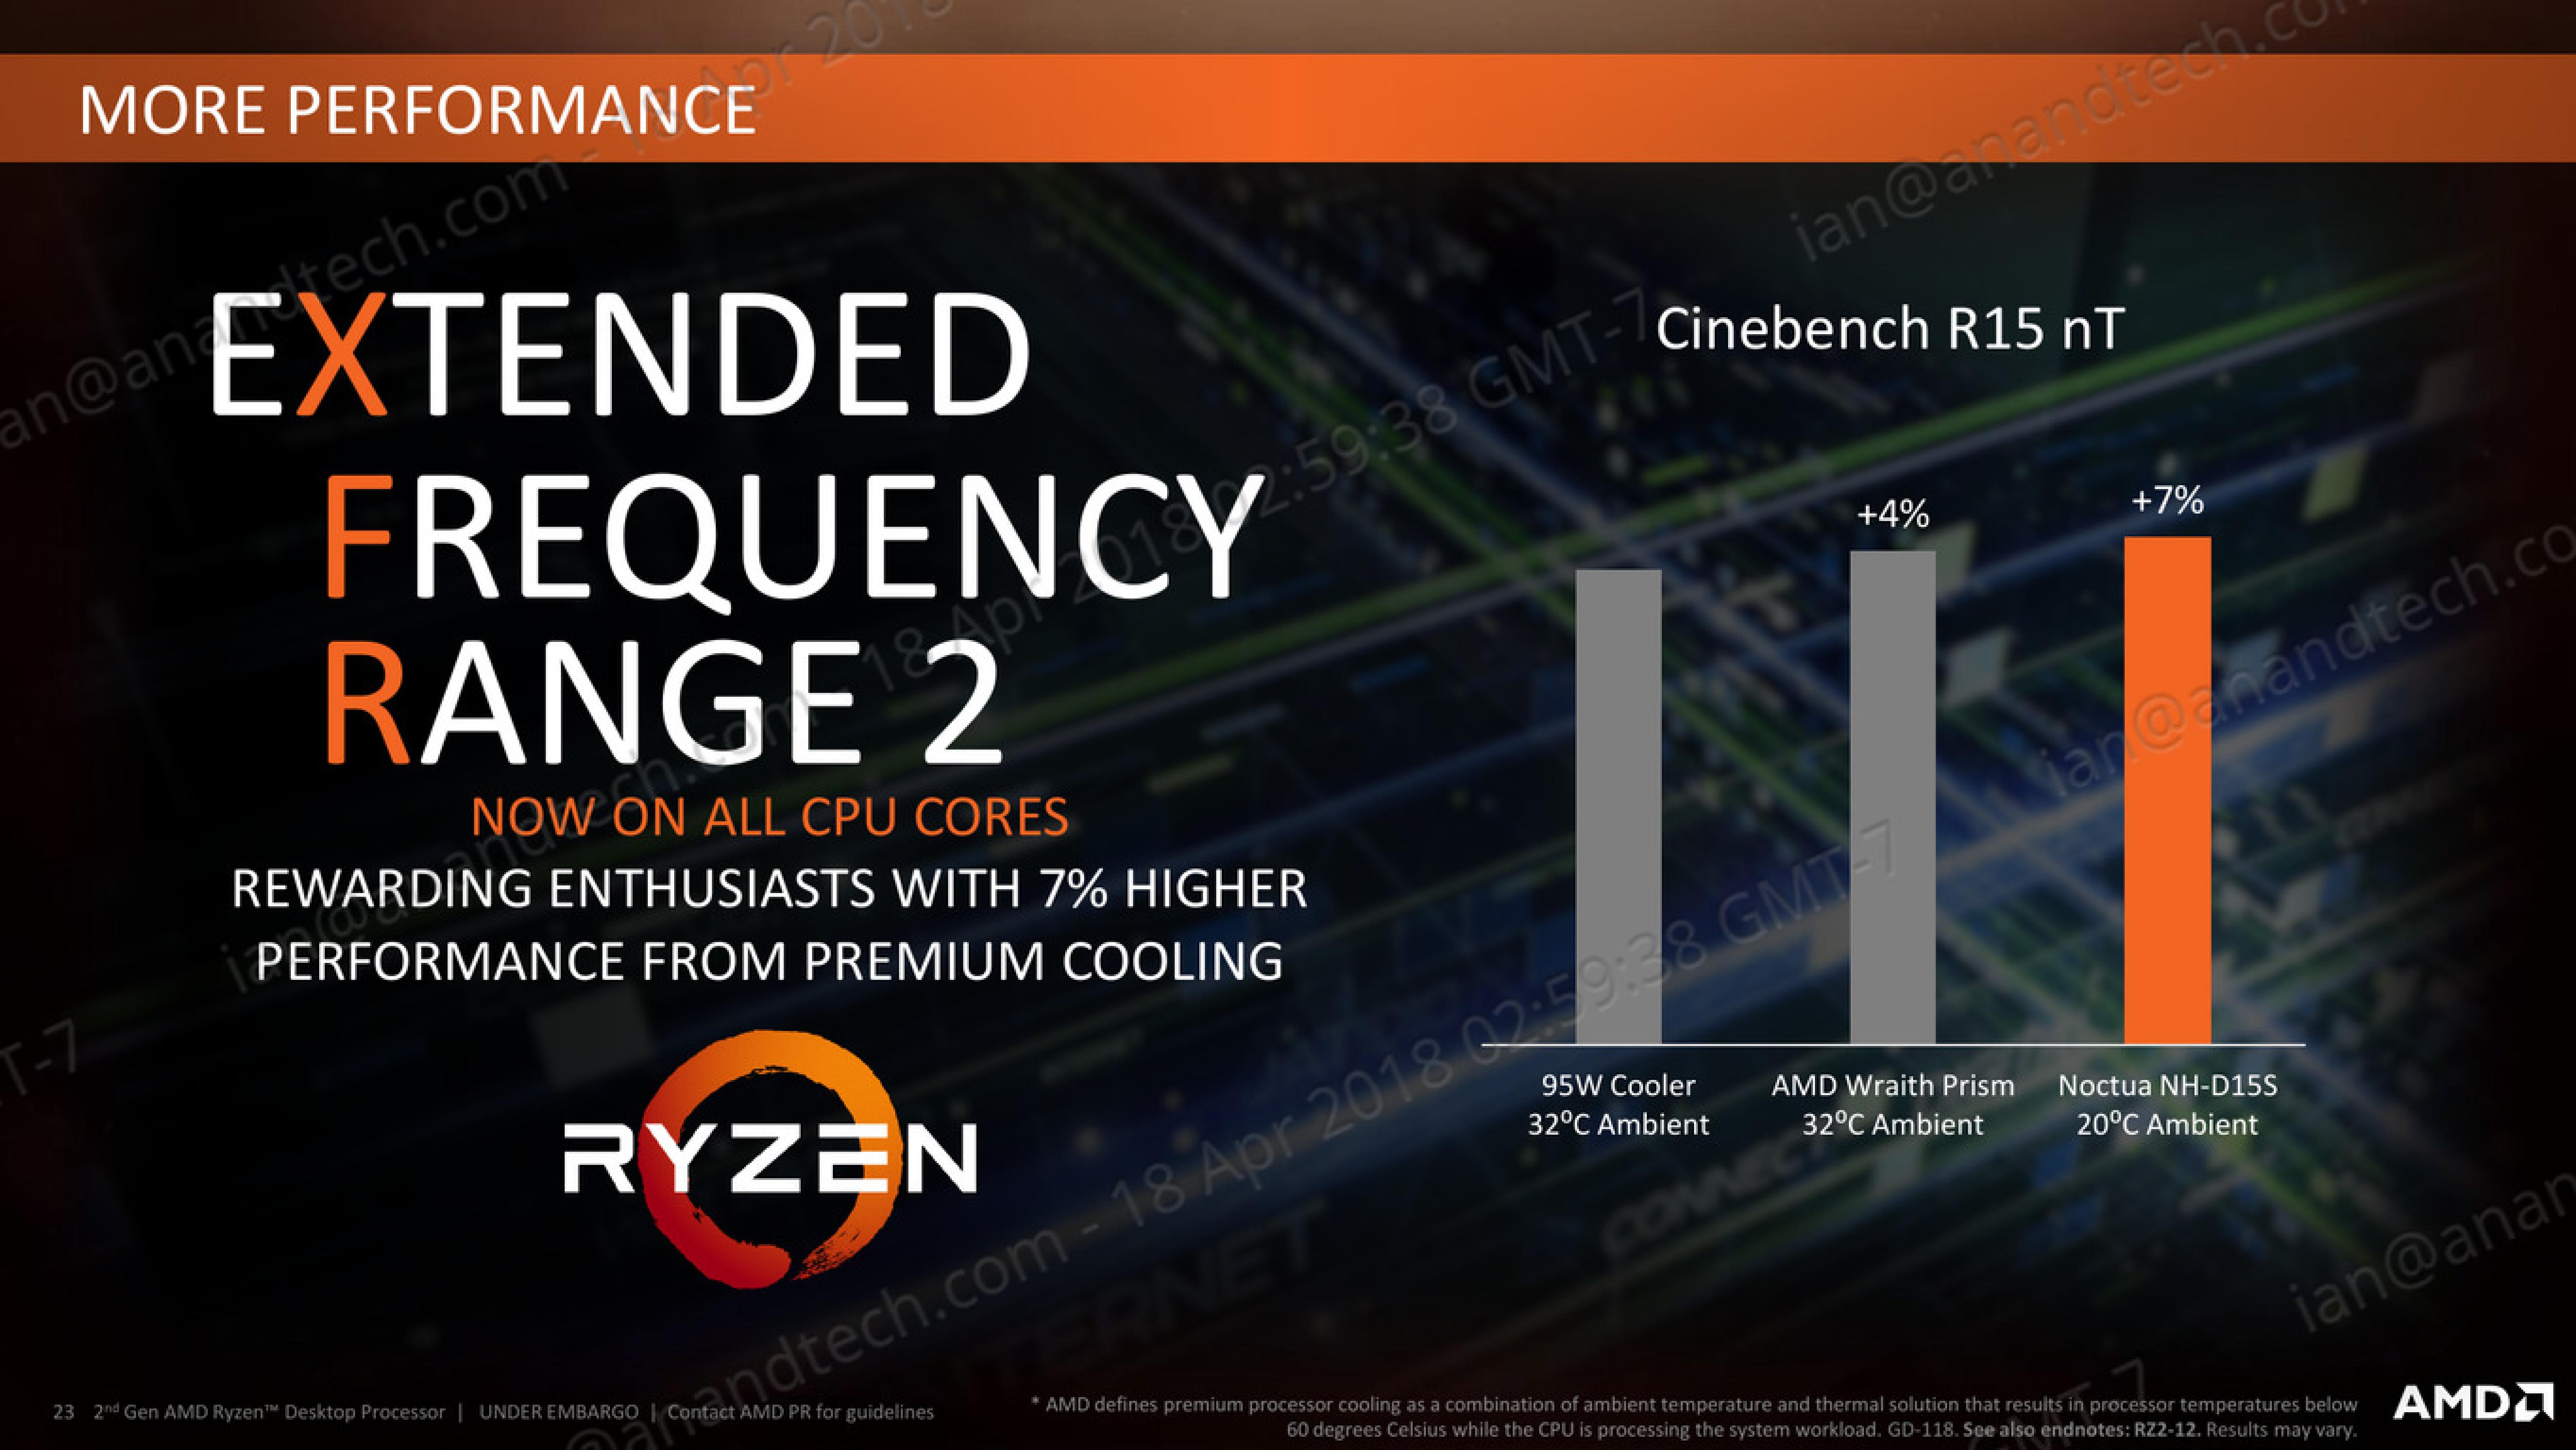
Extended Frequency Range 2 (XFR2)
For the Ryzen 2000-series, AMD has changed what XFR does. In the previous generation it was applied on certain processors to allow them to boost above the maximum turbo frequency when the thermal situation was conducive to higher frequencies and higher voltage in low thread-count states. For this generation, it still relates to thermals, however the definition is applied to any core loading: if the CPU is under 60ºC, the processor can boost no matter what the loading is above its Precision Boost 2 frequency (so why not get a better PB2 implementation?). The core still has to be within a suitable voltage/frequency window to retain stability, however.
On certain motherboards, like the ASUS Crosshair VII Hero, there are additional options to assist XFR2 beyond AMD’s implementation. ASUS does not go into specific details, however I suspect it implements a more aggressive version, perhaps extending the voltage/frequency curve, raising the power limits, and/or adjusting the thermal limit.


545 Comments
View All Comments
Flying Aardvark - Monday, April 23, 2018 - link
There's usually a lag from 6-12 months on any change that's already in place. Any topic really. Humans aren't very good at seeing what's in front of them. It requires enough people repeating it over and over around them, until they accept reality.Before that reassurance from society around them, they don't have the confidence to see/admit reality. Just something I've noticed. :)
mapesdhs - Monday, May 14, 2018 - link
That's why I like Goodkind's "1st Rule": people will believe a lie either because they want to believe it's true, or they're afraid it's true.Kaihekoa - Tuesday, April 24, 2018 - link
I don't know what reviews you read, but the WCCF review shows slight favor to 8700K in gaming. However, it's an incomplete review of gaming as they only test at 1440p Ultra, where the GPU bears most of the workload, and only show average framerate. Tech Report doesn't even go into any detail whatsoever on gaming and only broaches the topic in a couple paragraphs on the conclusion page. Still, they even show a lead to Intel. Anandtech shows the 2700X leading every game in framerate, which is flat out inaccurate when compared to other reviews.The Spectre BS has marginal, if any, impact on game performance. I don't know how you get the idea that CPU IO is related to loading textures in a game when textures are loaded into VRAM by the GPU. Looking further into the test setup, Anand uses slower RAM on Intel platforms, an ECC mobo for Z170, doesn't disclose GPU driver versions and uses an enterprise OS on consumer hardware. I'm guessing these and/or other factors contributed to the inaccurate numbers, relative to other reviewers, causing me to lose a lot of respect for this once well-regarded hardware reviewer. I'll get my benchmark numbers from PC Perspective and Gamers Nexus instead.
Not hating on AMD, and I even own stock in both AMD and Intel. They offer tremendous value at their price points, but I spend alot of money on my PC and use it for gaming, overclocking/benching, and basic tasks, which all seem better suited to Intel's IPC/clock speed advantage. I need reviews to post accurate numbers so that I can make my upgrade decisions, and this incomplete review with numbers not reflective of actual gaming performance fails to meet that need.
Flying Aardvark - Tuesday, April 24, 2018 - link
Come on man. I almost stop responding to replies like this. WCCF benches the base 2700, of course the 8700K wins, they don't include the 2700X. Again, the results line up with AT's. I wrote TR but meant TechRadar.Eh, I'm not going to keep going on addressing all these "points". IO is a syscall, reading/writing to disk is a syscall and that's where Intel takes up to a 50% perf hit with their Spectre v3 patches in place. This is known, and been known for months on the impact for games that do lots of texture steaming like ROTR. I even provided user provided evidence, that beat Anandtech here to the punch by 3 months.
Anand used Intel/AMD memory spec. That's what you're supposed to do when testing a product advertised to use certain components (for good reason, BTW, stupid gamer kids discounted).
Bottom line is that you and people flipping out just like you are wrong. I already knew about this being under the surface months ago. Now that it's impossible to cover it up with the 2000 series launch, more people are simply aware that AMD has taken over.
GreenMeters - Tuesday, April 24, 2018 - link
But Anandtech has the 2700, and even the 2600X and 2600, beating the 8700K. So how are the WCCF benchmarks lining up with Anandtech's?Maxiking - Tuesday, April 24, 2018 - link
"I just finished running Rise of the Tomb Raider benchmarks, 1080p, very high preset, FXAA.Unpatched:
Mountain Peak: 131.48 FPS (min: 81.19 max: 197.02)
Syria: 101.99 FPS (min: 62.73, max: 122.24)
Geothermal Valley: 98.93 FPS (min:76.48, max: 117.00)
Overall score: 111.31 FPS
Windows patch only:
Mountain Peak: 135.34 FPS (min: 38.21 max: 212.84)
Syria: 102.54 FPS (min: 44.22, max: 144.03)
Geothermal Valley: 96.36 FPS (min:41.35, max: 148.46)
Overall score: 111.93 FPS
Windows patch and BIOS update:
Mountain Peak: 134.01 FPS (min: 59.91 max: 216.16)
Syria: 101.68 FPS (min: 38.95, max: 143.44)
Geothermal Valley: 97.55 FPS (min:46.18, max: 143.97)
Overall score: 111.62 FPS
Average framerates don't seem affected."
From the link you posted, you got rekt by yourself.
Maxiking - Tuesday, April 24, 2018 - link
Actually, I can't bother waiting because, it's futile.The benchmark from that thread shows there has been no noticable performance regression after the updates had been applied.
I know what you gonna do. Look at those min fps. I WAS RIGHT. I WAS RIGHT. You are thinking right now. No, you weren't. If you ever had run TOR benchmarks, you would have experienced it. There are quite severe discrepancies in the inbuilt benchmark when comes to min/max fps. I noticed it myself when I was overclocking 6700k and running game benchmarks, stability tests. Since you are mostly using anecdotal evidence, you do not know how to make proper arguments, don't provide valid sources, we are really limited here, but that's what we have.
To support my statement, here is the video:
https://www.youtube.com/watch?v=BZEhkcs9hpU
It is not mine, but it is proving my point, there is an issue in the benchmark. It shows wrong/misleading min/max fps pretty often which other benchmarking solutions doesn't record.
The video was published on 7 Jul 2016, so no meltdown/spectre for you. I know you will argue it is no coincidence with those min fps, but look at the max as well.
Maxiking - Tuesday, April 24, 2018 - link
*solutionFlying Aardvark - Wednesday, April 25, 2018 - link
Are you retarded? I know you are because I ran those benchmarks myself and it's reproducible on more games than ROTR. Where's your contradicting information to back your claim, you do know that trying to poke holes in info is not an argument.Ranger1065 - Wednesday, April 25, 2018 - link
So sad the review failed to meet your expectations. Enjoy your time at Gamer's Nexus (cough).