The AMD 2nd Gen Ryzen Deep Dive: The 2700X, 2700, 2600X, and 2600 Tested
by Ian Cutress on April 19, 2018 9:00 AM ESTConclusion: Catching the Incumbent
Throughout AMD’s journey with Zen, the goal of high-performance x86 compute has two goals: be competitive, and be the best. Without a doubt the first generation of Ryzen certainly succeeded in being competitive, with analysts and outlets showing Ryzen processors in top selling lists, and review benchmarks putting the top AMD chips competitively against Intel’s high-end desktop parts. The goal, for the next few years, is to grab that low hanging microarchitectural fruit, and to taking advantage of new process nodes as time goes on. First stage is Ryzen’s second generation, known as the Ryzen-2000 series.
In this review we’ve shown that AMD met its goal of an additional 3% raw performance gain, with our benchmarks showing +3.1%. Combining this with the frequency increases derived from the GlobalFoundries 12nm manufacturing process, and turbo features such as Precision Turbo Boost making the most of thermal limits in an intuitive way, AMD also hit its 10% performance gain between generations. This doesn’t sound like much in all honesty, as on the surface this seems little more than an improved manufacturing bump plus some intelligent reduction in cache latency – if this was Intel, we’d be crying out for a big and brash gain in performance, but AMD is still riding the Zen design train and the focus is on the next full microarchitectural update in Zen 2, so most users and journalists are giving AMD a certifiable thumbs up at this point hoping to see a bigger jump next time around.
4K Gaming Analysis
However, everyone wants to know about the Ryzen 2000-series results. We start with gaming, and first up in our Performance/Price graphs is the high-end 4K gaming results. Our results take the R7 1800X as the base ‘100%’ and we take the geometric mean over all of our gaming tests at 4K.
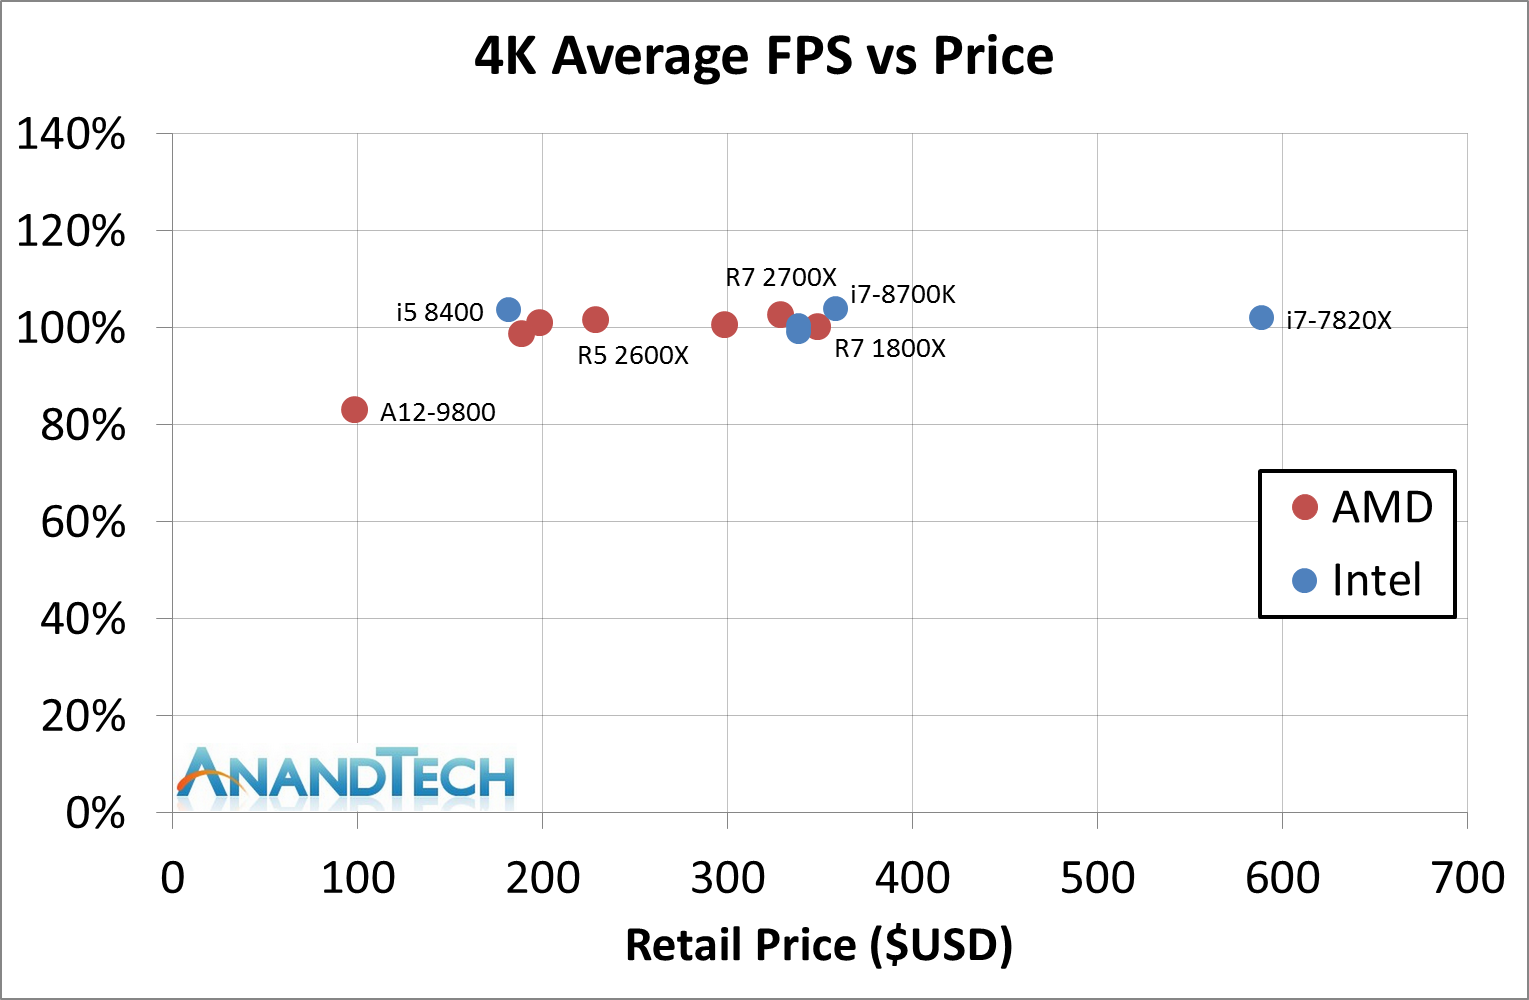
Across the board, the new Ryzen 2000-series processors improved over the Ryzen 7 1800X, even the Ryzen 5 2600, from 1-3%. The Intel processors were 0-4% ahead of the 1800X, with both Coffee Lake processors being at that top 4%. In a GPU limited scenario here, there is some benefit to that single core performance for sure, however all the modern CPUs at a reasonable frequency seem plenty to get through.
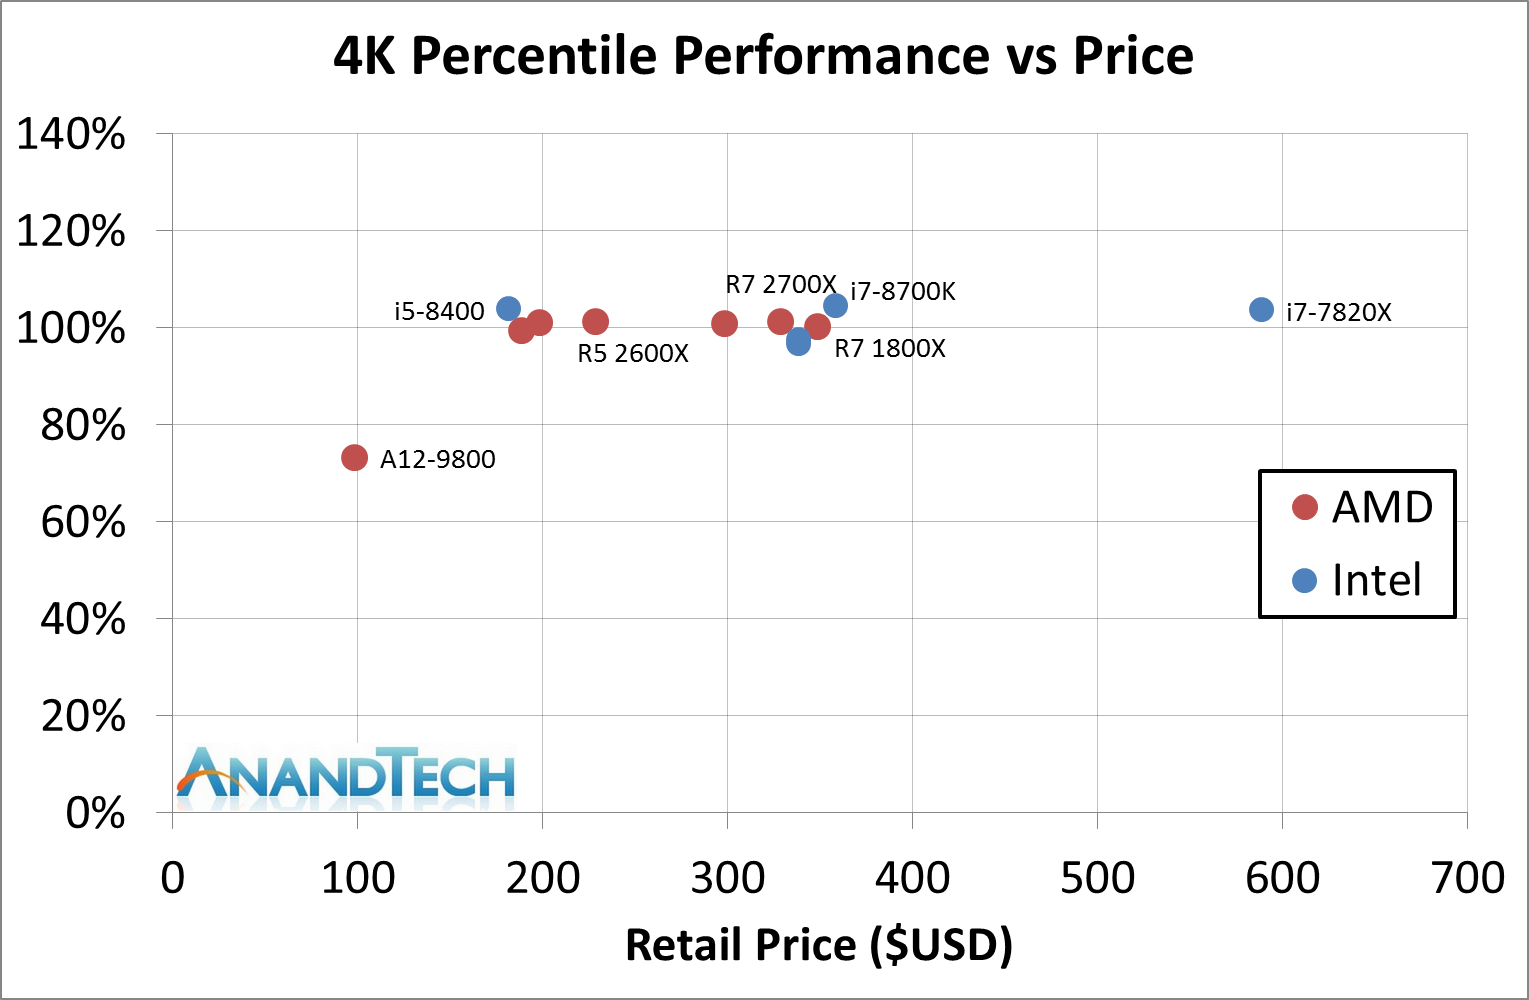
For 99th percentile graphs, the new AMD processors either draw level or narrowly beat the Ryzen 1000-series. For our Intel tests, the 6700K/7700K previous generations are both down 3% over the 1800X, but the others are up 4% over the 1800X. Intel pushing Coffee Lake has helped it get that top spot, but all the processors (except Bristol Ridge, the A12-9800) perform pretty much equal again.
1080p Gaming Analysis
The key aspect for some users is in the lower resolution gaming: 1920x1080 is still the resolution that dominates the gaming charts, no matter how much us enthusiasts like to push for more pixels. Some readers reached out to us stating that they still buy the best graphics card but run at 200+ FPS at low resolutions, just for responsiveness. Running at lower resolution is a poor indication of future CPU performance, but what matters is the real world numbers that we are seeing today.
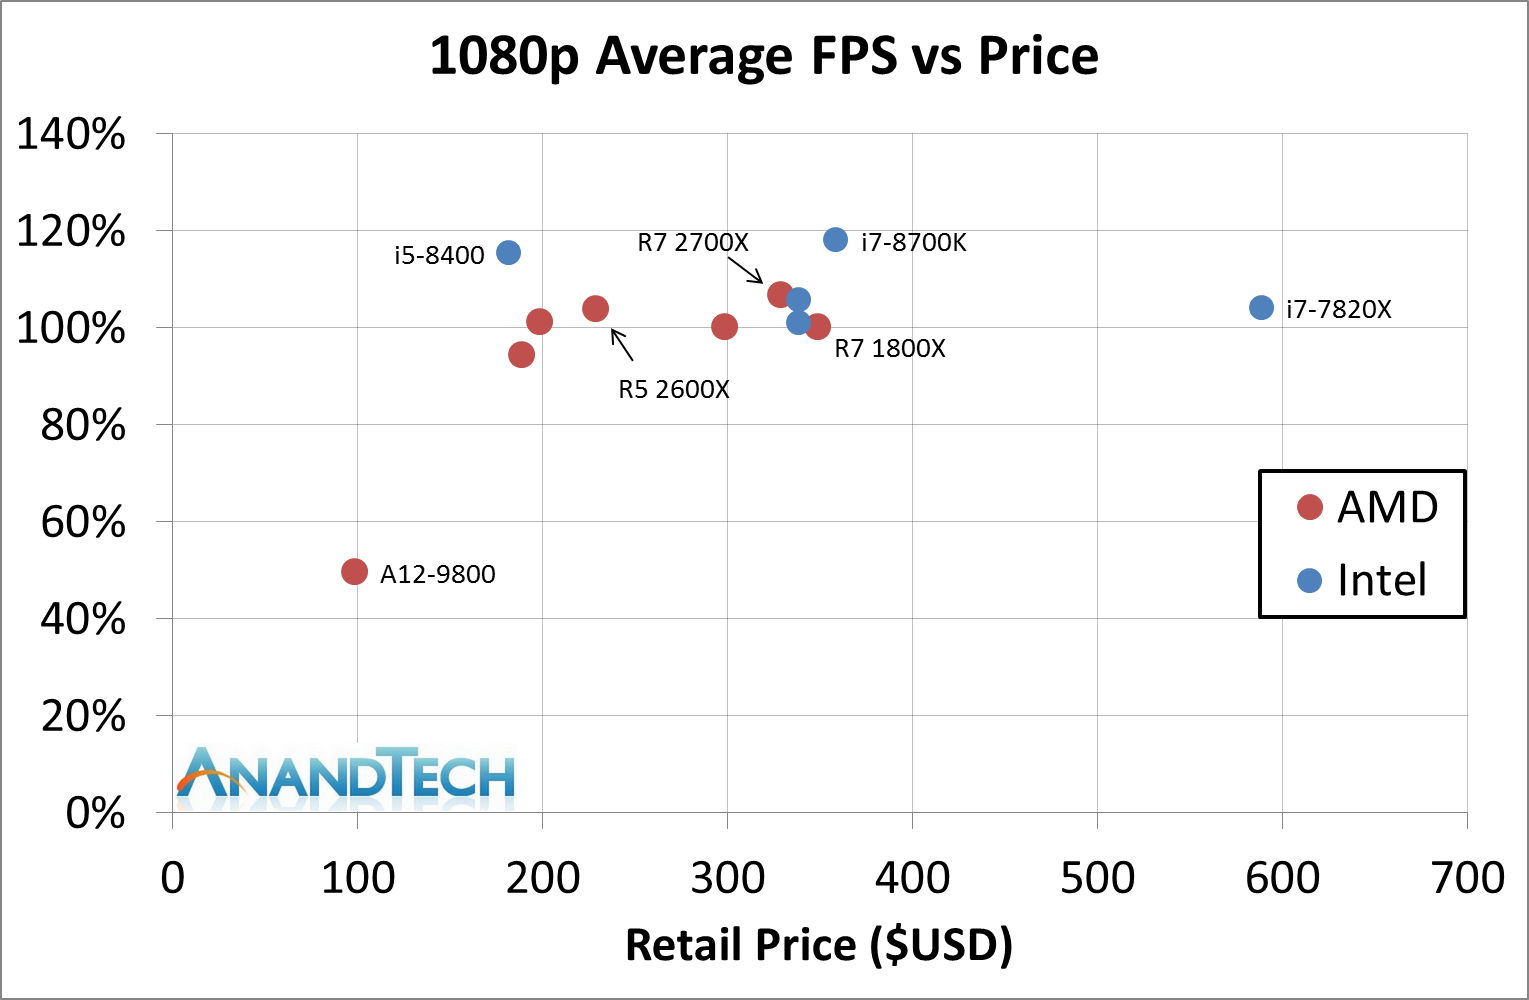
At this resolution, the Ryzen 7 2700X pushes an average +7% over the previous generation 1800X, and the new 65W parts easily matching the 1800X as well. Users who were looking at the budget friendly Ryzen 5 1600, the best seller for AMD last year according to some reports, can now look at the 2600 for +7% or 2600X for a +10% gain over the 1600.
However, Intel pulls out a win here. Through the higher IPC and clock speed, the Coffee Lake processors are 8-10% over Ryzen 7 2700X, ranging from +3% to +25% depending on the title. By contrast, our results do show that the Ryzen 7 2700X blasts past the older Intel generation processors, maing the 2700X win by a small margin to Kaby Lake and a 5%+ margin to Skylake.
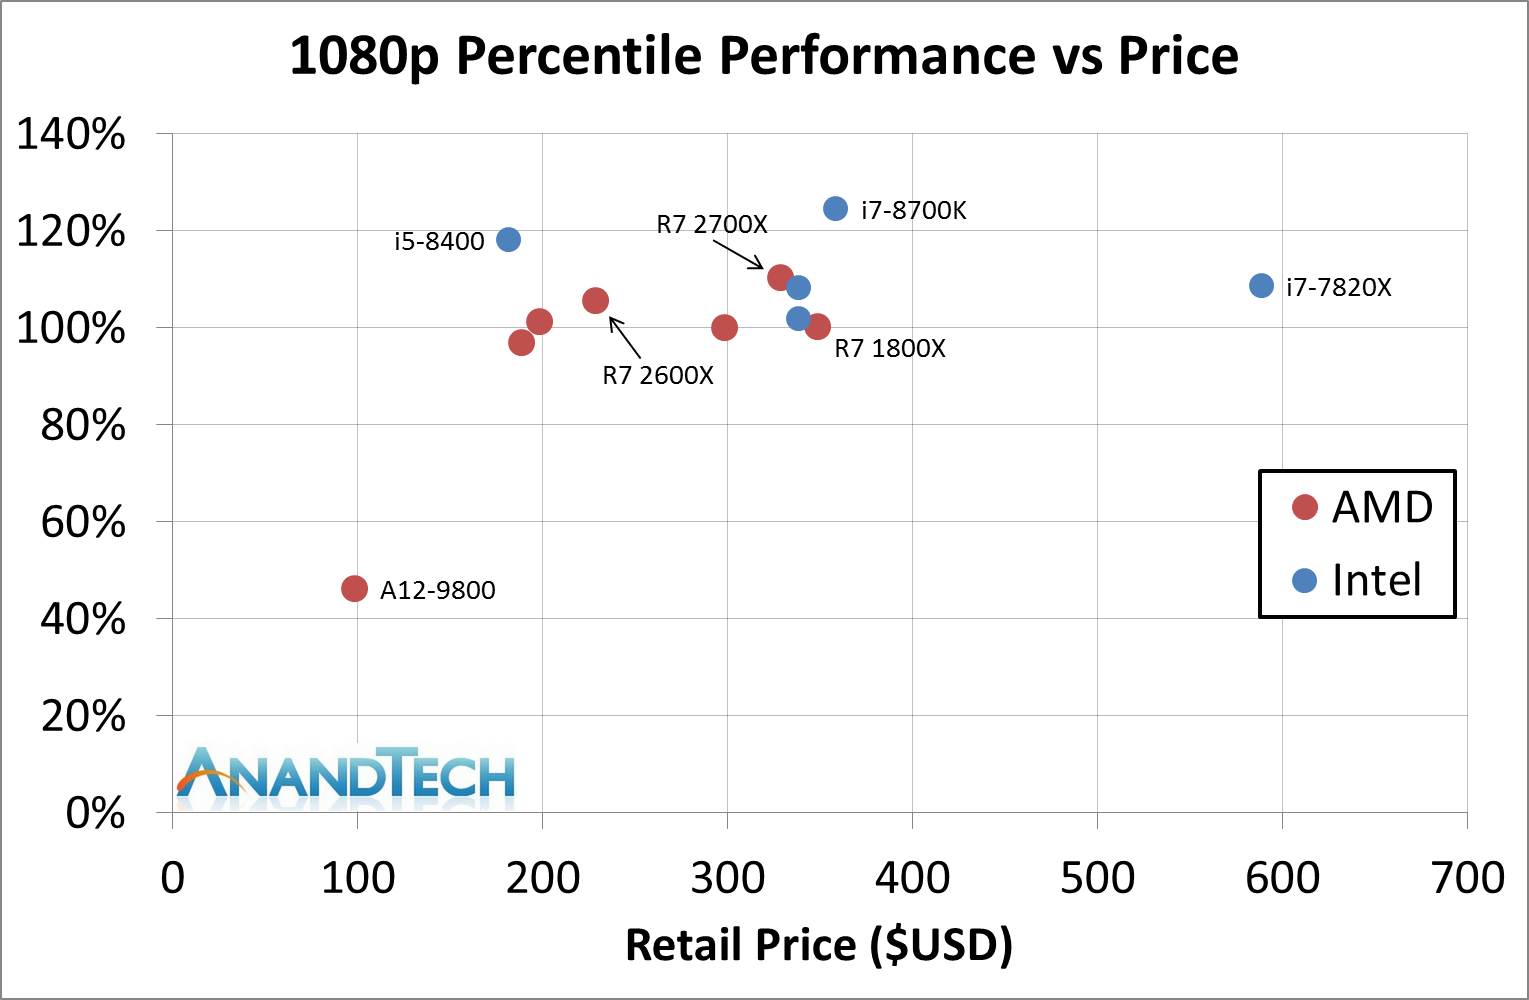
The 99th percentile graph at 1080p looks like a stretched out version of the average frame rate graph, and this is broadly accurate: the processors better at 1080p perform even better on percentiles. Out of all the metrics AMD needs to be competitive on, this is the one where the new performance boost works best, but there is still work to do. This will, in all honesty, look better if and when AMD can match Intel on frequency. AMD also has a deficit in main memory DRAM latency, which we have cited as a factor in previous testing for 99th percentile frame rates. It will be interesting if AMD pushes ahead with a higher supported memory frequency quicker than Intel, because that would help here.
Workstation Analysis
For mainstream processor lines, with Ryzen-1000, AMD put eight cores and sixteen threads against Intel’s Kaby Lake with four cores and eight threads. This time around Intel has moved up to six cores with Coffee Lake, making it 12 on Intel vs. 16 on AMD, and pumped some more turbo frequency as well, but Intel is pushing the power budget beyond the box rating by a considerable margin by comparison. In the mid-range, where it was four threads against twelve, it is now six against twelve, however again Intel hits the higher frequencies.
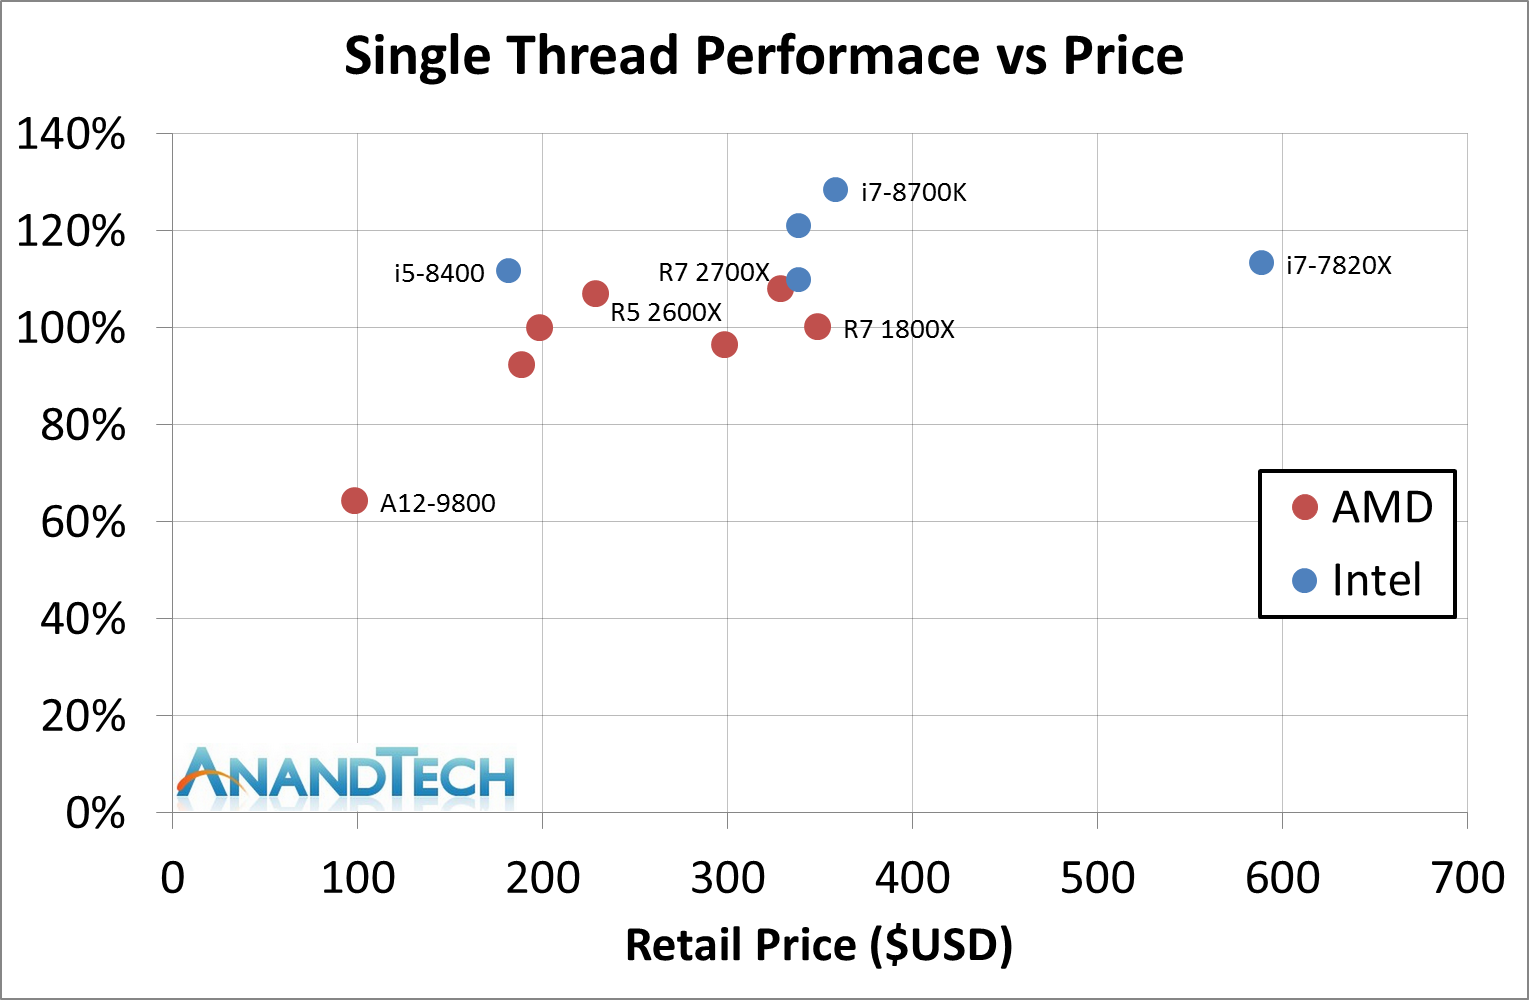
In our single threaded benchmarks, the new Ryzen-2000 series now does match Intel’s Skylake processors for performance. In the last round of comparisons, Intel still had some advantage, but now the two are equal. Unfortunately for AMD, Intel is two further ‘generations’ ahead, through Kaby Lake and Coffee Lake, which mainly add in single core performance through additional frequency. This means that a Core i5-8400 does beat the best AMD has in single thread, and the Core i7-8770K rules the roost.
In multi-threaded workloads, a number of additional variables come into play. The nature of the threading in each core, such as which parts of the core are dynamic or statically partitioned, come into play, along with how memory and cache are managed. Here AMD has been aggressive in low level cache latency and size, however the AMD L3 non-inclusive cache is transposed against Intel’s L3 write-back cache which is more useful, as well as lower latency main memory.
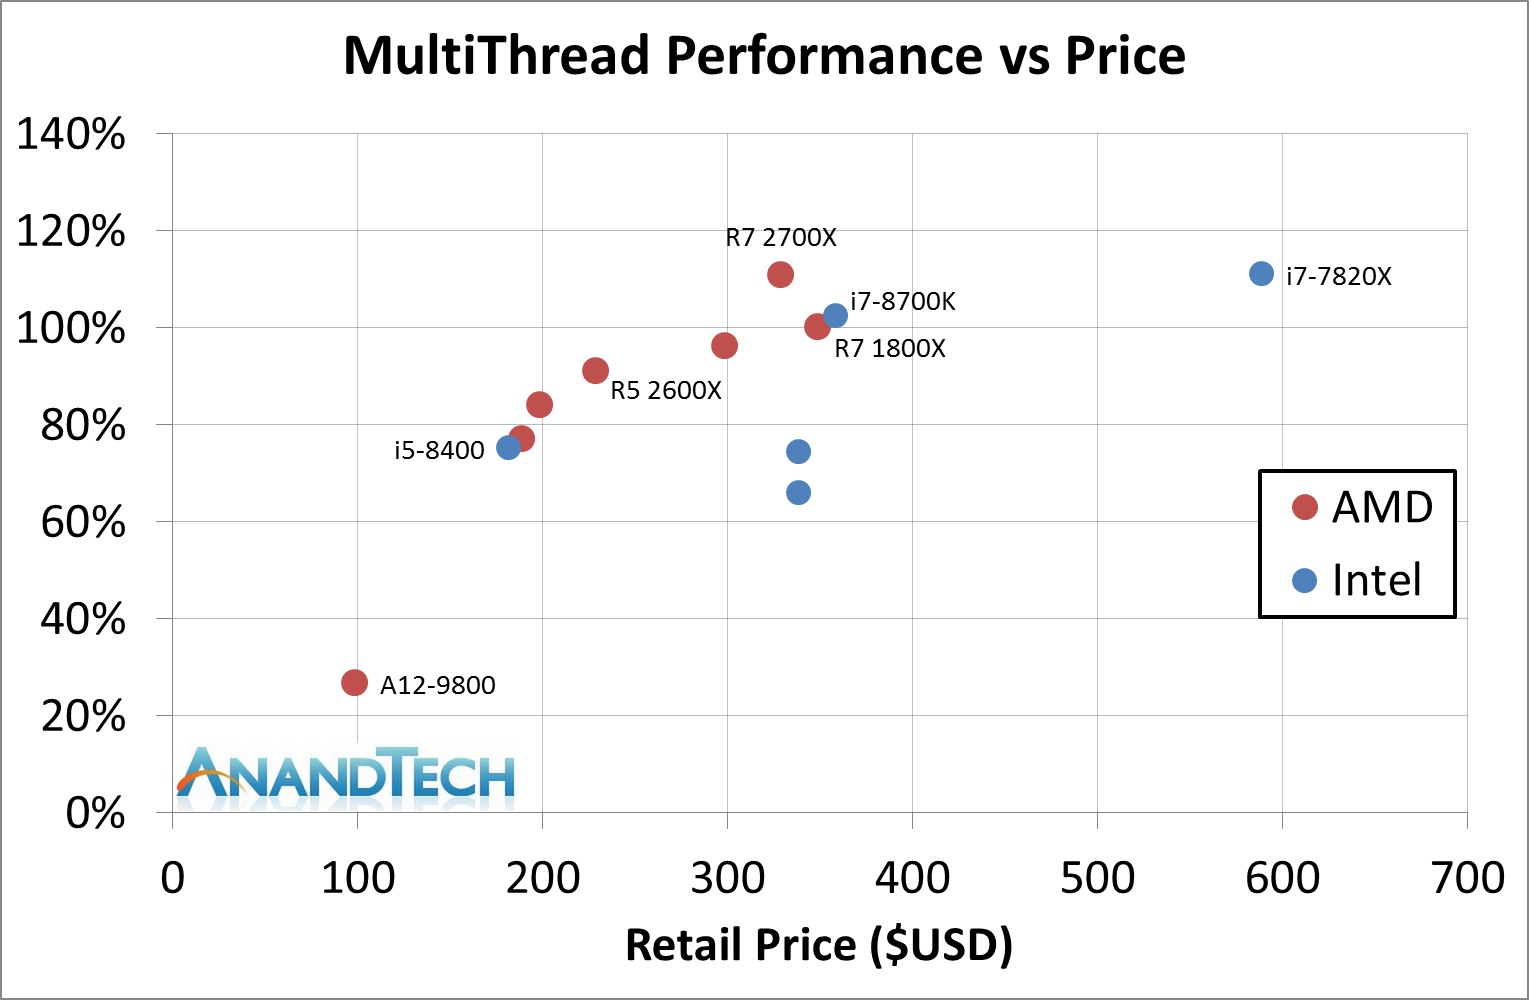
What we see here on the AMD side is that only the Ryzen 7 2700X eclipses the old Ryzen 7 1800X, with the 2700 close behind. In this price bracket, the higher thread count of the AMD chip gives it a healthy lead over the Coffee Lake i7-8700K, and it also eclipses the eight-core Skylake-X Core i7-7820X in most tests. What is very clear however is that the previous generation Intel parts, the i7-6700K and i7-7700K, sit very much behind the competition, and even behind AMD’s cheapest second generation Ryzen processor, the Ryzen 5 2600.
If someone had said a few years ago that AMD would design a second generation Ryzen processor in 2018 that would eclipse all of Intel’s Skylake and Kaby Lake processors, I would have laughed. But here we are, and it speaks to AMD’s execution. If a user wants a chip for a multi-threaded workload, the $199 Ryzen 5 2600 is the best budget performer on the market today.
In that mid-range price battle, the Ryzen 5 2600 also gives a swift kick to the Core i5-8400. It is a non-contest.
Overall Thoughts
You Win Some, You Lose Some, But Customers Win
When competition exists, each product needs to put its best foot forward. Tackling an incumbent is hard, with their existing relationships and high budgets, but forcing them to react is seen as a win for customers. A criticism levied at Intel in recent years is stagnation – minor process updates while waiting for a new process node; with so many eggs in the basket for future generation products, anything equally competitive can start to look attractive in the market. Those inside the industry can tell that while Intel is iterating on similar 14nm designs each year while waiting for 10nm to come to market, AMD is putting its best foot forward with Zen and Ryzen on 14nm, now with Ryzen 2 on GF 12nm.
Boiling down to simple recommendations this time around is actually going to be fairly easy.
Any users that would like high single threaded performance, or high performing 1080p gaming using a mid-range GPU, then Intel’s Core i5-8400 is going to fit the bill.
For hardcore enthusiasts, running high-end graphics at 4K or like getting their general compute on, the Ryzen 2000-series is looking the best choice. At each price point AMD can fit anyone’s 4K gaming needs and win in raw instruction throughput.
AMD also bundles a half-decent stock cooler in the box, something Intel has neglected in recent years, making the product even more attractive.


545 Comments
View All Comments
Flying Aardvark - Monday, April 23, 2018 - link
There's usually a lag from 6-12 months on any change that's already in place. Any topic really. Humans aren't very good at seeing what's in front of them. It requires enough people repeating it over and over around them, until they accept reality.Before that reassurance from society around them, they don't have the confidence to see/admit reality. Just something I've noticed. :)
mapesdhs - Monday, May 14, 2018 - link
That's why I like Goodkind's "1st Rule": people will believe a lie either because they want to believe it's true, or they're afraid it's true.Kaihekoa - Tuesday, April 24, 2018 - link
I don't know what reviews you read, but the WCCF review shows slight favor to 8700K in gaming. However, it's an incomplete review of gaming as they only test at 1440p Ultra, where the GPU bears most of the workload, and only show average framerate. Tech Report doesn't even go into any detail whatsoever on gaming and only broaches the topic in a couple paragraphs on the conclusion page. Still, they even show a lead to Intel. Anandtech shows the 2700X leading every game in framerate, which is flat out inaccurate when compared to other reviews.The Spectre BS has marginal, if any, impact on game performance. I don't know how you get the idea that CPU IO is related to loading textures in a game when textures are loaded into VRAM by the GPU. Looking further into the test setup, Anand uses slower RAM on Intel platforms, an ECC mobo for Z170, doesn't disclose GPU driver versions and uses an enterprise OS on consumer hardware. I'm guessing these and/or other factors contributed to the inaccurate numbers, relative to other reviewers, causing me to lose a lot of respect for this once well-regarded hardware reviewer. I'll get my benchmark numbers from PC Perspective and Gamers Nexus instead.
Not hating on AMD, and I even own stock in both AMD and Intel. They offer tremendous value at their price points, but I spend alot of money on my PC and use it for gaming, overclocking/benching, and basic tasks, which all seem better suited to Intel's IPC/clock speed advantage. I need reviews to post accurate numbers so that I can make my upgrade decisions, and this incomplete review with numbers not reflective of actual gaming performance fails to meet that need.
Flying Aardvark - Tuesday, April 24, 2018 - link
Come on man. I almost stop responding to replies like this. WCCF benches the base 2700, of course the 8700K wins, they don't include the 2700X. Again, the results line up with AT's. I wrote TR but meant TechRadar.Eh, I'm not going to keep going on addressing all these "points". IO is a syscall, reading/writing to disk is a syscall and that's where Intel takes up to a 50% perf hit with their Spectre v3 patches in place. This is known, and been known for months on the impact for games that do lots of texture steaming like ROTR. I even provided user provided evidence, that beat Anandtech here to the punch by 3 months.
Anand used Intel/AMD memory spec. That's what you're supposed to do when testing a product advertised to use certain components (for good reason, BTW, stupid gamer kids discounted).
Bottom line is that you and people flipping out just like you are wrong. I already knew about this being under the surface months ago. Now that it's impossible to cover it up with the 2000 series launch, more people are simply aware that AMD has taken over.
GreenMeters - Tuesday, April 24, 2018 - link
But Anandtech has the 2700, and even the 2600X and 2600, beating the 8700K. So how are the WCCF benchmarks lining up with Anandtech's?Maxiking - Tuesday, April 24, 2018 - link
"I just finished running Rise of the Tomb Raider benchmarks, 1080p, very high preset, FXAA.Unpatched:
Mountain Peak: 131.48 FPS (min: 81.19 max: 197.02)
Syria: 101.99 FPS (min: 62.73, max: 122.24)
Geothermal Valley: 98.93 FPS (min:76.48, max: 117.00)
Overall score: 111.31 FPS
Windows patch only:
Mountain Peak: 135.34 FPS (min: 38.21 max: 212.84)
Syria: 102.54 FPS (min: 44.22, max: 144.03)
Geothermal Valley: 96.36 FPS (min:41.35, max: 148.46)
Overall score: 111.93 FPS
Windows patch and BIOS update:
Mountain Peak: 134.01 FPS (min: 59.91 max: 216.16)
Syria: 101.68 FPS (min: 38.95, max: 143.44)
Geothermal Valley: 97.55 FPS (min:46.18, max: 143.97)
Overall score: 111.62 FPS
Average framerates don't seem affected."
From the link you posted, you got rekt by yourself.
Maxiking - Tuesday, April 24, 2018 - link
Actually, I can't bother waiting because, it's futile.The benchmark from that thread shows there has been no noticable performance regression after the updates had been applied.
I know what you gonna do. Look at those min fps. I WAS RIGHT. I WAS RIGHT. You are thinking right now. No, you weren't. If you ever had run TOR benchmarks, you would have experienced it. There are quite severe discrepancies in the inbuilt benchmark when comes to min/max fps. I noticed it myself when I was overclocking 6700k and running game benchmarks, stability tests. Since you are mostly using anecdotal evidence, you do not know how to make proper arguments, don't provide valid sources, we are really limited here, but that's what we have.
To support my statement, here is the video:
https://www.youtube.com/watch?v=BZEhkcs9hpU
It is not mine, but it is proving my point, there is an issue in the benchmark. It shows wrong/misleading min/max fps pretty often which other benchmarking solutions doesn't record.
The video was published on 7 Jul 2016, so no meltdown/spectre for you. I know you will argue it is no coincidence with those min fps, but look at the max as well.
Maxiking - Tuesday, April 24, 2018 - link
*solutionFlying Aardvark - Wednesday, April 25, 2018 - link
Are you retarded? I know you are because I ran those benchmarks myself and it's reproducible on more games than ROTR. Where's your contradicting information to back your claim, you do know that trying to poke holes in info is not an argument.Ranger1065 - Wednesday, April 25, 2018 - link
So sad the review failed to meet your expectations. Enjoy your time at Gamer's Nexus (cough).