Meltdown & Spectre: Analyzing Performance Impacts on Intel's NUC7i7BNH
by Ganesh T S on March 23, 2018 4:15 PM EST- Posted in
- Systems
- Spectre
- Benchmarks
- Meltdown
BAPCo and Futuremark Benchmarks
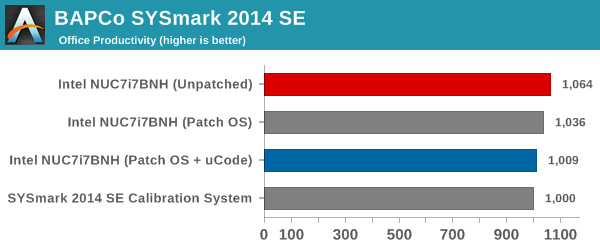
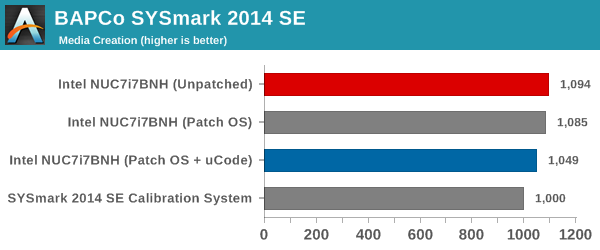
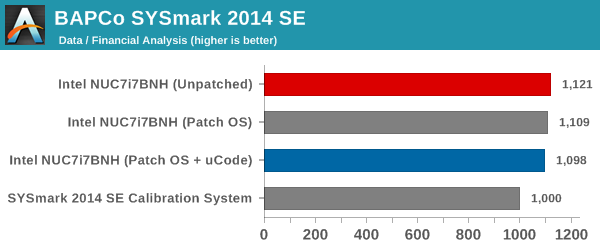
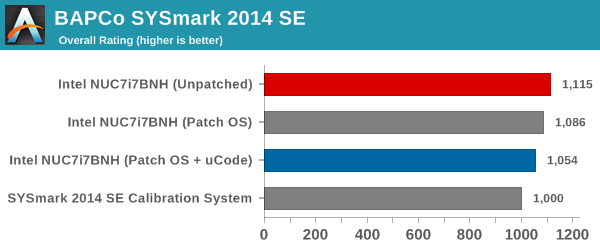
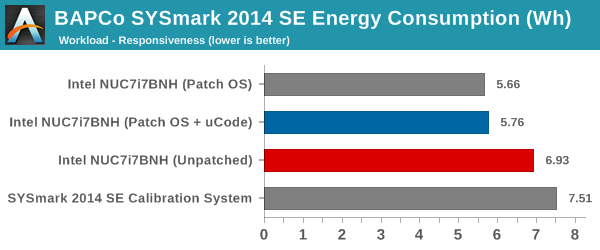
BAPCo's SYSmark 2014 SE is an application-based benchmark that uses real-world applications to replay usage patterns of business users in the areas of office productivity, media creation and data/financial analysis. In addition, it also addresses the responsiveness aspect which deals with user experience as related to application and file launches, multi-tasking etc. Scores are meant to be compared against a reference desktop (the SYSmark 2014 SE calibration system in the graphs below). While the SYSmark 2014 benchmark used a Haswell-based desktop configuration, the SYSmark 2014 SE makes the move to a Lenovo ThinkCenter M800 (Intel Core i3-6100, 4GB RAM and a 256GB SATA SSD). The calibration system scores 1000 in each of the scenarios. A score of, say, 2000, would imply that the system under test is twice as fast as the reference system.
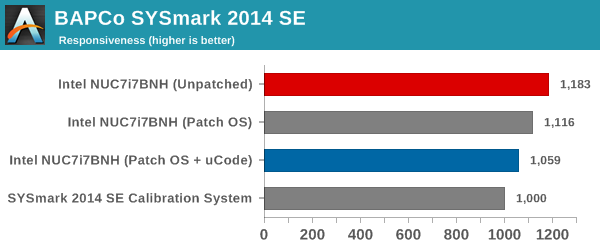
We see that the patching does have an impact on the performance. It ranges from around 5% for the Office Productivity scenario to around 10% for the Responsiveness metric.
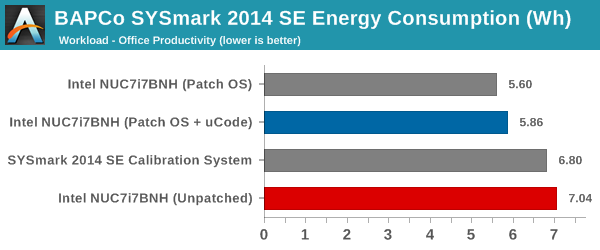
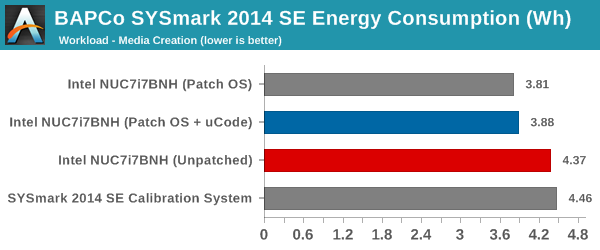
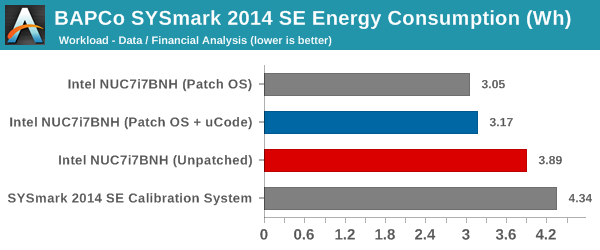
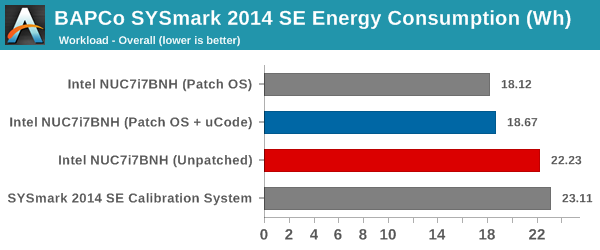
SYSmark 2014 SE also adds energy measurement to the mix. We see that the patched system, despite being slower, consumes lower energy for the completion of the tasks.
Futuremark PCMark 10
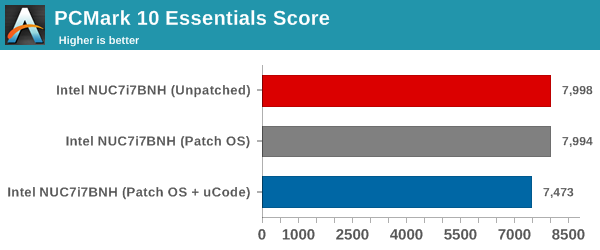
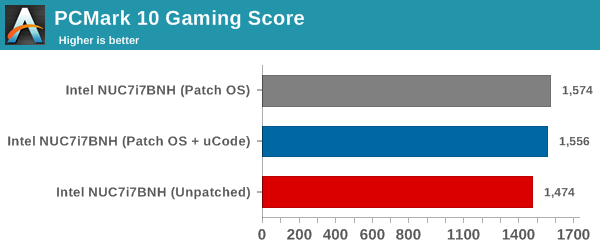
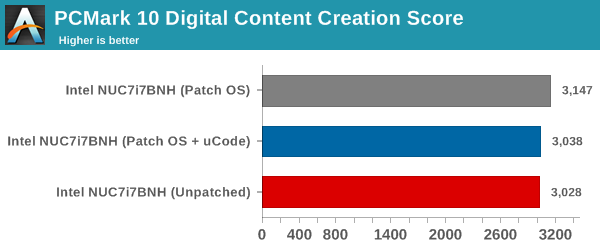
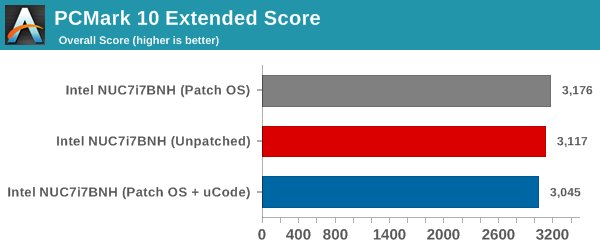
UL's PCMark 10 evaluates computing systems for various usage scenarios (generic / essential tasks such as web browsing and starting up applications, productivity tasks such as editing spreadsheets and documents, gaming, and digital content creation). We benchmarked the configurations with the PCMark 10 Extended profile and recorded the scores for various scenarios. These scores are heavily influenced by the CPU and GPU in the system, though the RAM and storage device also play a part. The power plan was set to Balanced for all the PCs while processing the PCMark 10 benchmark.
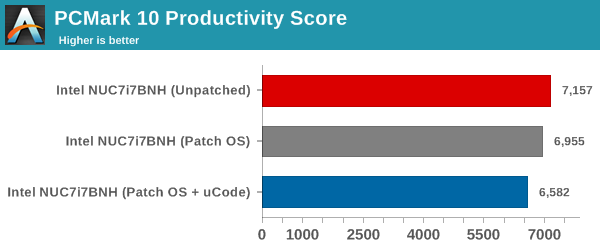
Similar to SYSmark 2014 SE, we see performance impacts in all the PCMark 10 scenarios also. For example, the Essentials workload score for the fully patched system is around 6.5% lower than the unpatched system. The gaming workload doesn't seem to be affected much by the patching, though. The overall score is around 2.3% lower.
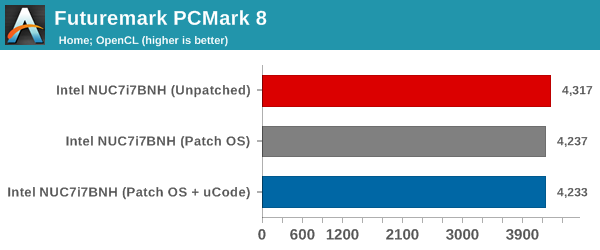
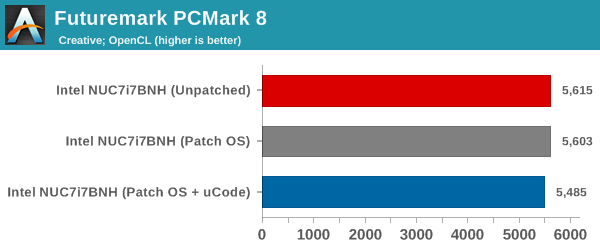
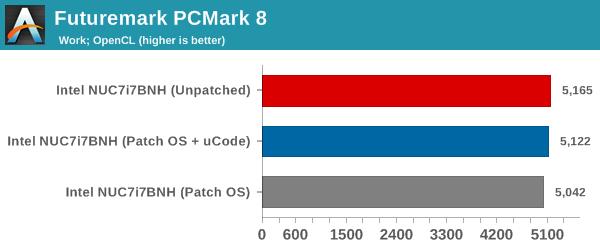
Futuremark PCMark 8
We continue to present PCMark 8 benchmark results (as those have more comparison points) while our PCMark 10 scores database for systems grows in size. PCMark 8 provides various usage scenarios (home, creative and work) and offers ways to benchmark both baseline (CPU-only) as well as OpenCL accelerated (CPU + GPU) performance. We benchmarked select PCs for the OpenCL accelerated performance in all three usage scenarios. Since these scores are heavily influenced by the CPU in the system, it is not surprising to see a performance impact. The patched configuration, on average, scores around 2% lower than the unpatched one.
Miscellaneous Futuremark Benchmarks
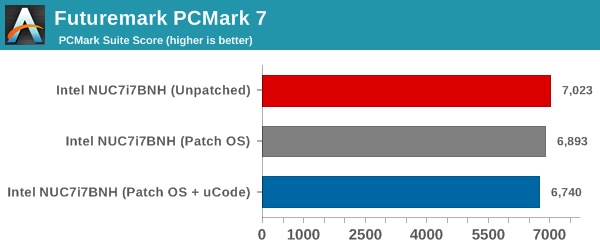
PCMark 7's PCMark Suite shows a 4% performance loss.
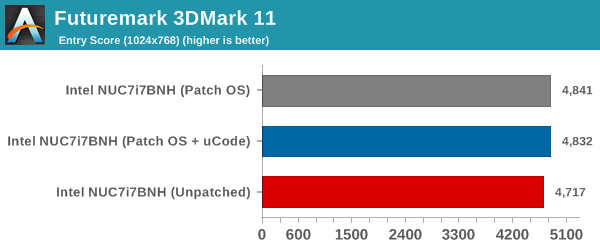
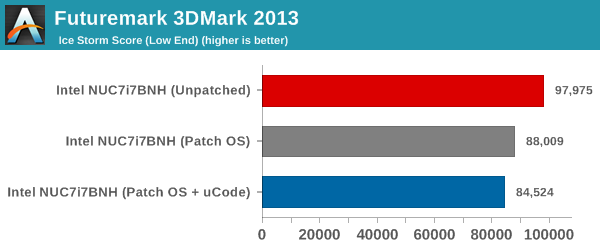
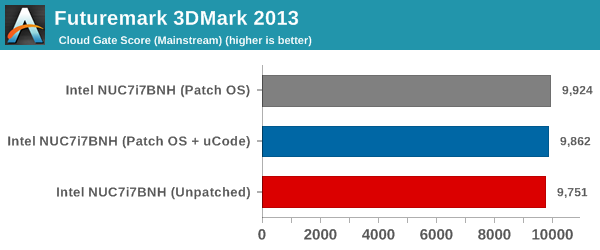
3DMark 11's entry level score and 3DMark 2013's Cloud Gate score actually end up better after the patch, but, 3DMark 2013's Ice Storm score shows a performance loss of more than 13%.
Futuremark PCMark 8 Storage Bench
PCMark 8 has a storage bench where certain common workloads such as loading games and document processing are replayed on the target drive. Results are presented in two forms, one being a benchmark number and the other, a bandwidth figure. We ran the PCMark 8 storage bench on the ADATA NVMe SSD in all the configurations.
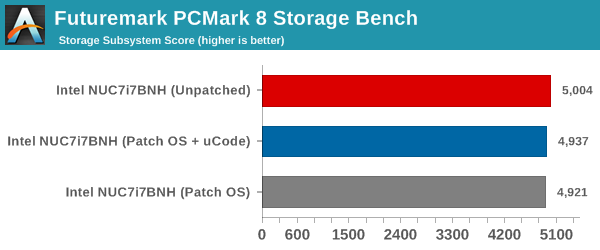
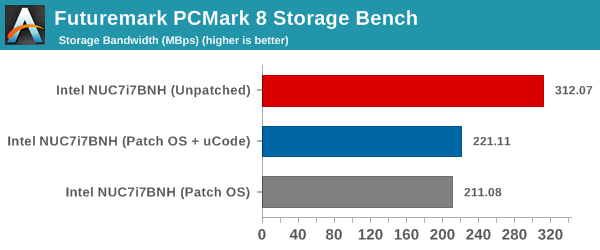
While the absolute score is just around 1.3% lower for the patched configuration, the storage bandwidth is around 29% worse. This significant performance loss is partly due to the NVMe drive performance now being CPU bound. It is highly likely that SATA drives will not experience such a drastic performance loss due to the patching.


83 Comments
View All Comments
boeush - Friday, March 23, 2018 - link
Speculative execution uses up compute cycles and can cause excessive memory loads and cache thrashing - which amount to wasted power and in some cache-sensitive cases, possibly even a drop in performance - when the speculation is frequently-enough incorrect (i.e. when the actual branch taken doesn't match the CPU's guess.)I'd expect that disabling speculative execution under high load (e.g. benchmarking scenarios) should normally result in improved power efficiency (avoiding wasted computation and I/O) - but at the cost of raw compute performance. In less intense, more 'bursty' scenarios, where the CPU spends a lot of time in an idle state, the "hurry up and rest" dynamic might strongly reduce the overall power waste of speculative execution, as the CPU would spend less time in an active-but-stalled state while spending more time in a sleep state...
Cravenmor - Friday, March 23, 2018 - link
The thing that caught my eye was the reduction in power from the patches. I wonder what to deduct from speculative function and whether it's inefficient.Lord of the Bored - Saturday, March 24, 2018 - link
Speculative execution does add somewhat to the power load. That's why Atom parts were in-order for a long time, and many ARM parts still are.Cravenmor - Friday, March 23, 2018 - link
willis936 beat to it by a noseeva02langley - Friday, March 23, 2018 - link
It is interesting nonetheless. The storage data is absolutely devastating. Can we make conclusions to the server world from Intel? I don't know since servers are still using hard drives. However, it might force companies to switch to Epyc or to upgrade to Canon Lake. It would be interesting.boeush - Friday, March 23, 2018 - link
The CPU used in these tests was a low-power 2-core - pretty weak to begin with. Knock some performance off the top, and you have detectable impact on I/O.Probably the impact would be much less severe with a more powerful CPU: where the test scenario would again 'flip' from CPU-bound to bus/storage device performance- limited.
Reflex - Friday, March 23, 2018 - link
Also, servers are usually only using NVMe drives as cache, SAS is less likely to have significant impact.Drazick - Friday, March 23, 2018 - link
This is a great analysis.We'd be happy to have more like this (On various performance impacting situations).
I'd be happy to have a guide how to prevent the patching for each OS (Windows, macOS, Linux) as the private user mostly has no reason to be afraid of those.
Thank You!
ZolaIII - Friday, March 23, 2018 - link
I found this comparation much more interesting.https://www.phoronix.com/scan.php?page=article&...
It's done on much more capable system which whose more hit in the first place & at least some benchmarks are representative in real usage workloads. Seams M$ again did a bad job & chubby Linus is still not satisfied with up to date results so future work still carries on.
Klimax - Sunday, March 25, 2018 - link
Not really correct...