The Samsung Galaxy S9 and S9+ Review: Exynos and Snapdragon at 960fps
by Andrei Frumusanu on March 26, 2018 10:00 AM ESTBattery Life - A Stark Contrast
We extensively covered the performance of the Snapdragon and Exynos Galaxy S9’s – what remains to be seen is how that performance affects battery life in our standard tests. Performance between the regular and larger Galaxy S9 doesn’t change, however battery life may differ based on the variant as the regular S9 sports a 3000mAh (11.55Wh) battery versus the 16% higher 3500mAh (13.47Wh) of the Galaxy S9+. Naturally the 14.2% bigger screen area of the S9+ offsets some of that advantage.
Unfortunately for this review we couldn’t get identical variants of the different SoC Galaxy S9s – our S9+ is a Snapdragon 845 unit while our S9 is an Exynos 9810 unit, so we weren’t able to execute a true apples-to-apples comparisons between the SoC variant, however as we’ll see the delta between the units is large enough that it won’t change the conclusion.
Our web browsing test tries to mimic real-world usage patterns of browsing websites. This includes iterating through a list of websites and scrolling through them. In this test, screen efficiency and battery size play a role, but also we balanced it so that it also sufficiently stresses the SoC (CPU, GPU and display pipeline) as well.
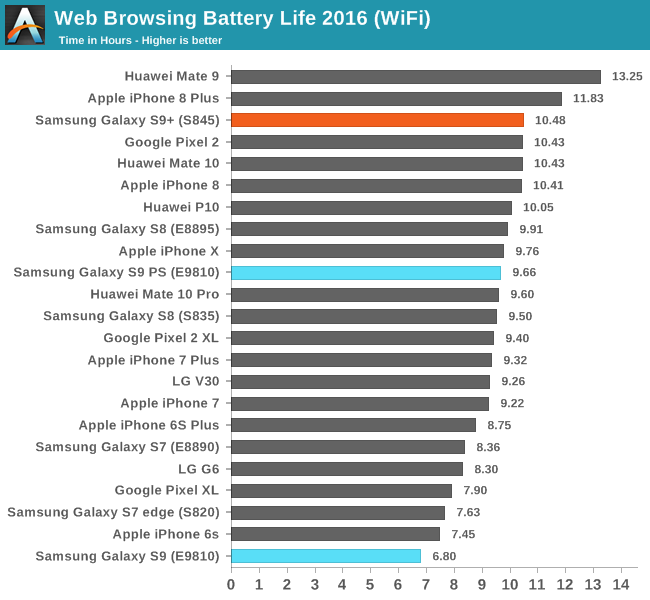
The Snapdragon 845 Galaxy S9+ posted excellent battery life in our test and lands only third to the iPhone 8 Plus and the Mate 9. Unfortunately we never tested the S8+ to see the generational difference, but it shouldn’t be too different from the S835 regular S8 at around the 10 hour mark.
The Exynos 9810 Galaxy S9 absolutely fell flat on its face in this test and posted the worst results among our tracking of the latest generation devices, lasting 3 hours less than the Exynos 8895 Galaxy S8. This was such a terrible run that I redid the test and still resulted in the same runtime.
I investigated the matter further to try to see if this was caused by the high energy usage of the M3 cores – and it seems it is. Enabling the “CPU limiter” (S9 PS result in the graphs) which is found in the battery optimisation options of Samsung’s firmware greatly throttles the M3 cores down to 1469 MHz, memory controller to half speed and also seemingly changes some scheduler settings to make them more conservative. This results in peak performance equal to the Exynos 8895- however the scheduler alterations also noticeably slow down UI responsiveness so it’s actually a worse experience. Nevertheless, backing off on performance results in regaining almost 3 hours.
This is such a terrible battery performance of the Exynos 9810 variant that it again puts even more clout into the new SoC. My theory as to why this happens is that not only do the higher frequency state require more energy per work done than competing SoCs – because this is a big CPU complex there’s also lots of leakage at play. The DVFS system being so slow might actually be bad for energy here as we might be seeing the opposite of race-to-sleep, walk-to-waste. The fact that Apple’s SoCs don’t have any issues with battery life in this test showcases that it’s not an inherent problem of having a high-power micro-architecture, but rather something specific to the Exynos 9810.
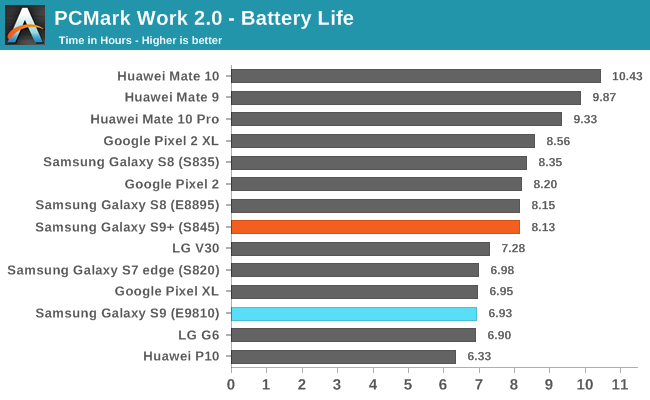
In PCMark the disadvantage of the Exynos 9810 S9 isn’t as pronounced as in the web test, however it’s again a regression to the Exynos 8895 S8 – all while not posting a meaningful performance advantage over its predecessor that might explain the lower battery life.
The Snapdragon 845 Galaxy S9+ fared relatively well, even though it’s not quite as good as other devices.
In my personal every-day usage I can’t saw that I noticed a massive disadvantage in battery life on the Galaxy S9, however my everyday usage is relatively light and I haven’t had enough time with the phone yet as a daily driver to make a final judgment. I did notice that the Exynos 9810 does shows signs of suffering in heavy tasks. Instances of Gmail syncing my inbox with a new account did once result in a warm phone while the Snapdragon 845 Galaxy S9 did not showcase this characteristic.
I can’t fault the Snapdragon S9+ in the time I had it, but again I haven’t had enough real time with it to really judge it subjectively. As far as AnandTech testing goes, the data speaks for itself and based on what I’ve seen I strongly do not recommend the Exynos variant of the Galaxy S9 in its current state, especially if you’re a regular user of heavy apps.
Over the coming weeks I’m planning to try to dive into the workings of the Exynos 9810 and post a follow-up article on whether it’s possible to improve both in terms of performance as well as battery life if one changes the way the SoC’s scheduler and DVFS works. In the eventuality that Samsung updates its firmware to resolve these large issues with the Exynos Galaxies, then we’ll revisit the matter as soon as possible.


190 Comments
View All Comments
goatfajitas - Thursday, March 29, 2018 - link
That is simply incorrect. Not even remotely close to being correct.Dr. Swag - Monday, March 26, 2018 - link
The graphs on the spec page are kinda confusing me. Are the bars on the right side the performance? Oh the left side, are the numbers indicating average power and the bars the total power? You might want to make that a bit more clear, since it took me a while to figure out.tuxRoller - Monday, March 26, 2018 - link
He states that the left axis has two numbers (average power & total energy used), and given the title is the graph (spec) the right axis must be the score achieved. If you look at the bottom of the graphs it has two arrows that point in opposite directions that say something like lower is better (for left axis) and higher is better (for right axis).jospoortvliet - Tuesday, March 27, 2018 - link
See bottom of the graph. Left is power used, right is performance achieved for that older. There is a trade off, as seen in the later run with power saving on: performance for Samsung drops to 2016/2017 level but power usage for the task (and thus efficiency) is ahead of everyone. Andrei attempted to calculate between this and full power what the efficiency would be when the Samsung SOC was tuned to perform like the Qualcomm and estimated a gap of 4-8%. Not too bad but all of it overshadowed by the horrible DFS setting which kills day to day performance.tuxRoller - Tuesday, March 27, 2018 - link
He actually says that if you extrapolate the efficiency in PS to match the perf is the sd845 you'd still see the efficiency (of the 9810) lagging.I'd be interested in seeing the efficiency of the sd845 if you reduced it's perf to those of the 9810 when running in PS.
lilmoe - Wednesday, March 28, 2018 - link
Efficiency @max load =/= @average workload. This isn't a workstation chip.tuxRoller - Wednesday, March 28, 2018 - link
Obviously, that's the whole point.What I'm speaking of is extrapolated efficiency in BOTH directions. We've seen the exynos perf/Joule with both the default governor and the power saving governor. What we haven't seen is the something similar for the 845. It too is going to have it's highest efficiency somewhere towards the middle of its OPPs.
Iow, it would be nice to have the perf/Joule curve over the various OPPs for both of these chips.
halcyon - Monday, March 26, 2018 - link
Lorem ipsum dolor sit amet, consectetur adipiscing elit, sedthat's in the "Video evaluation" section
Great review! the kind I expect from Anandtech.
Andrei Frumusanu - Monday, March 26, 2018 - link
Had forgotten to replace those paragraphs, fixed.Ian Cutress - Monday, March 26, 2018 - link
Fixed :)