The Snapdragon 845 Performance Preview: Setting the Stage for Flagship Android 2018
by Ryan Smith & Andrei Frumusanu on February 12, 2018 12:30 AM EST- Posted in
- Mobile
- Snapdragon
- Qualcomm
- Smartphones
- SoCs
- Snapdragon 845
GPU Performance & Power Estimates
One of the larger changes that the Snapdragon 845 brings with itself is a new GPU architecture. Qualcomm has been traditionally very secretive when talking about details of their Adreno GPUs and the Adreno 630 is no different here. Truth to be told, the only real sign that we’re looking at more major architectural changes is the transition from the Adreno 5xx series to the Adreno 6xx series.
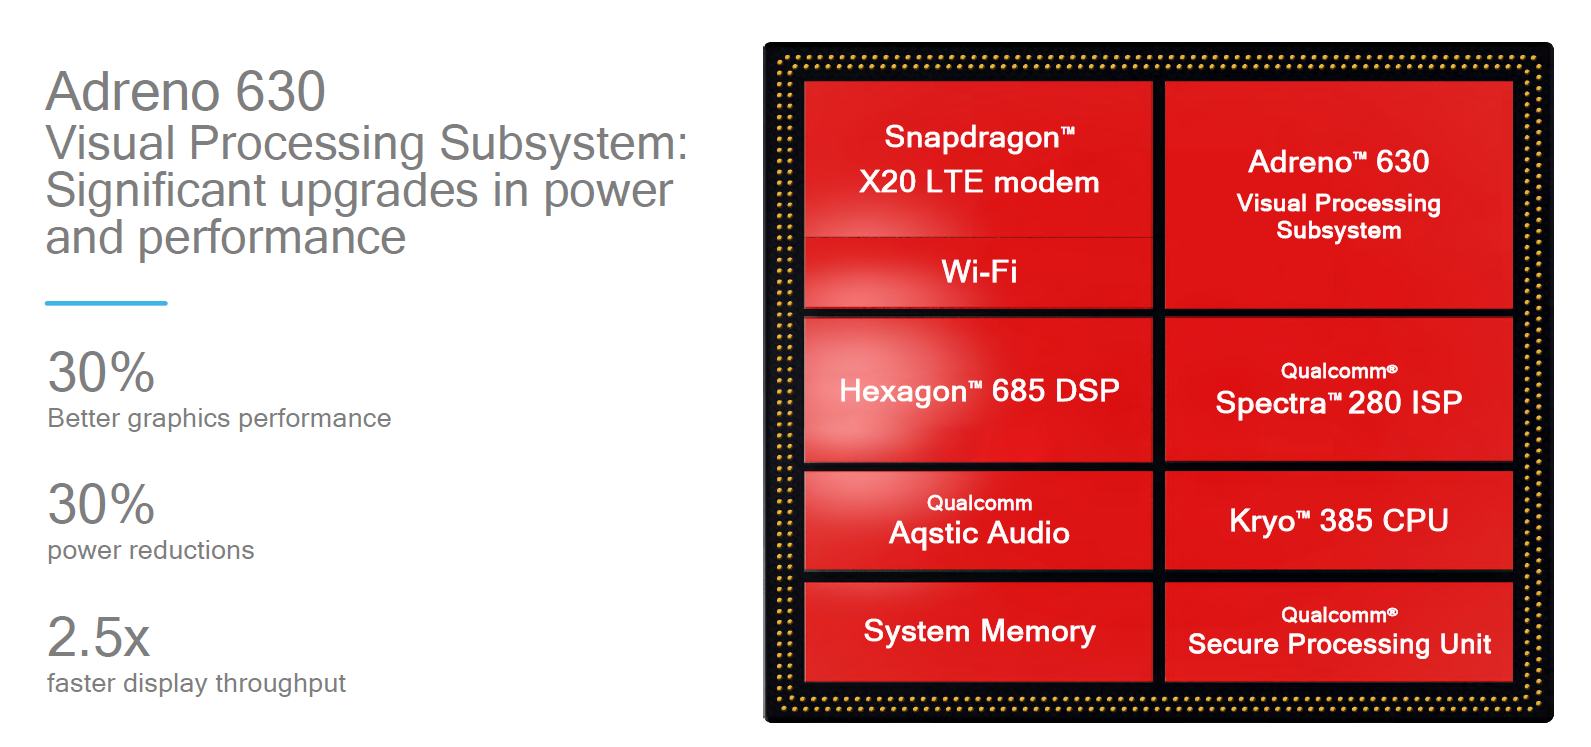
While the Adreno 630 remains largely a black box we do know what Qualcomm’s claims for the GPU are. We’re looking at overall 30% better performance and a 30% improvement in power. The latter point is something that Qualcomm liked to showcase both at the announcement of the Snapdragon 845 as well as for this benchmarking event, however it needs to be clarified that the power improvement is measured at iso-performance levels. Naturally because the 845 targets higher performance points the power would be higher than at 835-levels of performance. Regardless of this marketing nit-pick, we’re still expecting an efficiency increase at peak performance levels if the resulting absolute power remains at the same levels as the Snapdragon 835.
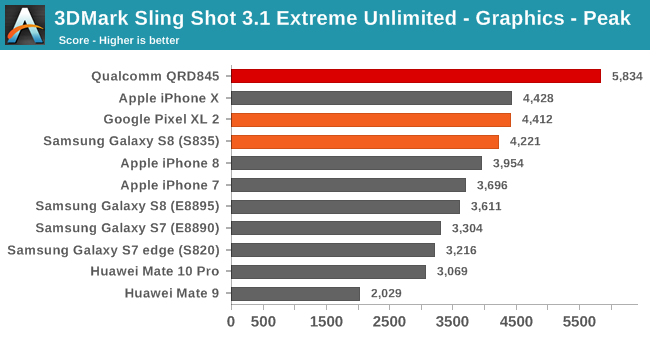
We start off with Futuremark’s 3DMark Sling Shot 3.1 Extreme Unlimited test. The graphics test mainly showcases the GPU improvements of a system and here the Snapdragon 845 easily reaches its performance target, improving by up to 32% compared to the Snapdragon 835 powered Pixel 2 XL and Galaxy S8. This is an astonishingly great achievement for Qualcomm in one generation.
When we’re looking at competitor devices we see only the the iPhone X able to compete with the last generation Snapdragon 835 devices – however with a catch. The A11 is severely thermally constrained and is only able to achieve these scores when the devices are cold. Indeed as seen from the smaller score of the iPhone 8, the SoC isn’t able to sustain maximum performance for even one benchmark run before having to throttle. Unfortunately this also applies to current and last generation Exynos and Kirin SoCs as both shed great amount of performance after only a few minutes. I’ve addressed this issue and made a great rant about it in our review of the Kirin 970. For this reason going forward AnandTech is going to distinguish between Peak and Sustained scores across all 3D benchmarks. This however needs to be tested on commercial devices as the QRD platform isn’t a thermally representative phone for the SoC, so until that happens, we’ll have to just estimate based on power consumption where the Snapdragon 845 ends up.
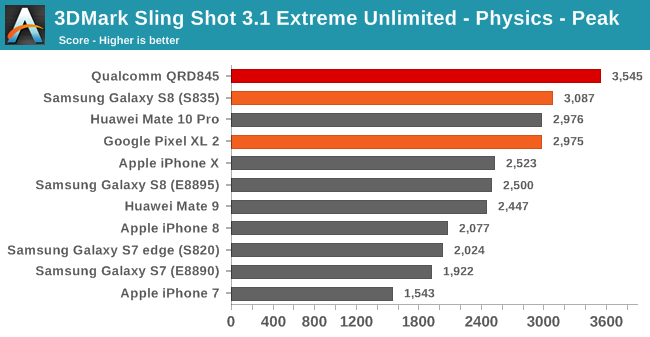
The physics score is a CPU-bound test and less limited by the GPU. Here the Snapdragon 845 provides a good improvement over the Snapdragon 835 however to a meagre 14% increase which incidentally matches the clock frequency increase between the 845 and 835’s performance CPUs.
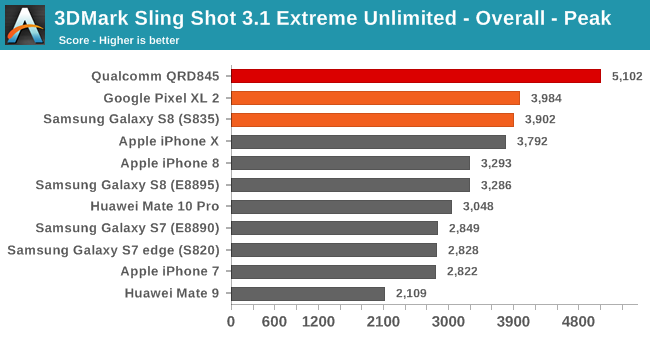
Overall the QRD845 platform leads the Sling Shot Extreme rankings by a comfortable margin.
Moving on to GFXBench I decided to focus on T-Rex and Manhattan 3.1 as both tests stress different aspects of the GPU, fill-rate and texturing bound workloads versus more arithmetic bound workloads.
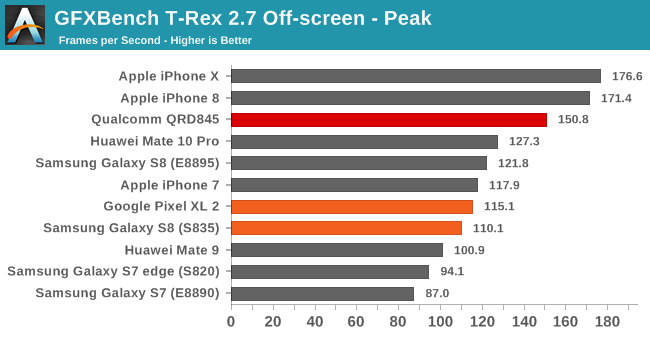
In T-Rex the Snapdragon 845 again shows an impressive 31% increase over the Snapdragon 835. This time around it’s not enough to quite match the Apple A11 but I expect that situation to quickly reverse as the latter becomes thermally constrained.
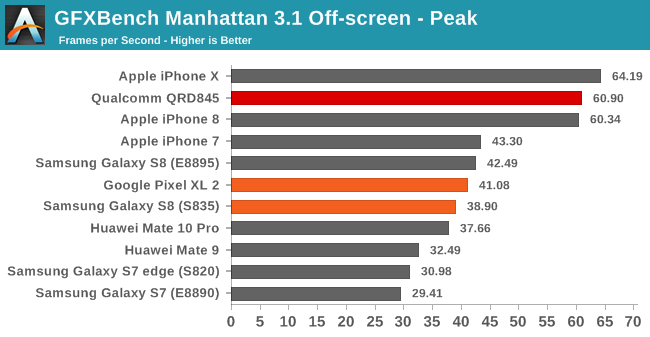
Manhattan 3.1 is more shader and compute heavy and thus puts more stress on the ALU pipelines of the GPU. Here the Adreno 630 outpaces the Adreno 540 by an ever impressive 48%. Again the A11 matches the performance here but with a device becoming very hot quite fast while the QRD845 was merely luke-warm in our preview benchmarking session.
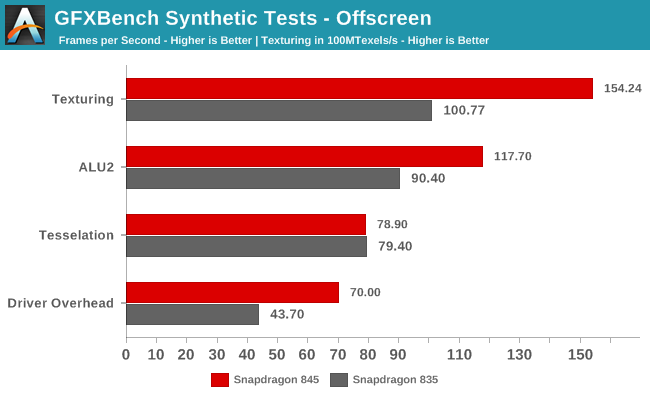
GFXBench’s synthetic micro-tests should shed more light on the architectural improvements of the Adreno 640. Indeed looking at the results we see that the Snapdragon 845 is able to achieve an over 50% increase in the texturing test to an unmatched 15400MTexels/s. Qualcomm’s claims of 2.5x faster display throughput more than likely involves also vastly increased pixel fillrate capabilities on the side of the GPU so the architecture must have increased the number of ROPs and texturing units to get to such scores.
The ALU2 test shows a 30% increase in performance over the Snapdragon 845, however the fact that Manhattan 3.1’s score increased by up to 48% means that we’re likely seeing a more fundamental change in the ALU pipelines that lead to better utilisation ratio.
The tessellation results point out that the geometry pipelines haven’t received any large improvements. One fact-check that we unfortunately weren’t able to verify is the clock frequency of the Adreno 640. The fact that the tessellation test ends up in spitting distance of the Adreno 630 means that we’re very likely looking at clocks very similar to the Adreno 630 – in the 670 to 710MHz range.
Finally the driver overhead score shows both the increased raw CPU performance of the Snapdragon 845 as well as maybe an improvement in Qualcomm’s drivers.
As beforementioned, going forward we’re going to have a more heavy focus on GPU sustained performance as well as power. During the benchmarking session we were able to probe the QRD845 for power as measured by the fuel gauge by the PMIC. We must however note that these platforms aren’t usually power optimised and have early silicon bins – Qualcomm themselves don’t advise them for power measurements. Nevertheless curiosity got the best of us and the following estimated figures should be seen as worst-case scenarios for the Snapdragon 845.
| GFXBench Manhattan 3.1 Offscreen Power Efficiency (System Active Power) |
||||
| Mfc. Process | FPS | Avg. Power (W) |
Perf/W Efficiency |
|
| Qualcomm QRD (Snapdragon 845) | 10LPP | 60.90 | ~4.38 | 13.90 fps/W |
| Galaxy S8 (Snapdragon 835) | 10LPE | 38.90 | 3.79 | 10.26 fps/W |
| LeEco Le Pro3 (Snapdragon 821) | 14LPP | 33.04 | 4.18 | 7.90 fps/W |
| Galaxy S7 (Snapdragon 820) | 14LPP | 30.98 | 3.98 | 7.78 fps/W |
| Huawei Mate 10 (Kirin 970) | 10FF | 37.66 | 6.33 | 5.94 fps/W |
| Galaxy S8 (Exynos 8895) | 10LPE | 42.49 | 7.35 | 5.78 fps/W |
| Galaxy S7 (Exynos 8890) | 14LPP | 29.41 | 5.95 | 4.94 fps/W |
| Meizu PRO 5 (Exynos 7420) | 14LPE | 14.45 | 3.47 | 4.16 fps/W |
| Nexus 6P (Snapdragon 810 v2.1) | 20Soc | 21.94 | 5.44 | 4.03 fps/W |
| Huawei Mate 8 (Kirin 950) | 16FF+ | 10.37 | 2.75 | 3.77 fps/W |
| Huawei Mate 9 (Kirin 960) | 16FFC | 32.49 | 8.63 | 3.77 fps/W |
| Huawei P9 (Kirin 955) | 16FF+ | 10.59 | 2.98 | 3.55 fps/W |
For Manhattan 3.1 the Snapdragon 845 had an active system power figure (Idle power subtracted from total platform power) of 4.38W. The excellent performance figure of the Adreno 630 alongside the reasonable power consumption puts the Snapdragon 845 well ahead at the top of our efficiency table, improving by up to 35% compared to the S835 Galaxy S8, with three generations of Adreno based SoC outmatching the latest ARM solutions. We’re aware of the demand for power figures on Apple’s latest SoCs but sadly we can’t tear down our review devices for battery power measurements and working on a solution. Given the A11’s thermal characteristics I’m expecting power usages more in line with the Exynos 8895 and Kirin 970 than the Snapdragon SoCs.
| GFXBench T-Rex Offscreen Power Efficiency (System Active Power) |
||||
| Mfc. Process | FPS | Avg. Power (W) |
Perf/W Efficiency |
|
| Qualcomm QRD (Snapdragon 845) | 10LPP | 150.80 | ~4.02 | 37.51 fps/W |
| Galaxy S8 (Snapdragon 835) | 10LPE | 108.20 | 3.45 | 31.31 fps/W |
| LeEco Le Pro3 (Snapdragon 821) | 14LPP | 94.97 | 3.91 | 24.26 fps/W |
| Galaxy S7 (Snapdragon 820) | 14LPP | 90.59 | 4.18 | 21.67 fps/W |
| Galaxy S8 (Exynos 8895) | 10LPE | 121.00 | 5.86 | 20.65 fps/W |
| Galaxy S7 (Exynos 8890) | 14LPP | 87.00 | 4.70 | 18.51 fps/W |
| Huawei Mate 10 (Kirin 970) | 10FF | 127.25 | 7.93 | 16.04 fps/W |
| Meizu PRO 5 (Exynos 7420) | 14LPE | 55.67 | 3.83 | 14.54 fps/W |
| Nexus 6P (Snapdragon 810 v2.1) | 20Soc | 58.97 | 4.70 | 12.54 fps/W |
| Huawei Mate 8 (Kirin 950) | 16FF+ | 41.69 | 3.58 | 11.64 fps/W |
| Huawei P9 (Kirin 955) | 16FF+ | 40.42 | 3.68 | 10.98 fps/W |
| Huawei Mate 9 (Kirin 960) | 16FFC | 99.16 | 9.51 | 10.42 fps/W |
T-Rex stresses the GPU differently and we see slightly lower power consumption compared to Manhattan 3.1 ending up at 4W and showcasing an efficiency increase of 20% over the Snapdragon 835, again pointing towards more tangible changes in the ALU pipelines of the new architecture.
Overall the Adreno 630 more than delivers as it’s able to double-down on the Adreno 540’s efficiency advantage. Qualcomm current generations of SoCs are simply unmatched and the gap is so wide that I do not expect upcoming rival solutions to be able to catch up this year.


140 Comments
View All Comments
BenSkywalker - Monday, February 12, 2018 - link
Legal studies I am lacking, you are correct, alas you can't keep out of the press how much trouble QC is in for their practices-https://www.forbes.com/sites/greatspeculations/201...
China fined them for a billion already, Korea for $850 Million, Taiwan for another $750 Million- US suit is in progress.
Andrei Frumusanu - Monday, February 12, 2018 - link
No I'm comparing the same methodology on the devices, active system power. The Shield TV on the X1 does 12W at 61fps. The QRD845 did 82fps at 4.4W.Nowhere in this article nor from Qualcomm is there the pure GPU power figure published, but always the system power. Your Nvidia figure is running at half performance meaning up to a 3x higher efficiency point. The GPU at full power is at 5-6W and that's why the Shield and Switch need an active fan to cool them.
The gap is not closed by process normalisation.
BenSkywalker - Monday, February 12, 2018 - link
Samsung says the gap is entirely closed by process normalisation alone(20nm<35%14nm<,40%10nmLPE<15%10nm LPE) , their claims- but hey, they just actually make the chips. What do the people who run the 10nm fab know compared to you, right?Three years later, they have a competitive part, you want to consider that a QC win, well, you are clearly their target customer. Spend more on lawyers, less on engineers :)
mfaisalkemal - Monday, February 12, 2018 - link
after calculate with samsung process normalisation, nvidia still have a gap around 20% worse than qualcomm on gfxbench 3.0 manhattan.Nvidia tegra x1 : 12W * 0.3315 = 3.978 W (Normalize from 20nm to 10nm)
61FPS @ 3.978W -->15.33FPS/W
Adreno 640
82FPS @ 4.4W --> 18.63FPS/W
mfaisalkemal - Monday, February 12, 2018 - link
i mean adreno 630 lolBenSkywalker - Monday, February 12, 2018 - link
Could you provide some links? Seems odd that the Adreno 640 uses the exact same wattage on two different benches.Also- your wattage consumption assumption negates the earlier link I provided showing a massive efficiency gain in terms of performance/watt once you moved away from nearing thermal limits. Either you would be able to clock the part higher at the same power level(reduced leakage, better matching of optimal power usage for the die etc) or you would use less power- not to mention you would no longer be using active cooling for something that low power(again reducing power draw).
That would assume, of course, that no other improvement was possible in the last *THREE YEARS* since we saw this level of performance.
BTW- We could also ask things like why is tessellation performance still *half* of a three year old SoC, but that would imply that Qualcomm actually cared about moving forward with technology.
mfaisalkemal - Monday, February 12, 2018 - link
that data was from Andrei Frumusanu comment, and i think he test it but not published. yup your're right nvidia better on tesselation offscreen test, but adreno 630 better on texturing offscreen(15424mtexel/s vs 13427mtexel/s) and i guess gfxbenchmark car chase test(tesselation test) adreno 630 better than tegra x1 although the tesselation offscreen worse.your link provided why so low wattage(1.51W) i think because nvidia only estimate gpu power without ram power, in this article andrei and ryan estimate system power(device substract idle power like display etc.
Kvaern1 - Tuesday, February 13, 2018 - link
I'd be much more disappointed with NVidia if Qualcomm could make GPUs as well as them.Now, if only NVidia could make a competitive CPU.
Eximorph - Tuesday, February 13, 2018 - link
I have the shield tv, shield k1 and an lg g5 ( tegra x1, tegra k1 and adreno 530) let me tell you that the tegra x1 is powerful but let's be honest. First The tegra x1 is connected to a power sources, second the tegra x1 is on max performance mode at all time, 3rd it have fans and 4th lets go to the specs, 256 cores at 1000 mhz vs 256 cores at 624 mhz on the adreno 530 we are talking about 376 mhz more per core for the tegra x1 over the adreno 530, screen resolution 1080 vs 2k. Now lets under clock the x1 to a 624 mhz and let put a 2k resolution screen and let see whats happen ? The result with just a 2k screen is the next one, Manhattan 3.0 offscreen, google pixel c 46 fps adreno 530 46 fps. So the true here is that Qualcomm is a beast on the gpu side and nvidia, apple and amr have alote to learn. Qualcomm is not behind, Qualcomm is far ahead. a really small chip with a really low power consumption and a great performance. The tegra x1 do not have nothing to look against the adreno 630.Eximorph - Tuesday, February 13, 2018 - link
https://wccftech.com/snapdragon-820-benchmarks/