The Snapdragon 845 Performance Preview: Setting the Stage for Flagship Android 2018
by Ryan Smith & Andrei Frumusanu on February 12, 2018 12:30 AM EST- Posted in
- Mobile
- Snapdragon
- Qualcomm
- Smartphones
- SoCs
- Snapdragon 845
GPU Performance & Power Estimates
One of the larger changes that the Snapdragon 845 brings with itself is a new GPU architecture. Qualcomm has been traditionally very secretive when talking about details of their Adreno GPUs and the Adreno 630 is no different here. Truth to be told, the only real sign that we’re looking at more major architectural changes is the transition from the Adreno 5xx series to the Adreno 6xx series.
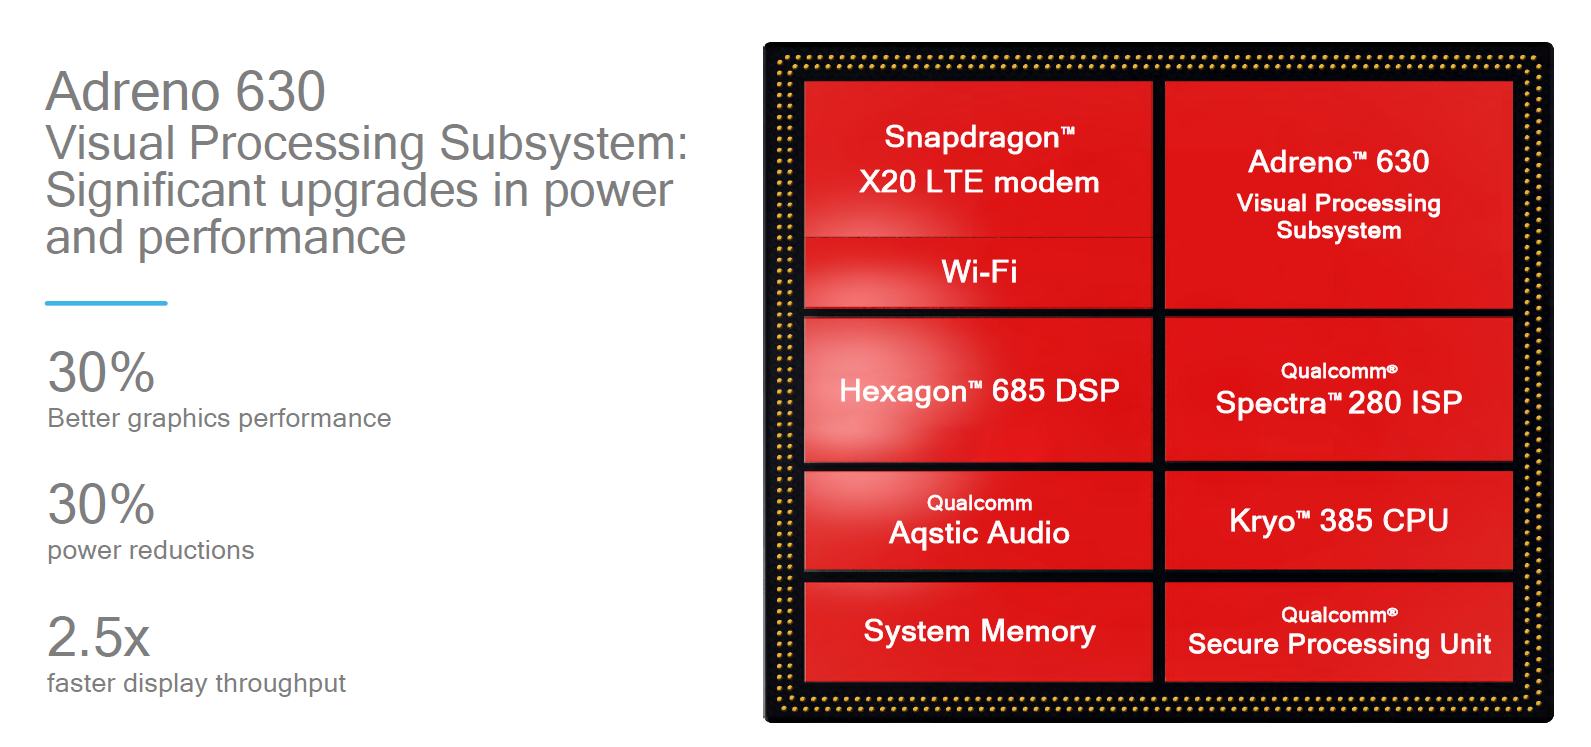
While the Adreno 630 remains largely a black box we do know what Qualcomm’s claims for the GPU are. We’re looking at overall 30% better performance and a 30% improvement in power. The latter point is something that Qualcomm liked to showcase both at the announcement of the Snapdragon 845 as well as for this benchmarking event, however it needs to be clarified that the power improvement is measured at iso-performance levels. Naturally because the 845 targets higher performance points the power would be higher than at 835-levels of performance. Regardless of this marketing nit-pick, we’re still expecting an efficiency increase at peak performance levels if the resulting absolute power remains at the same levels as the Snapdragon 835.
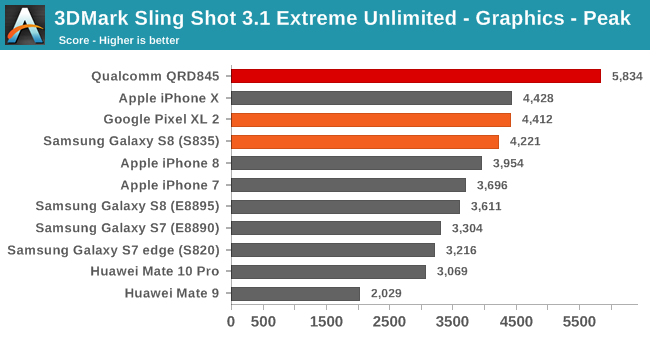
We start off with Futuremark’s 3DMark Sling Shot 3.1 Extreme Unlimited test. The graphics test mainly showcases the GPU improvements of a system and here the Snapdragon 845 easily reaches its performance target, improving by up to 32% compared to the Snapdragon 835 powered Pixel 2 XL and Galaxy S8. This is an astonishingly great achievement for Qualcomm in one generation.
When we’re looking at competitor devices we see only the the iPhone X able to compete with the last generation Snapdragon 835 devices – however with a catch. The A11 is severely thermally constrained and is only able to achieve these scores when the devices are cold. Indeed as seen from the smaller score of the iPhone 8, the SoC isn’t able to sustain maximum performance for even one benchmark run before having to throttle. Unfortunately this also applies to current and last generation Exynos and Kirin SoCs as both shed great amount of performance after only a few minutes. I’ve addressed this issue and made a great rant about it in our review of the Kirin 970. For this reason going forward AnandTech is going to distinguish between Peak and Sustained scores across all 3D benchmarks. This however needs to be tested on commercial devices as the QRD platform isn’t a thermally representative phone for the SoC, so until that happens, we’ll have to just estimate based on power consumption where the Snapdragon 845 ends up.
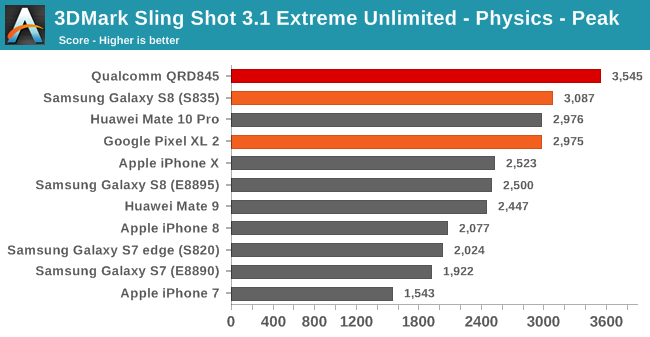
The physics score is a CPU-bound test and less limited by the GPU. Here the Snapdragon 845 provides a good improvement over the Snapdragon 835 however to a meagre 14% increase which incidentally matches the clock frequency increase between the 845 and 835’s performance CPUs.
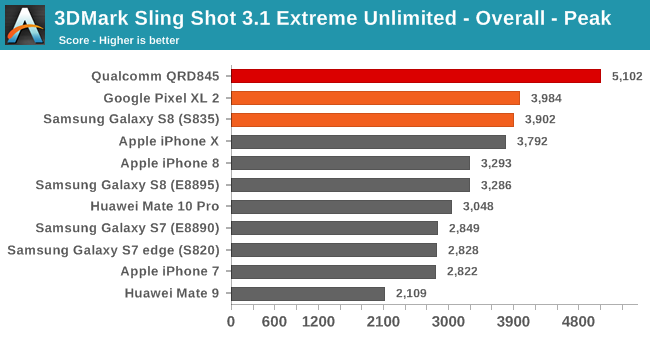
Overall the QRD845 platform leads the Sling Shot Extreme rankings by a comfortable margin.
Moving on to GFXBench I decided to focus on T-Rex and Manhattan 3.1 as both tests stress different aspects of the GPU, fill-rate and texturing bound workloads versus more arithmetic bound workloads.
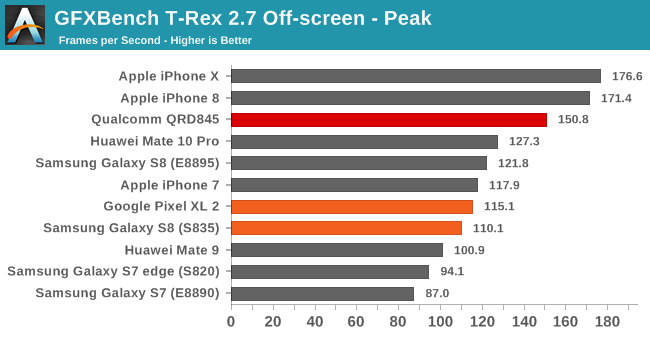
In T-Rex the Snapdragon 845 again shows an impressive 31% increase over the Snapdragon 835. This time around it’s not enough to quite match the Apple A11 but I expect that situation to quickly reverse as the latter becomes thermally constrained.
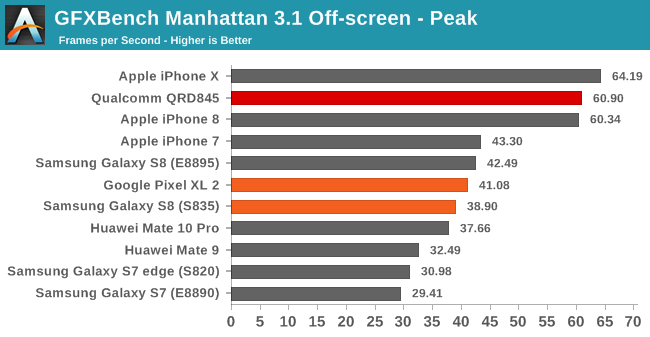
Manhattan 3.1 is more shader and compute heavy and thus puts more stress on the ALU pipelines of the GPU. Here the Adreno 630 outpaces the Adreno 540 by an ever impressive 48%. Again the A11 matches the performance here but with a device becoming very hot quite fast while the QRD845 was merely luke-warm in our preview benchmarking session.
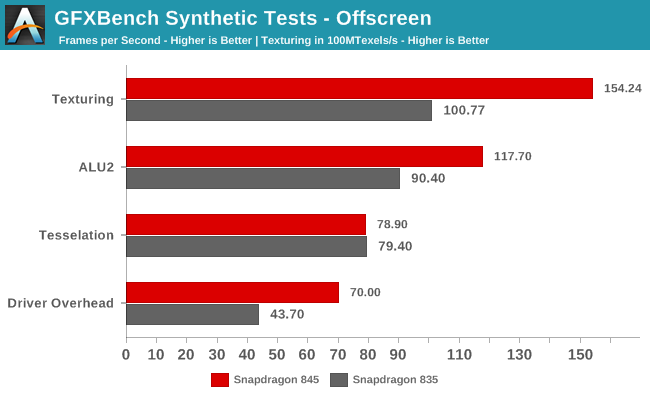
GFXBench’s synthetic micro-tests should shed more light on the architectural improvements of the Adreno 640. Indeed looking at the results we see that the Snapdragon 845 is able to achieve an over 50% increase in the texturing test to an unmatched 15400MTexels/s. Qualcomm’s claims of 2.5x faster display throughput more than likely involves also vastly increased pixel fillrate capabilities on the side of the GPU so the architecture must have increased the number of ROPs and texturing units to get to such scores.
The ALU2 test shows a 30% increase in performance over the Snapdragon 845, however the fact that Manhattan 3.1’s score increased by up to 48% means that we’re likely seeing a more fundamental change in the ALU pipelines that lead to better utilisation ratio.
The tessellation results point out that the geometry pipelines haven’t received any large improvements. One fact-check that we unfortunately weren’t able to verify is the clock frequency of the Adreno 640. The fact that the tessellation test ends up in spitting distance of the Adreno 630 means that we’re very likely looking at clocks very similar to the Adreno 630 – in the 670 to 710MHz range.
Finally the driver overhead score shows both the increased raw CPU performance of the Snapdragon 845 as well as maybe an improvement in Qualcomm’s drivers.
As beforementioned, going forward we’re going to have a more heavy focus on GPU sustained performance as well as power. During the benchmarking session we were able to probe the QRD845 for power as measured by the fuel gauge by the PMIC. We must however note that these platforms aren’t usually power optimised and have early silicon bins – Qualcomm themselves don’t advise them for power measurements. Nevertheless curiosity got the best of us and the following estimated figures should be seen as worst-case scenarios for the Snapdragon 845.
| GFXBench Manhattan 3.1 Offscreen Power Efficiency (System Active Power) |
||||
| Mfc. Process | FPS | Avg. Power (W) |
Perf/W Efficiency |
|
| Qualcomm QRD (Snapdragon 845) | 10LPP | 60.90 | ~4.38 | 13.90 fps/W |
| Galaxy S8 (Snapdragon 835) | 10LPE | 38.90 | 3.79 | 10.26 fps/W |
| LeEco Le Pro3 (Snapdragon 821) | 14LPP | 33.04 | 4.18 | 7.90 fps/W |
| Galaxy S7 (Snapdragon 820) | 14LPP | 30.98 | 3.98 | 7.78 fps/W |
| Huawei Mate 10 (Kirin 970) | 10FF | 37.66 | 6.33 | 5.94 fps/W |
| Galaxy S8 (Exynos 8895) | 10LPE | 42.49 | 7.35 | 5.78 fps/W |
| Galaxy S7 (Exynos 8890) | 14LPP | 29.41 | 5.95 | 4.94 fps/W |
| Meizu PRO 5 (Exynos 7420) | 14LPE | 14.45 | 3.47 | 4.16 fps/W |
| Nexus 6P (Snapdragon 810 v2.1) | 20Soc | 21.94 | 5.44 | 4.03 fps/W |
| Huawei Mate 8 (Kirin 950) | 16FF+ | 10.37 | 2.75 | 3.77 fps/W |
| Huawei Mate 9 (Kirin 960) | 16FFC | 32.49 | 8.63 | 3.77 fps/W |
| Huawei P9 (Kirin 955) | 16FF+ | 10.59 | 2.98 | 3.55 fps/W |
For Manhattan 3.1 the Snapdragon 845 had an active system power figure (Idle power subtracted from total platform power) of 4.38W. The excellent performance figure of the Adreno 630 alongside the reasonable power consumption puts the Snapdragon 845 well ahead at the top of our efficiency table, improving by up to 35% compared to the S835 Galaxy S8, with three generations of Adreno based SoC outmatching the latest ARM solutions. We’re aware of the demand for power figures on Apple’s latest SoCs but sadly we can’t tear down our review devices for battery power measurements and working on a solution. Given the A11’s thermal characteristics I’m expecting power usages more in line with the Exynos 8895 and Kirin 970 than the Snapdragon SoCs.
| GFXBench T-Rex Offscreen Power Efficiency (System Active Power) |
||||
| Mfc. Process | FPS | Avg. Power (W) |
Perf/W Efficiency |
|
| Qualcomm QRD (Snapdragon 845) | 10LPP | 150.80 | ~4.02 | 37.51 fps/W |
| Galaxy S8 (Snapdragon 835) | 10LPE | 108.20 | 3.45 | 31.31 fps/W |
| LeEco Le Pro3 (Snapdragon 821) | 14LPP | 94.97 | 3.91 | 24.26 fps/W |
| Galaxy S7 (Snapdragon 820) | 14LPP | 90.59 | 4.18 | 21.67 fps/W |
| Galaxy S8 (Exynos 8895) | 10LPE | 121.00 | 5.86 | 20.65 fps/W |
| Galaxy S7 (Exynos 8890) | 14LPP | 87.00 | 4.70 | 18.51 fps/W |
| Huawei Mate 10 (Kirin 970) | 10FF | 127.25 | 7.93 | 16.04 fps/W |
| Meizu PRO 5 (Exynos 7420) | 14LPE | 55.67 | 3.83 | 14.54 fps/W |
| Nexus 6P (Snapdragon 810 v2.1) | 20Soc | 58.97 | 4.70 | 12.54 fps/W |
| Huawei Mate 8 (Kirin 950) | 16FF+ | 41.69 | 3.58 | 11.64 fps/W |
| Huawei P9 (Kirin 955) | 16FF+ | 40.42 | 3.68 | 10.98 fps/W |
| Huawei Mate 9 (Kirin 960) | 16FFC | 99.16 | 9.51 | 10.42 fps/W |
T-Rex stresses the GPU differently and we see slightly lower power consumption compared to Manhattan 3.1 ending up at 4W and showcasing an efficiency increase of 20% over the Snapdragon 835, again pointing towards more tangible changes in the ALU pipelines of the new architecture.
Overall the Adreno 630 more than delivers as it’s able to double-down on the Adreno 540’s efficiency advantage. Qualcomm current generations of SoCs are simply unmatched and the gap is so wide that I do not expect upcoming rival solutions to be able to catch up this year.


140 Comments
View All Comments
generalako - Monday, February 12, 2018 - link
No, Qualcomm actually didn't list those charts themselves. Qualcomm, on their own site even, stated during and after the launch, that the SD845 will provide "up to 25% performance improvement" over the SD835. That was with the stated clockspeed of 2.8 GHz.Reflex - Monday, February 12, 2018 - link
Um, you just confirmed Stormy's point. Re-read Stormy's comment and then your reply...tuxRoller - Tuesday, February 13, 2018 - link
The Qualcomm slide said 25-30% increase@2.8GHz with the smaller cores increasing their performance by 15%@1.8GHz.The next slides looks like its from arm's a75 announcement (no mention of Qualcomm brand names and the graph is the same one that arm uses) not the Qualcomm presentation.
From the article:
"The Kryo 385 gold/performance cluster runs at up to 2.8GHz, which is a 14% frequency increase over the 2.45GHz of the Snapdragon 835's CPU core. But we also have to remember that given that the new CPU cores are likely based on A75's we should be expecting IPC gains of up to 22-34% based on use-cases, bringing the overall expected performance improvement to 39-52%. Qualcomm promises a 25-30% increase which is at the low-end of ARM's projections.'
The author speculates about perf based on the arm graphs & the freq increase that Qualcomm announced but Qualcomm themselves didn't suggest such numbers.
My guess as to why integer IPC didn't increase by much is the power issue Andrei had alluded to before. Iow, the freq scaling provided enough perf so that Qualcomm didn't have to employ the more expensive changes that would've been required for the IPC gains.
mfaisalkemal - Monday, February 12, 2018 - link
@andrei_frumansunu and @ryan_smithany date when we can read review from iphone 8 and iphone x?
i just curious about long term performance manhattan 3.1 compared ipghone 7 and snapdragon 835.
any chance to compare gpu of android and ios device with real world benchmark games Tainted Keep? nvidia use that game when tegra x1 launch.
Andrei Frumusanu - Monday, February 12, 2018 - link
The A11 generally throttles 35% from its peak performance figures while the 835 maintains full or 90%. I'll include the iPhones in the new full review.We don't have any way to benchmark iOS devices in real games.
Andrei Frumusanu - Monday, February 12, 2018 - link
> I'll include the iPhones in the new full review.And by that, I meant general next full device reviews, not specifically iPhone reviews.
mfaisalkemal - Monday, February 12, 2018 - link
sorry not explain you tell little detail, tainted keep have in-game benchmark offscreen 1080p in normal and extreme mode.nvida tegra x1 ultra score: http://www.legitreviews.com/wp-content/uploads/201...
iphone 7+ extreme score: https://i.imgur.com/3v5Tgxt.jpg
ipad pro(a9x) extreme score: https://i.imgur.com/9pKrQBE.jpg
thanks andrei, i'm eagerly waiting for the review :)
Andrei Frumusanu - Monday, February 12, 2018 - link
The game doesn't even allow me to use the extreme settings on Qualcomm devices and in the normal benchmark it's just vsync limited at 60 fps - so I don't think we'll do anything with it.mfaisalkemal - Monday, February 12, 2018 - link
because driver or bug maybe, what a pity!how about test peak GFLOPS with opencl for GPU on next benchmark?
i found this benchmark application named CLPeak on playstore.
https://play.google.com/store/apps/details?id=kr.c...
Oneplus 5 (Adreno 540)
Single-precision compute (GFLOPS)
float : 294.65
float2 : 285.81
float4 : 311.02
float8 : 265.02
float16 : 308.34
half-precision compute (GFLOPS)
half : 570.72
half2 : 539.62
half4 : 610.79
half8 : 314.82
half16 : 313.73
source: https://forum.beyond3d.com/posts/2011570/
with alu result from your test about 50% improvement, i think adreno 640 is not far from tegra X1 (512GFLOPs) in smartphone device!!!
darkd - Monday, February 12, 2018 - link
Note that Ravn is a studio Nvidia has contracted things like this out to multiple times. As with most Nvidia contractors, they tend to have features/optimizations that are Nvidia only, and tend to be almost pointedly unoptimized for tiling GPUs. You can see something to this effect in the Ravn supplied benchmark for Antutu v7.