The Snapdragon 845 Performance Preview: Setting the Stage for Flagship Android 2018
by Ryan Smith & Andrei Frumusanu on February 12, 2018 12:30 AM EST- Posted in
- Mobile
- Snapdragon
- Qualcomm
- Smartphones
- SoCs
- Snapdragon 845
System Performance
To see how the new CPUs and memory subsystem translate into more real system performance, we move onto more representative tests such as PCMark. PCMark’s performance is affected by several factors: not only does raw performance of the hardware count but also we need to consider the individual system’s software stack. We’ve seen large differences between Android OS major versions where the improvements of the Android Runtime can be directly visible in subtests such as the Writing test. Also a SoC’s DVFS schemes and schedulers can have huge impacts on “performance-latency”, meaning how fast the CPUs can ramp up a workload. This directly translates in a lot more performance in several of PCMark’s subtests as in the default settings none of the tests actually represent the pure performance of the CPU if it were locked at maximum frequency on the performance cores. The results of the tests are also overall a good representation of “snappiness” of a device.
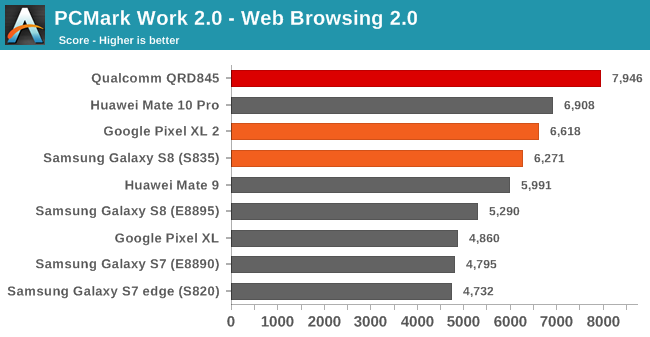
In the web browsing test the Snapdragon 845 QRD manages to outpace the Pixel 2 XL by 20%. Here we’re also looking at performance across devices with different OS versions. The Google devices are running Android 8.1 while the Samsung devices were tested with Android 7.0. The Mate 10 Pro runs Android 8.0 while the Mate 9 still had 7.0. The Qualcomm QRD we tested ran Android 8.0.
Again the performance increase over Snapdragon 835 devices isn’t all that great. DynamiQ allows for far more efficient thread transitions between the CPU cores and subsequently I expected Qualcomm to take advantage of this through more aggressive scheduling resulting in more than just a 20% increase. The difference between the Mate 9 and Mate 10 here is a good example of what a software configuration change can bring in terms of performance (both devices employ same performance CPU configurations). Samsung’s Exynos’ SoCs still use GTS scheduling and have non-optimal performance-latency resulting in bad scores, amplified by the fact that Samsung’s memory performance is also underwhelming when compared to the Snapdragon and Kirin SoCs.
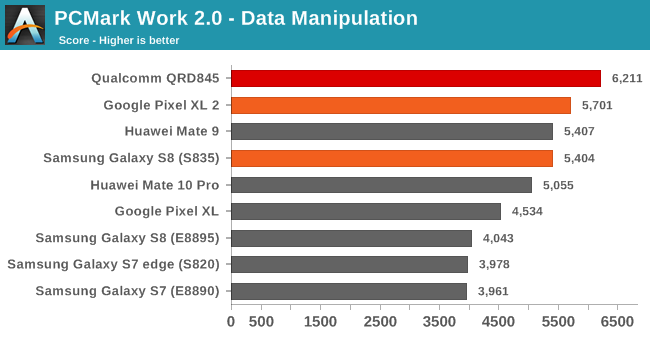
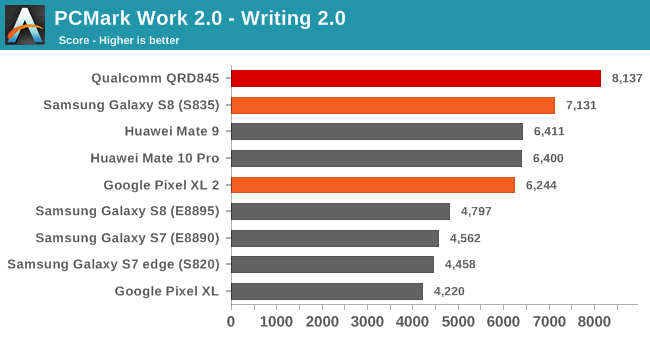
The Data Manipulation and Writing 2.0 tests make heavy use of the Android runtime and APIs and also a very memory latency sensitive. Between the best showings of the Snapdragon 835 variant of the S8 and the Pixel 2 XL in each respective benchmark, the Snapdragon QRD845 showed conservative increases of 8 to 14%. The Exynos SoCs lacklustre performance is again hampered by software and by bad memory performance.
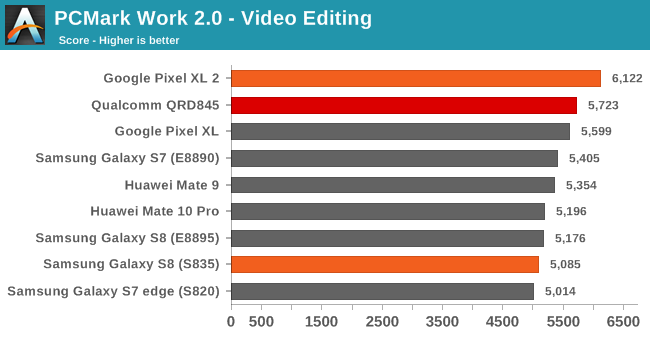
The video editing test is PCMark’s weak-point as it’s bottlenecked by things such as OS API overhead, and why we see tight grouping of performance results across a large range of SoCs. The Snapdragon 845 ends up high, but below the Pixel 2 XL. I would not put much weight on the results of this test as they’re not necessarily representative. Futuremark claims that the test is a lot more sensitive in mid- and low-range devices which can exhibit performance issues.
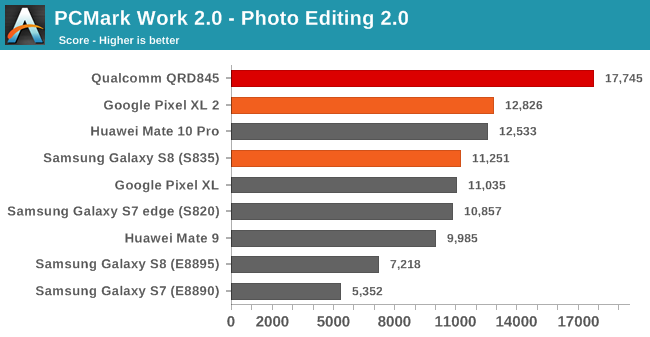
The photo editing test makes heavy use of Renderscript and use GPU acceleration to apply various effects on an image set. The QRD845 here shines as it’s able to showcase a 38% performance improvement over the Pixel 2 XL. Again the test not solely tests the raw performance of the system but also how optimized it is in terms of the software stack. This can be seen in the Kirin vs Exynos devices as Huawei’s phones vastly outperform Samsung’s devices in this test.
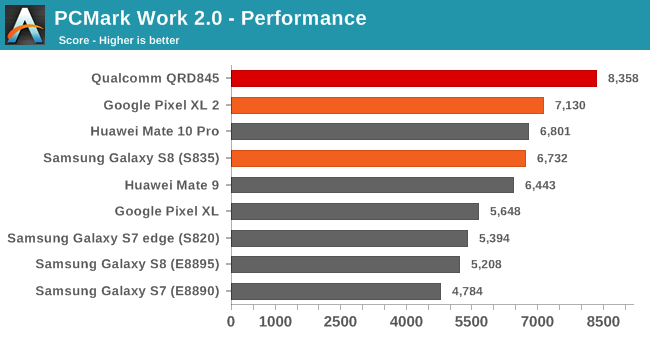
Overall PCMark’s performance score for the QRD845 increases by 17% over the Pixel 2 XL. Disregarding the video test, we see a similar scenario as in the synthetic tests as the new SoC’s CPU performance increases are lower than we had expected. Still the Snapdragon 845 is able to top the charts and should adequately power 2018’s flagship devices.
For 2018 we are reviewing our mobile benchmarking suite and altering some of the benchmarks we use. One of the changes in the way we benchmark devices is that we’re moving away from standalone browser and rather are benchmarking the OS’s WebView implementations. In general this seems to be a better choice for testing device experience as there is a lot of content that is being consumed via WebView windows. We also avoid the argument about different browser performance and since Google has now made WebView an updatable Play Store component we should also have valid comparisons older devices and systems. On the iOS side we do the same as we now benchmark browser tests within a WkWebView shell.
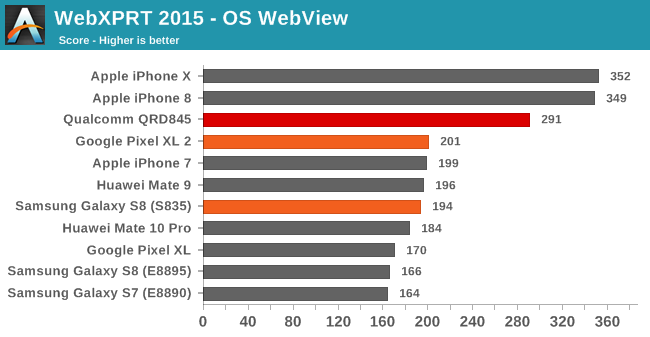
Starting off with WebXPRT 2015 for a last time before we’ll retire it in favour of WebXPRT 3, we see the QRD845 performing fantastically. Here the 44% performance increase over the Pixel 2 XL is a lot more in line with what we had expected of the new SoC. The QRD845 is even able to catch up a lot with Apple’s newest A11 and Monsoon cores in this test.
To keep up with the ever changing landscape of the developing web, we’re also retiring past JavaScript benchmarks in favour of a brand new and more representative benchmark developed by the WebKit team and welcomed by Google; Speedometer 2.0.
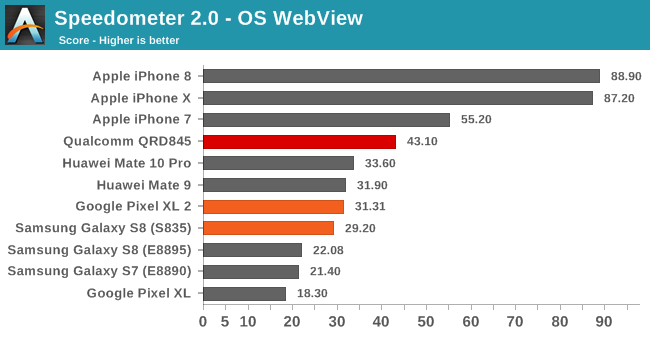
Here the Snapdragon 845 showcased another healthy performance increase of 37% over the Snapdragon 835 devices. Apple’s superior JavaScript performance can be attributed to a much faster and more optimized Nitro engine while Google’s V8 has only seen meagre improvements over the years. Notable is the Apple A11’s massive performance jump over the A10 – vastly increasing the distance to Android devices.


140 Comments
View All Comments
generalako - Monday, February 12, 2018 - link
No, Qualcomm actually didn't list those charts themselves. Qualcomm, on their own site even, stated during and after the launch, that the SD845 will provide "up to 25% performance improvement" over the SD835. That was with the stated clockspeed of 2.8 GHz.Reflex - Monday, February 12, 2018 - link
Um, you just confirmed Stormy's point. Re-read Stormy's comment and then your reply...tuxRoller - Tuesday, February 13, 2018 - link
The Qualcomm slide said 25-30% increase@2.8GHz with the smaller cores increasing their performance by 15%@1.8GHz.The next slides looks like its from arm's a75 announcement (no mention of Qualcomm brand names and the graph is the same one that arm uses) not the Qualcomm presentation.
From the article:
"The Kryo 385 gold/performance cluster runs at up to 2.8GHz, which is a 14% frequency increase over the 2.45GHz of the Snapdragon 835's CPU core. But we also have to remember that given that the new CPU cores are likely based on A75's we should be expecting IPC gains of up to 22-34% based on use-cases, bringing the overall expected performance improvement to 39-52%. Qualcomm promises a 25-30% increase which is at the low-end of ARM's projections.'
The author speculates about perf based on the arm graphs & the freq increase that Qualcomm announced but Qualcomm themselves didn't suggest such numbers.
My guess as to why integer IPC didn't increase by much is the power issue Andrei had alluded to before. Iow, the freq scaling provided enough perf so that Qualcomm didn't have to employ the more expensive changes that would've been required for the IPC gains.
mfaisalkemal - Monday, February 12, 2018 - link
@andrei_frumansunu and @ryan_smithany date when we can read review from iphone 8 and iphone x?
i just curious about long term performance manhattan 3.1 compared ipghone 7 and snapdragon 835.
any chance to compare gpu of android and ios device with real world benchmark games Tainted Keep? nvidia use that game when tegra x1 launch.
Andrei Frumusanu - Monday, February 12, 2018 - link
The A11 generally throttles 35% from its peak performance figures while the 835 maintains full or 90%. I'll include the iPhones in the new full review.We don't have any way to benchmark iOS devices in real games.
Andrei Frumusanu - Monday, February 12, 2018 - link
> I'll include the iPhones in the new full review.And by that, I meant general next full device reviews, not specifically iPhone reviews.
mfaisalkemal - Monday, February 12, 2018 - link
sorry not explain you tell little detail, tainted keep have in-game benchmark offscreen 1080p in normal and extreme mode.nvida tegra x1 ultra score: http://www.legitreviews.com/wp-content/uploads/201...
iphone 7+ extreme score: https://i.imgur.com/3v5Tgxt.jpg
ipad pro(a9x) extreme score: https://i.imgur.com/9pKrQBE.jpg
thanks andrei, i'm eagerly waiting for the review :)
Andrei Frumusanu - Monday, February 12, 2018 - link
The game doesn't even allow me to use the extreme settings on Qualcomm devices and in the normal benchmark it's just vsync limited at 60 fps - so I don't think we'll do anything with it.mfaisalkemal - Monday, February 12, 2018 - link
because driver or bug maybe, what a pity!how about test peak GFLOPS with opencl for GPU on next benchmark?
i found this benchmark application named CLPeak on playstore.
https://play.google.com/store/apps/details?id=kr.c...
Oneplus 5 (Adreno 540)
Single-precision compute (GFLOPS)
float : 294.65
float2 : 285.81
float4 : 311.02
float8 : 265.02
float16 : 308.34
half-precision compute (GFLOPS)
half : 570.72
half2 : 539.62
half4 : 610.79
half8 : 314.82
half16 : 313.73
source: https://forum.beyond3d.com/posts/2011570/
with alu result from your test about 50% improvement, i think adreno 640 is not far from tegra X1 (512GFLOPs) in smartphone device!!!
darkd - Monday, February 12, 2018 - link
Note that Ravn is a studio Nvidia has contracted things like this out to multiple times. As with most Nvidia contractors, they tend to have features/optimizations that are Nvidia only, and tend to be almost pointedly unoptimized for tiling GPUs. You can see something to this effect in the Ravn supplied benchmark for Antutu v7.