The AnandTech Coffee Lake Review: Initial Numbers on the Core i7-8700K and Core i5-8400
by Ian Cutress on October 5, 2017 9:00 AM EST- Posted in
- CPUs
- Intel
- Core i5
- Core i7
- Core i3
- 14nm
- Coffee Lake
- 14++
- Hex-Core
- Hyperthreading
Rise of the Tomb Raider
One of the newest games in the gaming benchmark suite is Rise of the Tomb Raider (RoTR), developed by Crystal Dynamics, and the sequel to the popular Tomb Raider which was loved for its automated benchmark mode. But don’t let that fool you: the benchmark mode in RoTR is very much different this time around.
Visually, the previous Tomb Raider pushed realism to the limits with features such as TressFX, and the new RoTR goes one stage further when it comes to graphics fidelity. This leads to an interesting set of requirements in hardware: some sections of the game are typically GPU limited, whereas others with a lot of long-range physics can be CPU limited, depending on how the driver can translate the DirectX 12 workload.
Where the old game had one benchmark scene, the new game has three different scenes with different requirements. These are three scenes designed to be taken from the game, but it has been noted that scenes like 2-Prophet shown in the benchmark can be the most CPU limited elements of that entire level, and the scene shown is only a small portion of that level. Because of this, we report the results for each scene on each graphics card separately.

Graphics options for RoTR are similar to other games in this type, offering some presets or allowing the user to configure texture quality, anisotropic filter levels, shadow quality, soft shadows, occlusion, depth of field, tessellation, reflections, foliage, bloom, and features like PureHair which updates on TressFX in the previous game.
Again, we test at 1920x1080 and 4K using our native 4K displays. At 1080p we run the High preset, while at 4K we use the Medium preset which still takes a sizable hit in frame rate.
It is worth noting that RoTR is a little different to our other benchmarks in that it keeps its graphics settings in the registry rather than a standard ini file, and unlike the previous TR game the benchmark cannot be called from the command-line. Nonetheless we scripted around these issues to automate the benchmark four times and parse the results. From the frame time data, we report the averages, 99th percentiles, and our time under analysis.
All of our benchmark results can also be found in our benchmark engine, Bench.
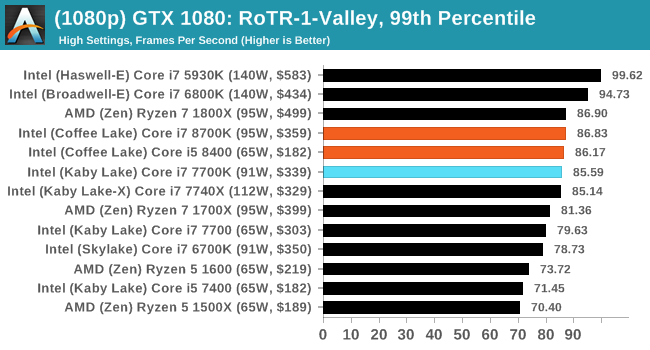
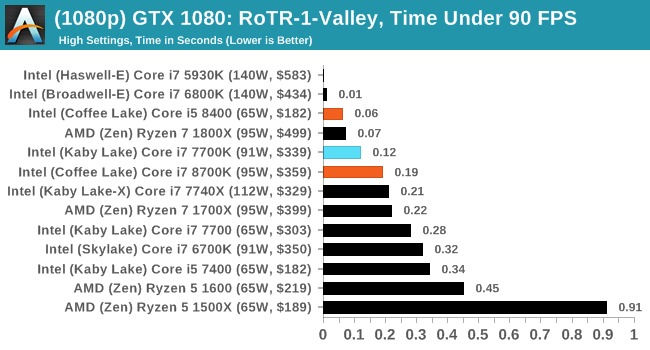
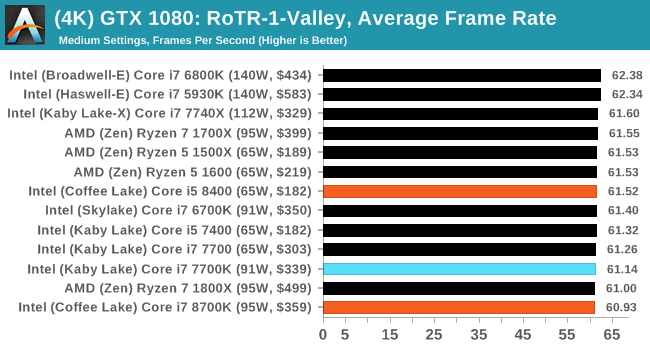
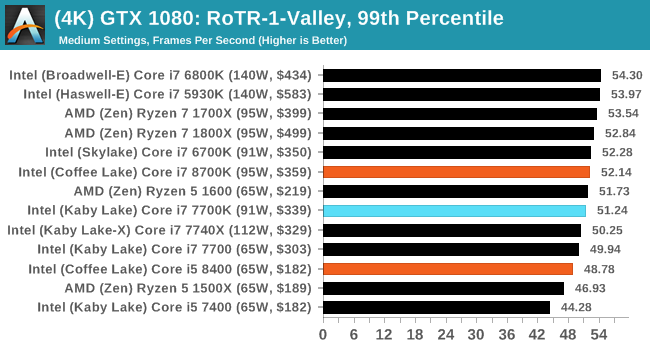
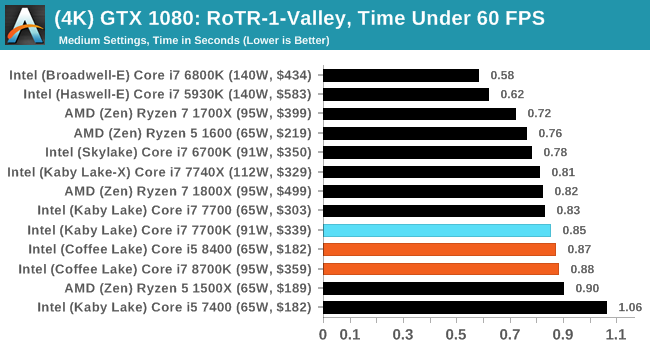
#1 Geothermal Valley Spine of the Mountain
MSI GTX 1080 Gaming 8G Performance
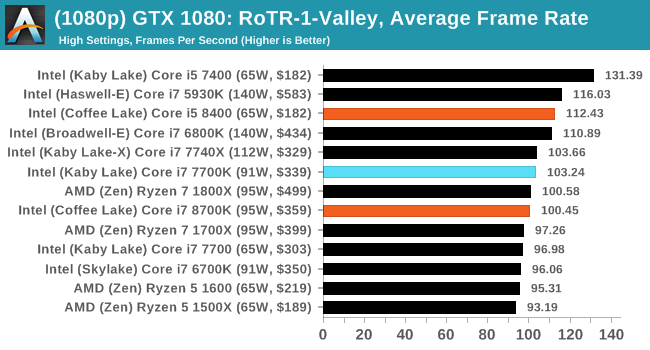
1080p
4K
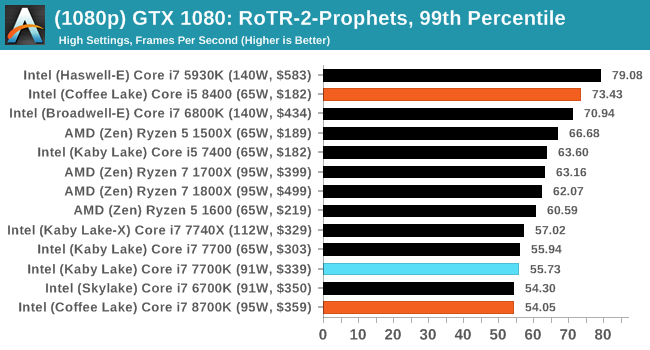
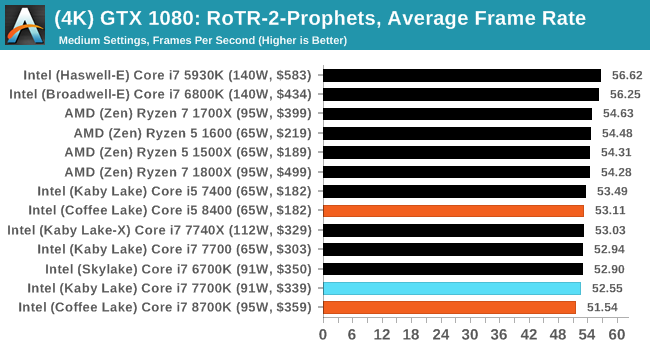
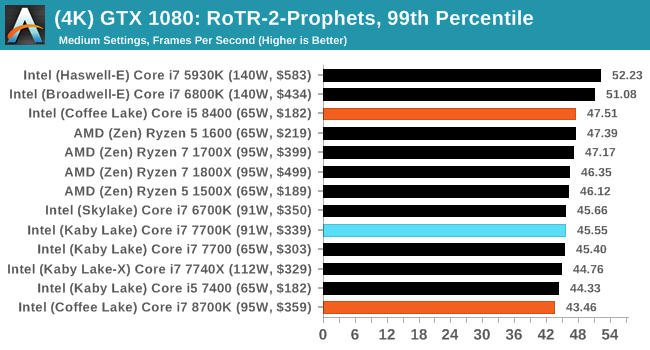
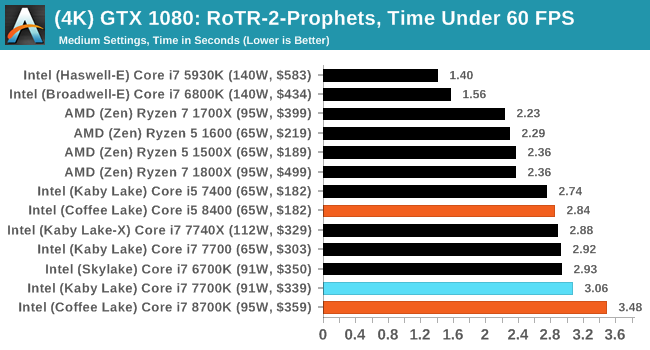
#2 Prophet’s Tomb
MSI GTX 1080 Gaming 8G Performance

1080p

4K
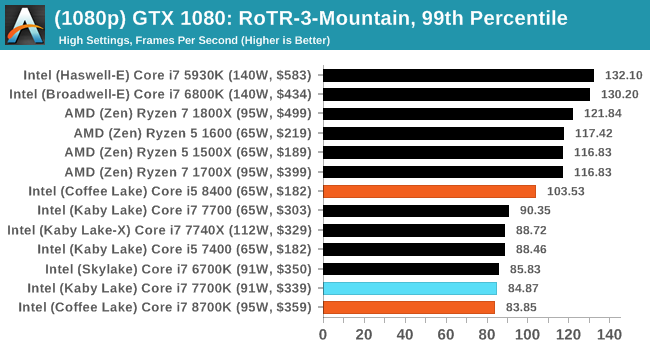
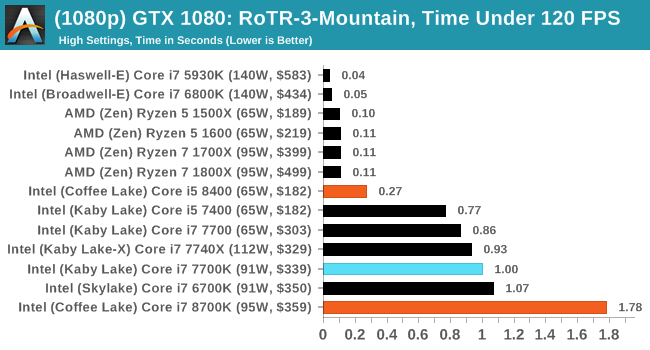
#3 Spine of the Mountain GeoThermal Valley

MSI GTX 1080 Gaming 8G Performance
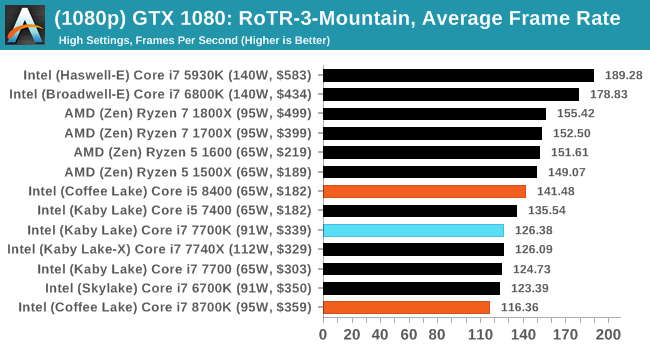
1080p
4K
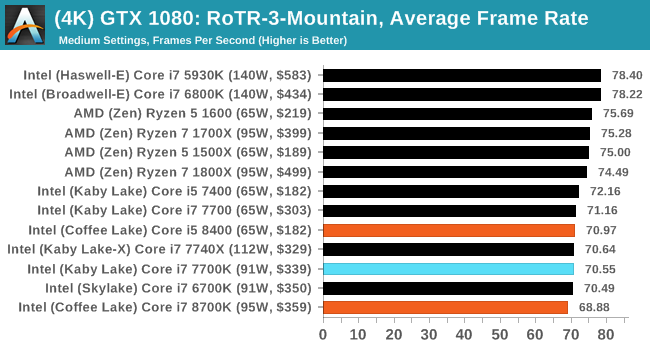
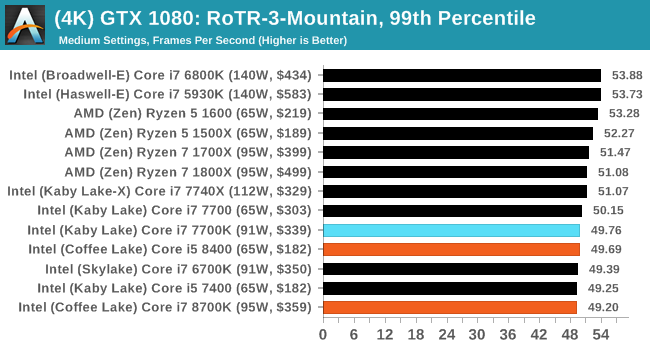
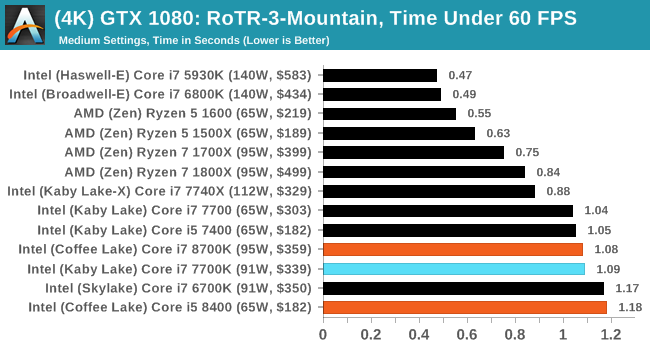
The 8700K did not seem to play nicely with RoTR. We'll go back and check this.


222 Comments
View All Comments
mapesdhs - Friday, October 6, 2017 - link
Any idea what that optimisation is? Seems odd that adding extra pure cores would harm performance, as opposed to adding HT which some games don't play nice with. Otherwise, are you saying that for this test, if it was present, the i3 8100 would come out on top? Blimey.Ian Cutress - Saturday, October 7, 2017 - link
They're either doing something to align certain CPU tasks for AVX, or it's bypassing code. You'd have to ask the developers on that.mapesdhs - Monday, October 9, 2017 - link
I doubt they'd explain what's happening, might be proprietory code or something.WickedMONK3Y - Thursday, October 5, 2017 - link
You have the spec of the i7 8700K slightly wrong. It has a base frequency of 3.7GHz not 3.8GHz.https://ark.intel.com/products/126684/Intel-Core-i...
Ian Cutress - Thursday, October 5, 2017 - link
Mistake on our part. I was using our previous news post as my source and that had a Typo. This review (and that news) should be updated now.Slomo4shO - Thursday, October 5, 2017 - link
Ian, this is probably your worst review to date. Lackluster choice of CPUs, mid-grade GPU, and lack of direct competition in the product stack... Why would you not use a GTX 1080 Ti or Titan XP?Ian Cutress - Thursday, October 5, 2017 - link
All the CPUs we've ever tested are in Bench. Plenty of other data in there: the goal was to not put 30+ CPUs into every graph.Our benchmark database includes over 40 CPUs tested on the GTX 1080, which is the most powerful GPU I could get a set of so I can do parallel testing across several systems. If that wasn't enough (a full test per CPU takes 5 hours per GPU), the minute I get better GPUs I would have to start retesting every CPU. At the exclusion of other content. Our benchmark suite was updated in early Q2, and we're sticking with that set of GPUs (GTX 1080/1060/R9 Fury/RX 480) for a good while for that reason.
Note I had three days to do this review.
crimson117 - Thursday, October 5, 2017 - link
Good job! More people need to know about the bench...Slomo4shO - Thursday, October 5, 2017 - link
To be fair the R5 1600 was added to the benches after the fact. In addition, your othwr reviews tend to be much more detailed and data driven with relevant products and multiple GPUs.Why would I read your review if you expect me to dig through your benchmark to obtain relivant data?
I can understand and appreciate the time crunch but it is a poor excuse for some of the decisions made in this review.
Take it with a grain of salt, this was not your best work.
mapesdhs - Friday, October 6, 2017 - link
Ooohhh the effort of examing the data in Bench! :D First world problems. Sheesh...Run your own tests then, see how you get on with having a life. It's insanely time consuming.