The AnandTech Coffee Lake Review: Initial Numbers on the Core i7-8700K and Core i5-8400
by Ian Cutress on October 5, 2017 9:00 AM EST- Posted in
- CPUs
- Intel
- Core i5
- Core i7
- Core i3
- 14nm
- Coffee Lake
- 14++
- Hex-Core
- Hyperthreading
Rise of the Tomb Raider
One of the newest games in the gaming benchmark suite is Rise of the Tomb Raider (RoTR), developed by Crystal Dynamics, and the sequel to the popular Tomb Raider which was loved for its automated benchmark mode. But don’t let that fool you: the benchmark mode in RoTR is very much different this time around.
Visually, the previous Tomb Raider pushed realism to the limits with features such as TressFX, and the new RoTR goes one stage further when it comes to graphics fidelity. This leads to an interesting set of requirements in hardware: some sections of the game are typically GPU limited, whereas others with a lot of long-range physics can be CPU limited, depending on how the driver can translate the DirectX 12 workload.
Where the old game had one benchmark scene, the new game has three different scenes with different requirements. These are three scenes designed to be taken from the game, but it has been noted that scenes like 2-Prophet shown in the benchmark can be the most CPU limited elements of that entire level, and the scene shown is only a small portion of that level. Because of this, we report the results for each scene on each graphics card separately.

Graphics options for RoTR are similar to other games in this type, offering some presets or allowing the user to configure texture quality, anisotropic filter levels, shadow quality, soft shadows, occlusion, depth of field, tessellation, reflections, foliage, bloom, and features like PureHair which updates on TressFX in the previous game.
Again, we test at 1920x1080 and 4K using our native 4K displays. At 1080p we run the High preset, while at 4K we use the Medium preset which still takes a sizable hit in frame rate.
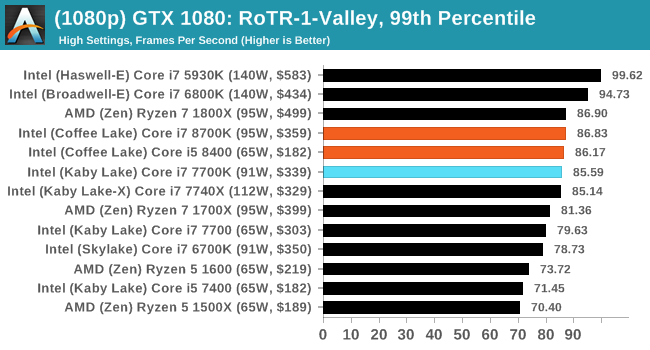
It is worth noting that RoTR is a little different to our other benchmarks in that it keeps its graphics settings in the registry rather than a standard ini file, and unlike the previous TR game the benchmark cannot be called from the command-line. Nonetheless we scripted around these issues to automate the benchmark four times and parse the results. From the frame time data, we report the averages, 99th percentiles, and our time under analysis.
All of our benchmark results can also be found in our benchmark engine, Bench.
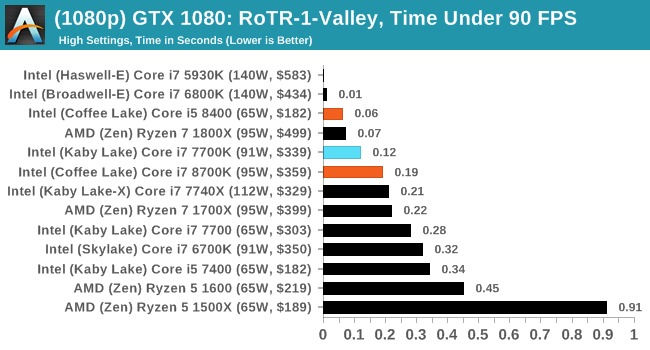
#1 Geothermal Valley Spine of the Mountain
MSI GTX 1080 Gaming 8G Performance
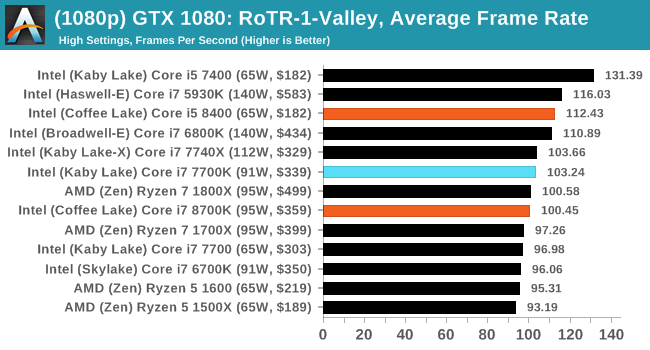
1080p
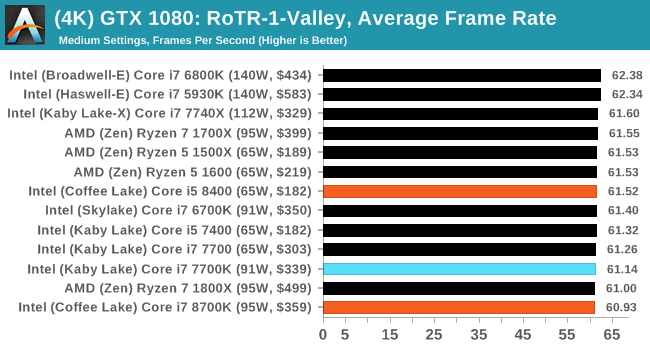
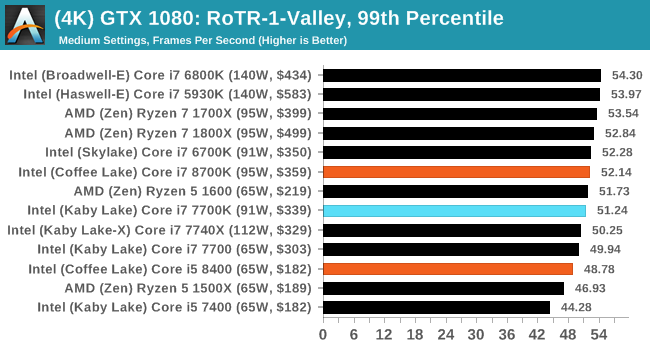
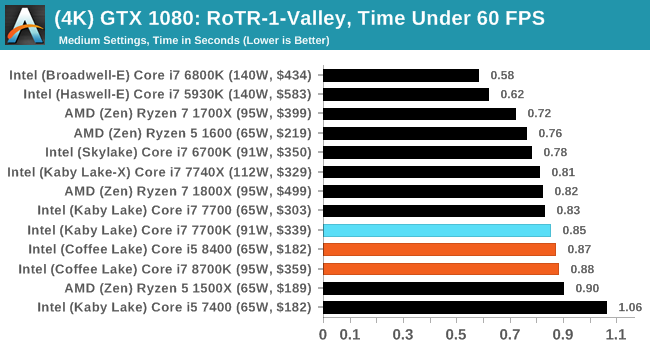
4K
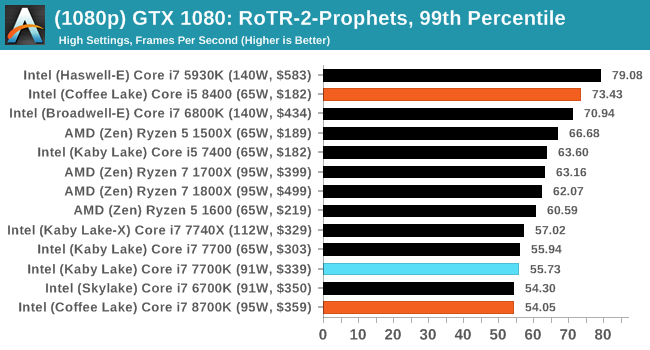
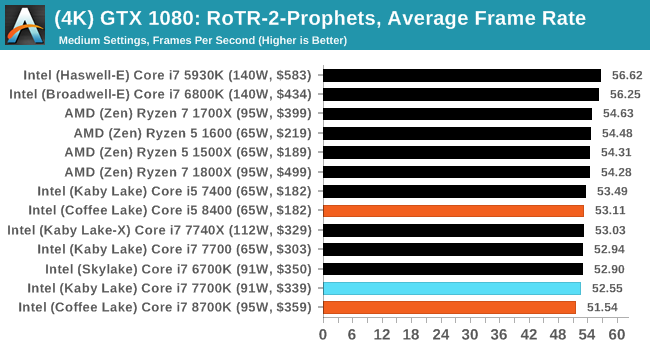
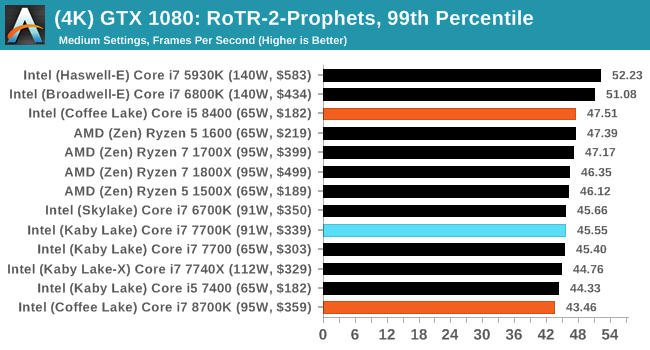
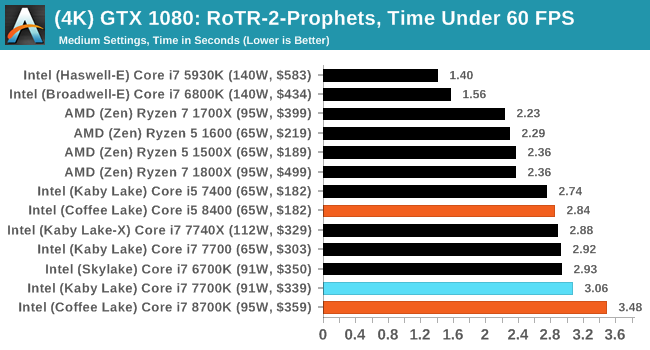
#2 Prophet’s Tomb
MSI GTX 1080 Gaming 8G Performance

1080p

4K
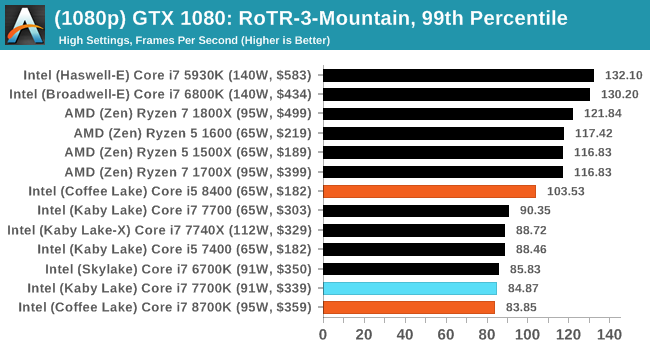
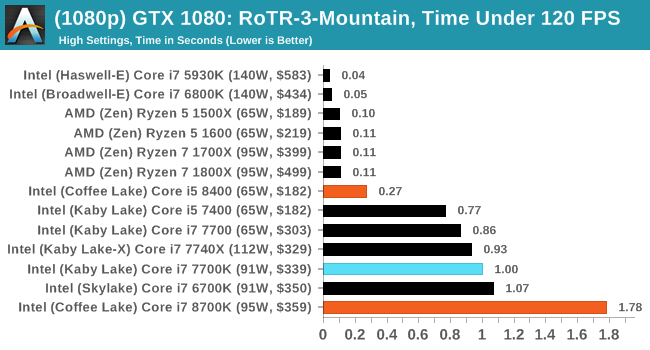
#3 Spine of the Mountain GeoThermal Valley

MSI GTX 1080 Gaming 8G Performance
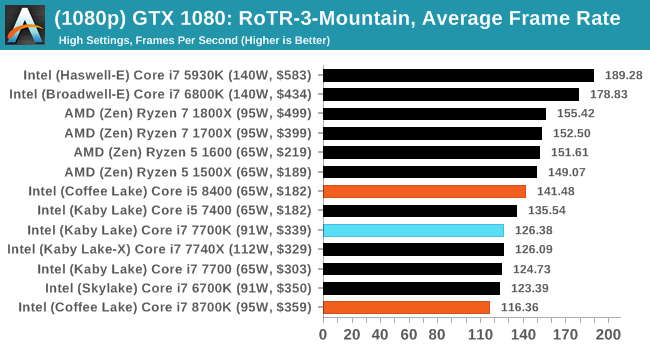
1080p
4K
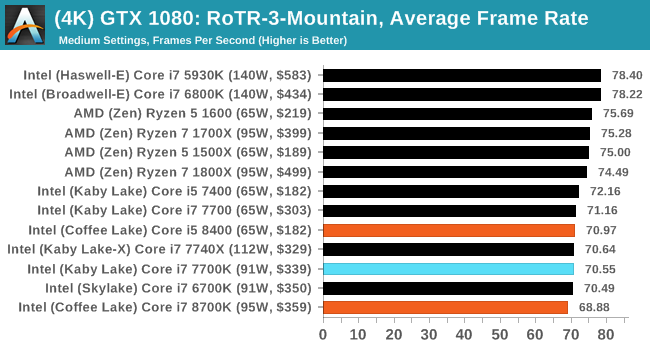
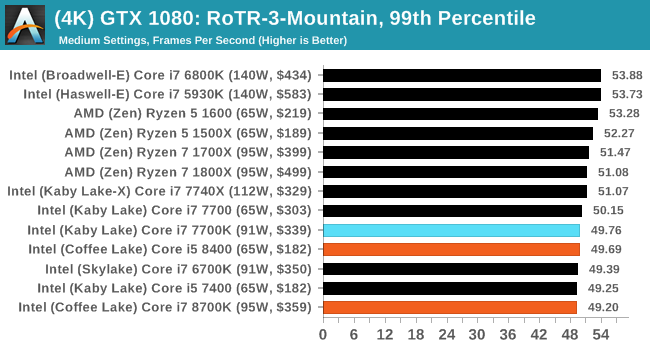
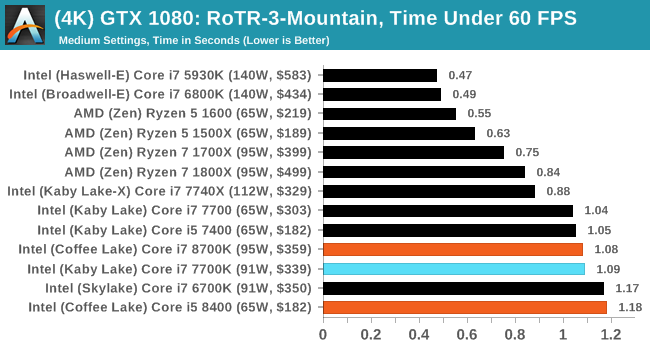
The 8700K did not seem to play nicely with RoTR. We'll go back and check this.


222 Comments
View All Comments
mapesdhs - Monday, October 9, 2017 - link
I'm not sure. :D It's certainly annoying though. Worst part is searching for anything and then changing the list order to cheapest first, what a mess...SunnyNW - Thursday, October 5, 2017 - link
"That changes today."Anyone else read that and think that it is something we should have been reading ages ago?
Consumer technology is progressing slower than many expected and I feel the same way. Nonetheless I can't help but envision a Very near future where I'll be coming back and reading this article and being depressed at this level of technology all the while on my future monolithic many thousand core 3D processor ;)
KAlmquist - Friday, October 6, 2017 - link
Yes. A year ago this would have been an exciting development. Now it's just Intel remaining competitive against AMD's offerings.Valcoma - Thursday, October 5, 2017 - link
"The Core i5-8400 ($182) and Core i3-8350K ($169) sit near the Ryzen 5 1500X ($189) and the Ryzen 5 1400 ($169) respectively. Both the AMD parts are six cores and twelve threads, up against the 6C/6T Core i5 and the 4C/4T Core i3. The difference between the Ryzen 4 1400 and the Core i3-8350K would be interesting, given the extreme thread deficit between the two."Those AMD parts are 4 cores, 8 threads.
Ian Cutress - Thursday, October 5, 2017 - link
You're right, had a brain spasm while writing that bit. Updated.kpb321 - Thursday, October 5, 2017 - link
Still off"The difference between the Ryzen 5 1500X and the Core i3-8350K would be interesting, given the extreme thread deficit (12 threads vs 4) between the two."
the 1500X is a 4c8t processor so it effectively has hyper-threading over the i3-8350K while having a lower overclocking ceiling and lower ipc.
Zingam - Saturday, October 7, 2017 - link
Drinking too much Coffee, eh?hansmuff - Thursday, October 5, 2017 - link
Ian, I love the way the gaming benchmarks are listed. So easy to access and much less confusing than drop-downs or arrows. Nice job!Valcoma - Thursday, October 5, 2017 - link
Are you sure that the i5-7400 got 131 FPS average in benchmark 1 - Spine of the Mountain in Rise of the Tomb Raider? Besting all the other vastly superior processors?Looks like a typing error there or something went wrong with your benchmark (lower settings for example on that run).
Ian Cutress - Thursday, October 5, 2017 - link
I've mentioned it in several reviews in the past: RoTR stage 1 is heavily optimized for quad core. Check our Bench results - the top eight CPUs are all 4C/4T. The minute you add threads, the results plummet.https://www.anandtech.com/bench/CPU/1827