The AnandTech Coffee Lake Review: Initial Numbers on the Core i7-8700K and Core i5-8400
by Ian Cutress on October 5, 2017 9:00 AM EST- Posted in
- CPUs
- Intel
- Core i5
- Core i7
- Core i3
- 14nm
- Coffee Lake
- 14++
- Hex-Core
- Hyperthreading
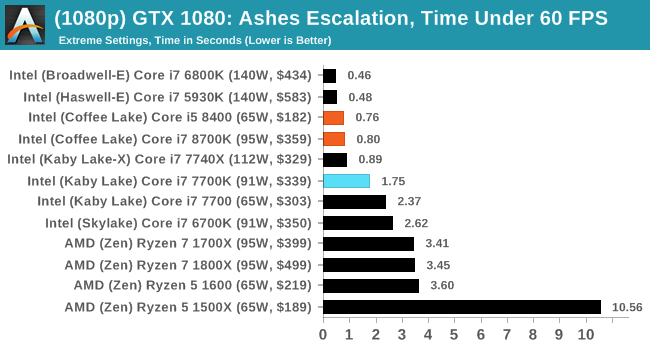
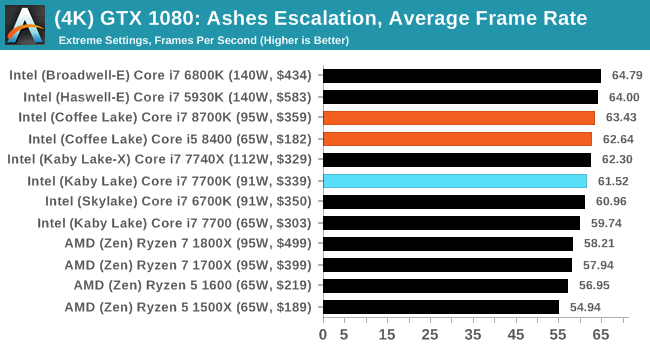
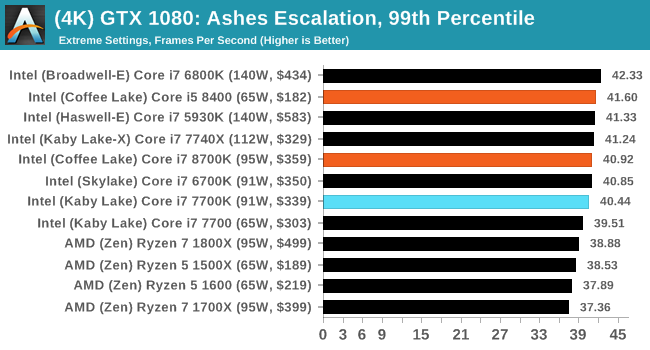
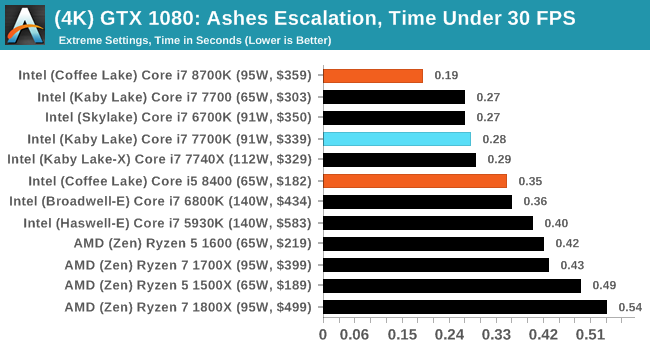
Ashes of the Singularity Escalation
Seen as the holy child of DirectX12, Ashes of the Singularity (AoTS, or just Ashes) has been the first title to actively go explore as many of DirectX12s features as it possibly can. Stardock, the developer behind the Nitrous engine which powers the game, has ensured that the real-time strategy title takes advantage of multiple cores and multiple graphics cards, in as many configurations as possible.
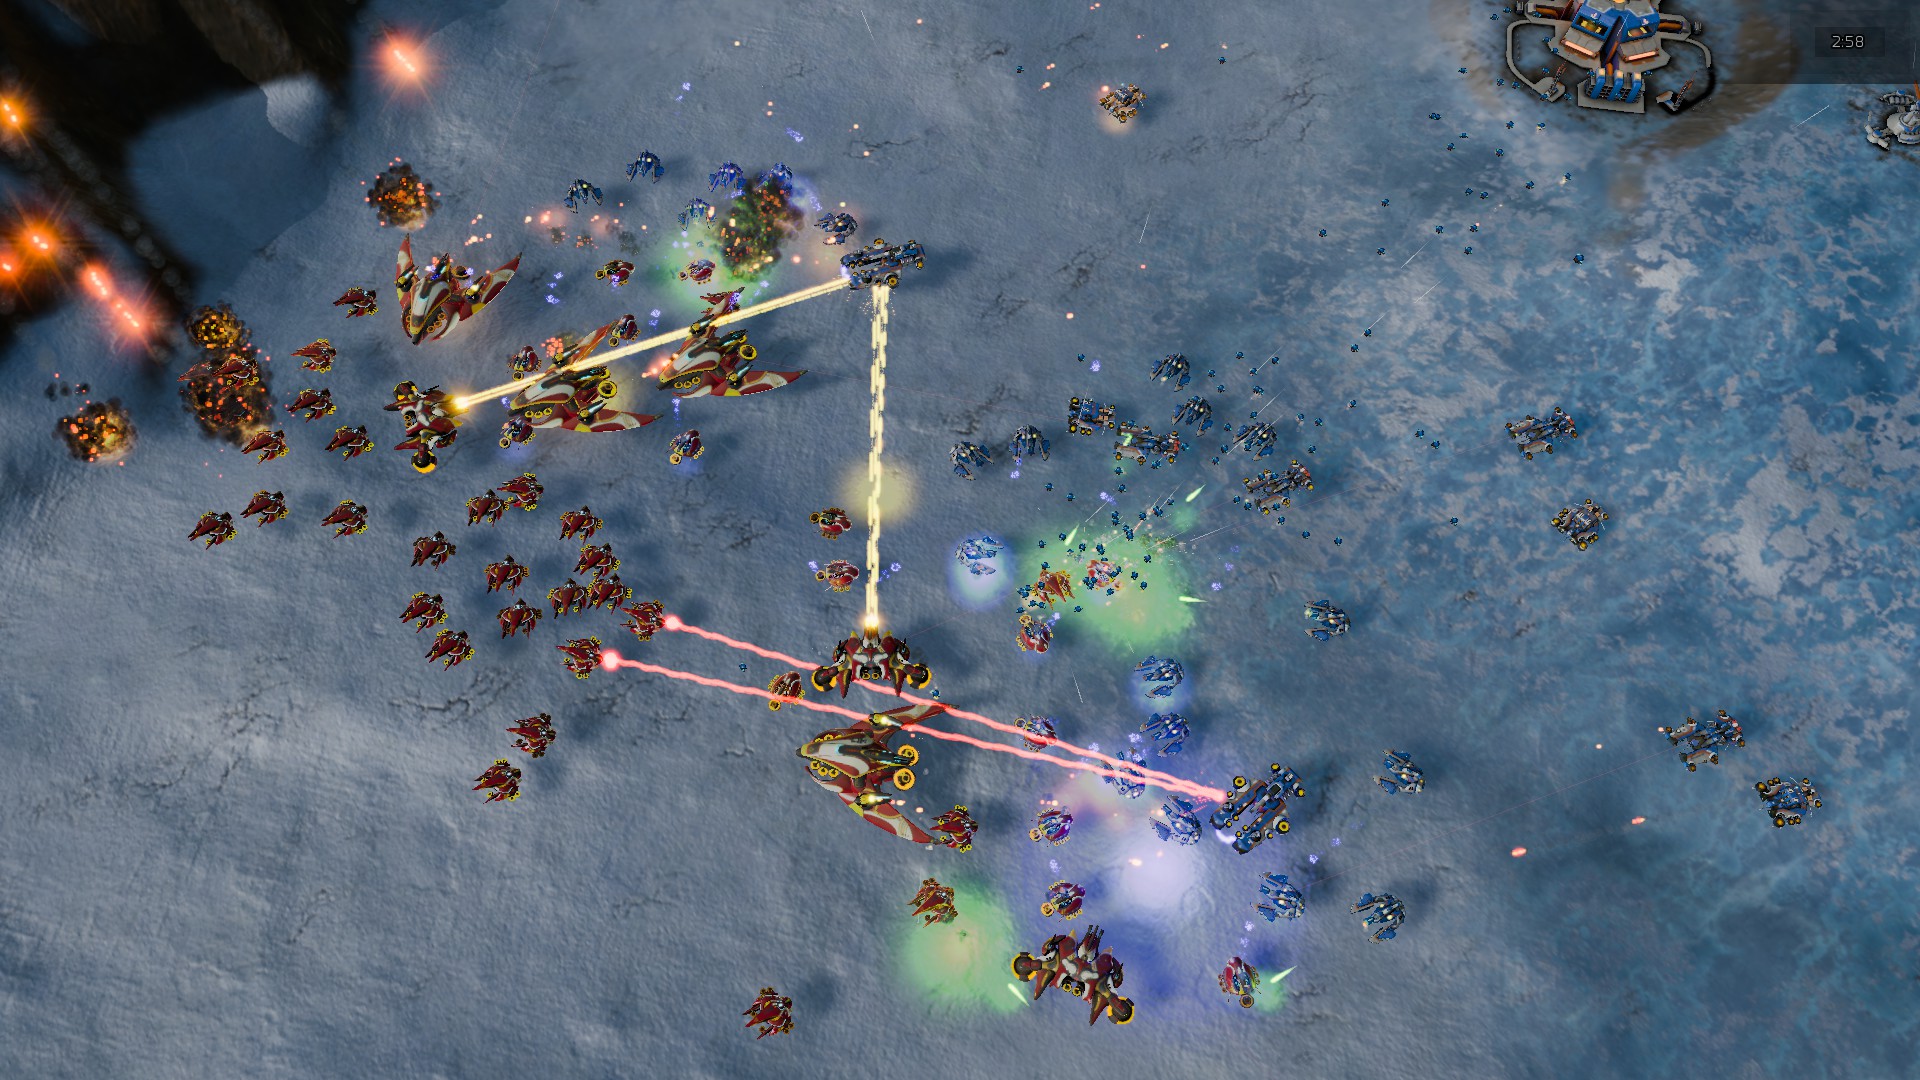
As a real-time strategy title, Ashes is all about responsiveness during both wide open shots but also concentrated battles. With DirectX12 at the helm, the ability to implement more draw calls per second allows the engine to work with substantial unit depth and effects that other RTS titles had to rely on combined draw calls to achieve, making some combined unit structures ultimately very rigid.
Stardock clearly understand the importance of an in-game benchmark, ensuring that such a tool was available and capable from day one, especially with all the additional DX12 features used and being able to characterize how they affected the title for the developer was important. The in-game benchmark performs a four-minute fixed seed battle environment with a variety of shots, and outputs a vast amount of data to analyze.
For our benchmark, we run a fixed v2.11 version of the game due to some peculiarities of the splash screen added after the merger with the standalone Escalation expansion, and have an automated tool to call the benchmark on the command line. (Prior to v2.11, the benchmark also supported 8K/16K testing, however v2.11 has odd behavior which nukes this.)
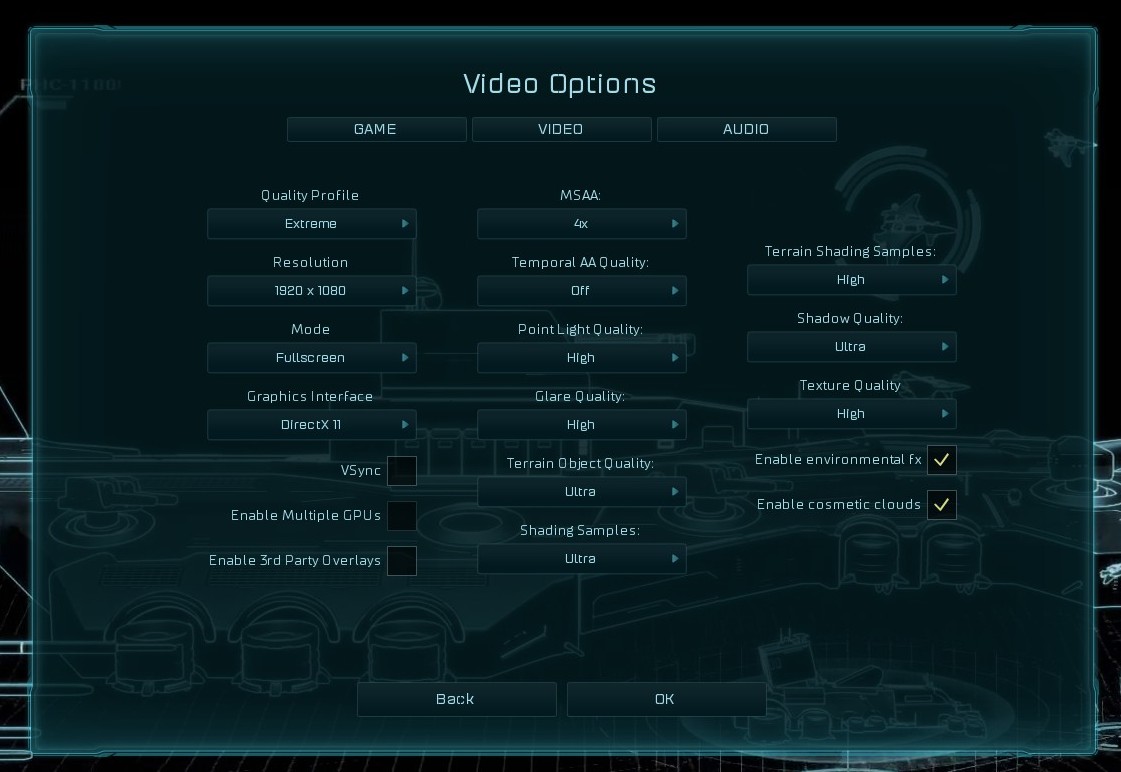
At both 1920x1080 and 4K resolutions, we run the same settings. Ashes has dropdown options for MSAA, Light Quality, Object Quality, Shading Samples, Shadow Quality, Textures, and separate options for the terrain. There are several presents, from Very Low to Extreme: we run our benchmarks at Extreme settings, and take the frame-time output for our average, percentile, and time under analysis.
All of our benchmark results can also be found in our benchmark engine, Bench.
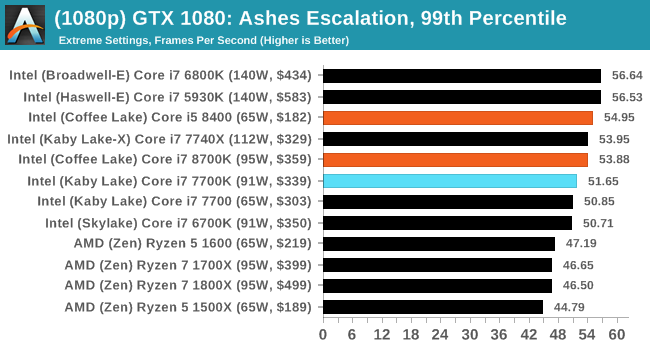
MSI GTX 1080 Gaming 8G Performance
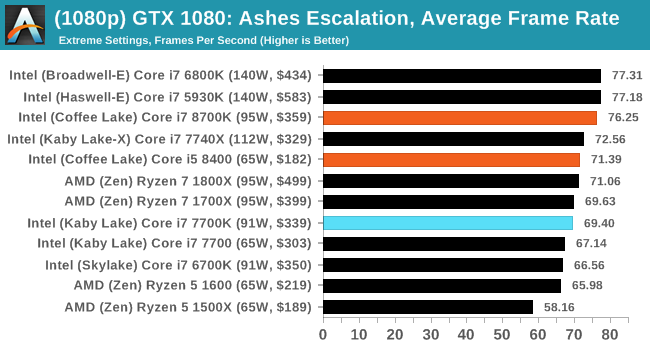
1080p
4K


222 Comments
View All Comments
mapesdhs - Monday, October 9, 2017 - link
I'm not sure. :D It's certainly annoying though. Worst part is searching for anything and then changing the list order to cheapest first, what a mess...SunnyNW - Thursday, October 5, 2017 - link
"That changes today."Anyone else read that and think that it is something we should have been reading ages ago?
Consumer technology is progressing slower than many expected and I feel the same way. Nonetheless I can't help but envision a Very near future where I'll be coming back and reading this article and being depressed at this level of technology all the while on my future monolithic many thousand core 3D processor ;)
KAlmquist - Friday, October 6, 2017 - link
Yes. A year ago this would have been an exciting development. Now it's just Intel remaining competitive against AMD's offerings.Valcoma - Thursday, October 5, 2017 - link
"The Core i5-8400 ($182) and Core i3-8350K ($169) sit near the Ryzen 5 1500X ($189) and the Ryzen 5 1400 ($169) respectively. Both the AMD parts are six cores and twelve threads, up against the 6C/6T Core i5 and the 4C/4T Core i3. The difference between the Ryzen 4 1400 and the Core i3-8350K would be interesting, given the extreme thread deficit between the two."Those AMD parts are 4 cores, 8 threads.
Ian Cutress - Thursday, October 5, 2017 - link
You're right, had a brain spasm while writing that bit. Updated.kpb321 - Thursday, October 5, 2017 - link
Still off"The difference between the Ryzen 5 1500X and the Core i3-8350K would be interesting, given the extreme thread deficit (12 threads vs 4) between the two."
the 1500X is a 4c8t processor so it effectively has hyper-threading over the i3-8350K while having a lower overclocking ceiling and lower ipc.
Zingam - Saturday, October 7, 2017 - link
Drinking too much Coffee, eh?hansmuff - Thursday, October 5, 2017 - link
Ian, I love the way the gaming benchmarks are listed. So easy to access and much less confusing than drop-downs or arrows. Nice job!Valcoma - Thursday, October 5, 2017 - link
Are you sure that the i5-7400 got 131 FPS average in benchmark 1 - Spine of the Mountain in Rise of the Tomb Raider? Besting all the other vastly superior processors?Looks like a typing error there or something went wrong with your benchmark (lower settings for example on that run).
Ian Cutress - Thursday, October 5, 2017 - link
I've mentioned it in several reviews in the past: RoTR stage 1 is heavily optimized for quad core. Check our Bench results - the top eight CPUs are all 4C/4T. The minute you add threads, the results plummet.https://www.anandtech.com/bench/CPU/1827