The AnandTech Coffee Lake Review: Initial Numbers on the Core i7-8700K and Core i5-8400
by Ian Cutress on October 5, 2017 9:00 AM EST- Posted in
- CPUs
- Intel
- Core i5
- Core i7
- Core i3
- 14nm
- Coffee Lake
- 14++
- Hex-Core
- Hyperthreading
Shadow of Mordor
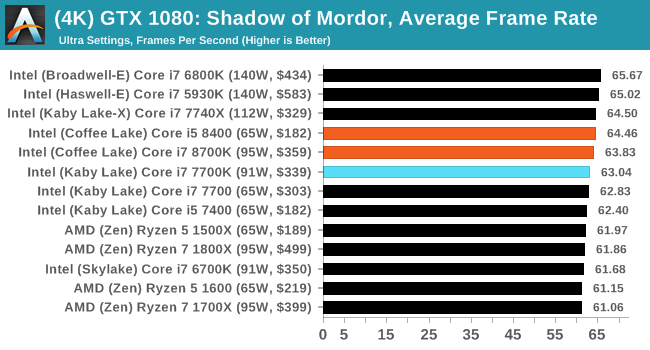
The next title in our testing is a battle of system performance with the open world action-adventure title, Middle Earth: Shadow of Mordor (SoM for short). Produced by Monolith and using the LithTech Jupiter EX engine and numerous detail add-ons, SoM goes for detail and complexity. The main story itself was written by the same writer as Red Dead Redemption, and it received Zero Punctuation’s Game of The Year in 2014.

A 2014 game is fairly old to be testing now, however SoM has a stable code and player base, and can still stress a PC down to the ones and zeroes. At the time, SoM was unique, offering a dynamic screen resolution setting allowing users to render at high resolutions that are then scaled down to the monitor. This form of natural oversampling was designed to let the user experience a truer vision of what the developers wanted, assuming you had the graphics hardware to power it but had a sub-4K monitor.
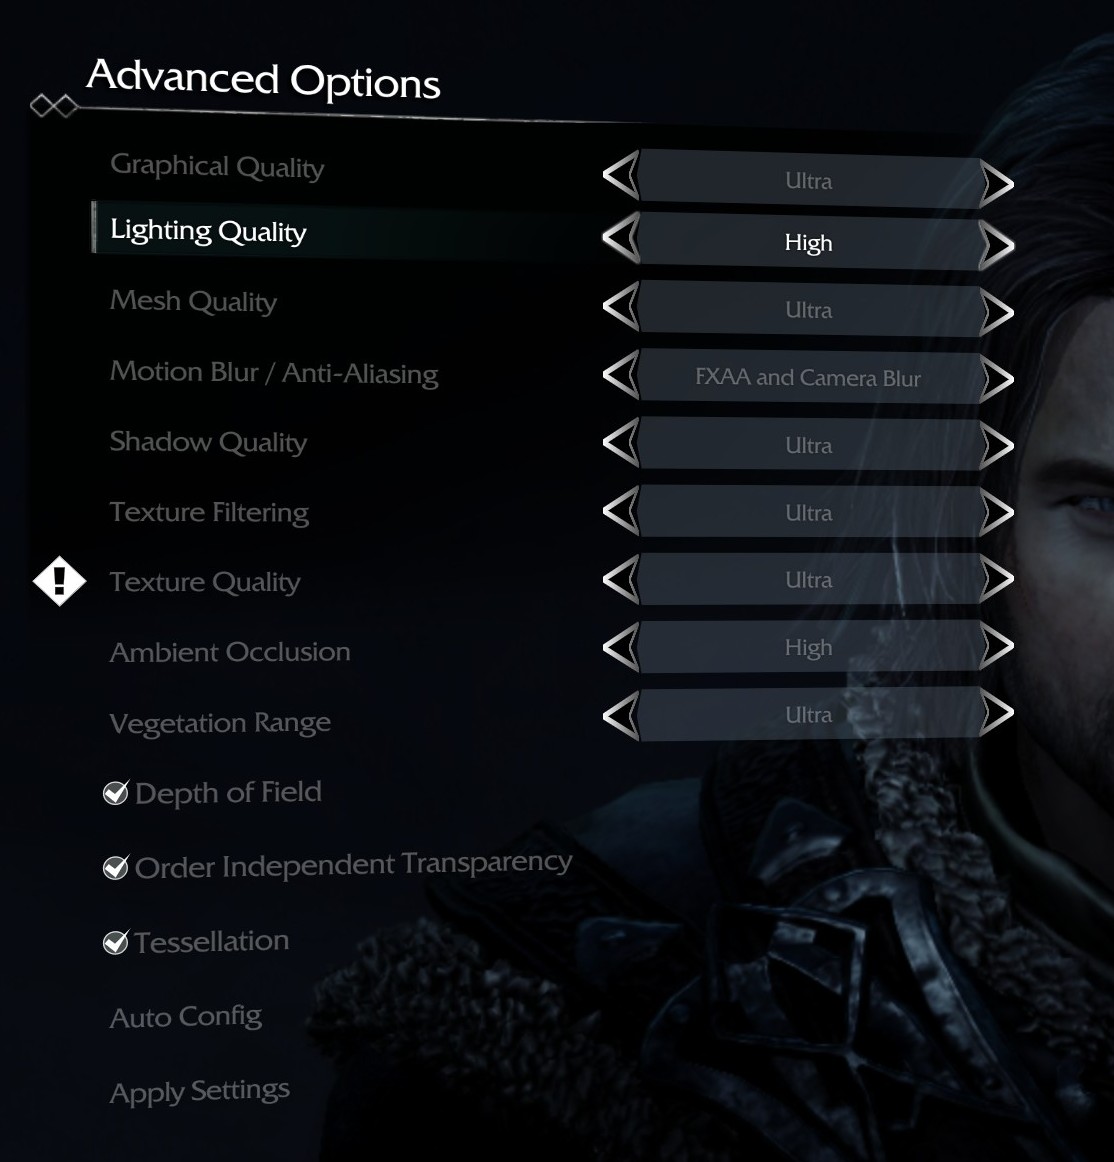
The title has an in-game benchmark, for which we run with an automated script implement the graphics settings, select the benchmark, and parse the frame-time output which is dumped on the drive. The graphics settings include standard options such as Graphical Quality, Lighting, Mesh, Motion Blur, Shadow Quality, Textures, Vegetation Range, Depth of Field, Transparency, and Tessellation. There are standard presets as well.
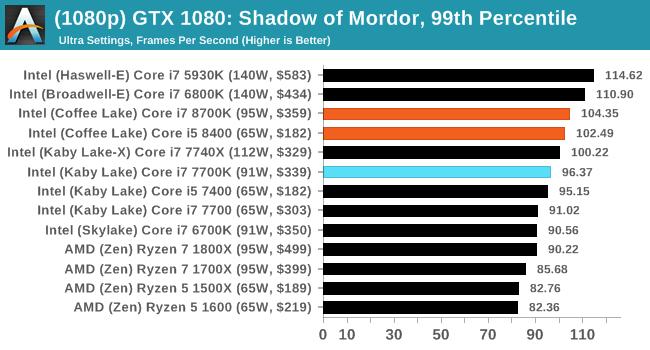
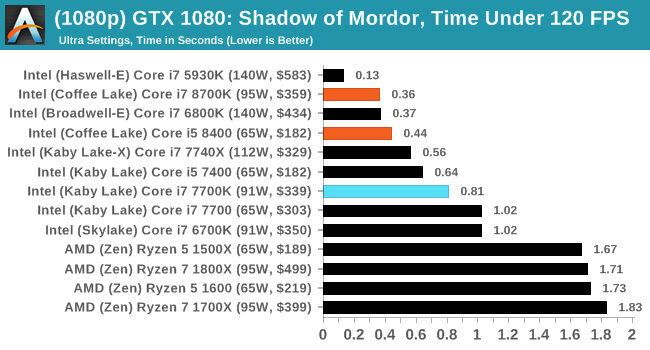
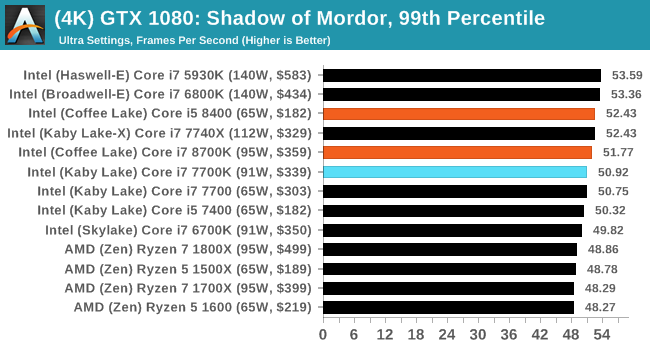
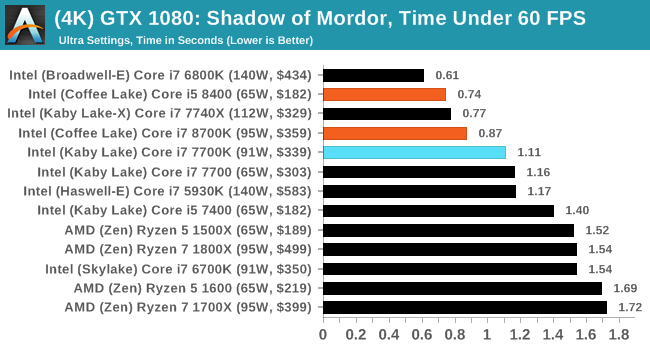
We run the benchmark at 1080p and a native 4K, using our 4K monitors, at the Ultra preset. Results are averaged across four runs and we report the average frame rate, 99th percentile frame rate, and time under analysis.
All of our benchmark results can also be found in our benchmark engine, Bench.
MSI GTX 1080 Gaming 8G Performance
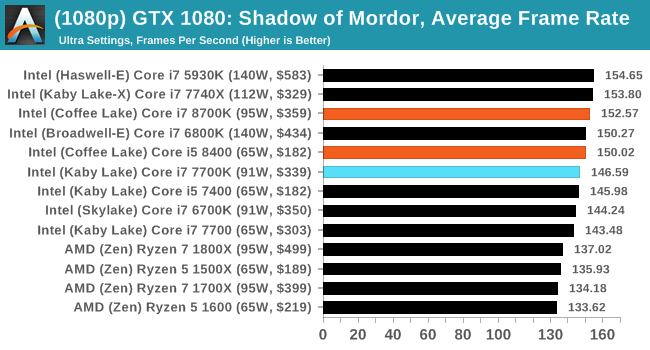
1080p
4K


222 Comments
View All Comments
Ian Cutress - Saturday, October 7, 2017 - link
That was a mistake on my part. On that I'm still mentally in an era where 150 MHz is a 10% gain. My quick mental arithmetic failed.ScottSoapbox - Thursday, October 5, 2017 - link
It's a shame you didn't compare it to the 7820X. I think it was expected that it would better the 7800X at least to some degree, so the more interesting comparison is how much performance does the added cost of 8 cores get you.Ryan Smith - Thursday, October 5, 2017 - link
The graphs were already getting ridiculously long. For something like that, be sure to look at Bench: https://www.anandtech.com/bench/product/1904?vs=20...realistz - Thursday, October 5, 2017 - link
AMD panic mode. Price drop imminent.Anonymous Blowhard - Thursday, October 5, 2017 - link
Price drop already happened. R7 1700X now USD$300 on Amazon.willis936 - Thursday, October 5, 2017 - link
I'd like to see the memory testing done on Ryzen done on coffee lake as well. It's clear that 2 DDR4 channels is not enough for 8 cores, at least with AMD's memory subsystem. Is it enough for 6 cores with Intel's memory subsystem? Also please be sure to use a GPU powerful enough to warrant even reporting the gaming results.bharatwd - Thursday, October 5, 2017 - link
Kabylake is faster than Coffeelake. where is the 15% increase? what is the point of + and ++ iteration when there is no improvement in performance? intel is just burning wafers for no reason. Better for them to go back to tick tock clock and stop wasting resources................SunnyNW - Thursday, October 5, 2017 - link
Honestly I'm not sure why Intel doesn't just keep fab lines for the 7th gen i5s going and just re-label into the 8th gen i3s and just bin differently, ie higher base/turbo.AleXopf - Thursday, October 5, 2017 - link
Thanks for the review Ian. Just one question. Why do you think power consumption differs so much with the data from techspot, were the 8700k consumes 190w, and it's on par with the 16c32t 1920x?Ian Cutress - Saturday, October 7, 2017 - link
Are they testing at-wall power consumption at stock? That might add a bunch.Our power numbers are just for the CPU, not the at wall - they are derived from the internal calibration tools that the processor uses to determine its own power P-states, which in effect is directly related to the turbo.
There seems to be a lot of boards that screw around with multi-core turbo this generation, which may also lead to higher power consumption numbers.