The AnandTech Coffee Lake Review: Initial Numbers on the Core i7-8700K and Core i5-8400
by Ian Cutress on October 5, 2017 9:00 AM EST- Posted in
- CPUs
- Intel
- Core i5
- Core i7
- Core i3
- 14nm
- Coffee Lake
- 14++
- Hex-Core
- Hyperthreading
Benchmarking Performance: CPU Encoding Tests
One of the interesting elements on modern processors is encoding performance. This includes encryption/decryption, as well as video transcoding from one video format to another. In the encrypt/decrypt scenario, this remains pertinent to on-the-fly encryption of sensitive data - a process by which more modern devices are leaning to for software security. Video transcoding as a tool to adjust the quality, file size and resolution of a video file has boomed in recent years, such as providing the optimum video for devices before consumption, or for game streamers who are wanting to upload the output from their video camera in real-time. As we move into live 3D video, this task will only get more strenuous, and it turns out that the performance of certain algorithms is a function of the input/output of the content.
All of our benchmark results can also be found in our benchmark engine, Bench.
7-Zip 9.2: link
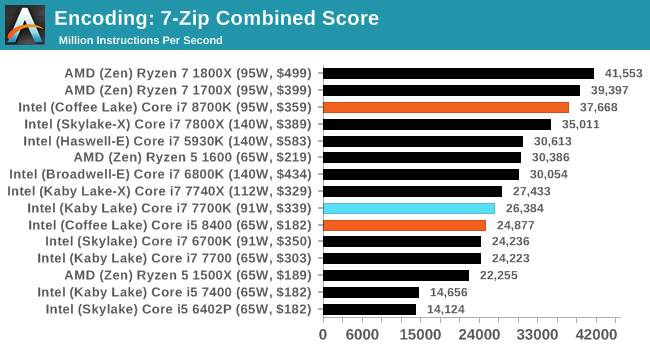
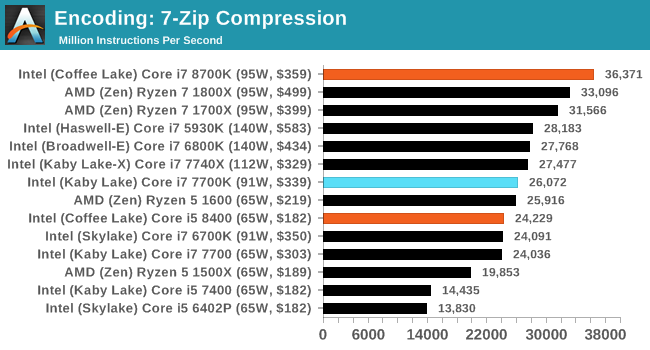
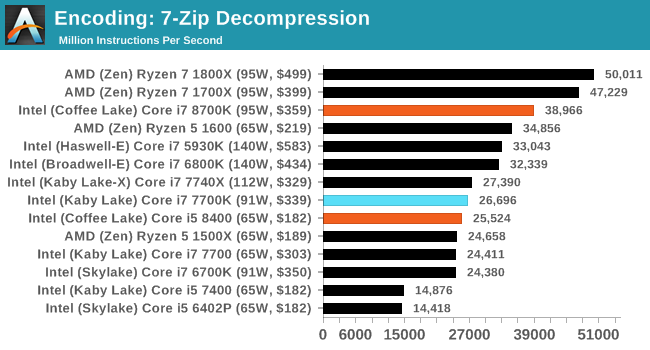
One of the freeware compression tools that offers good scaling performance between processors is 7-Zip. It runs under an open-source licence, is fast, and easy to use tool for power users. We run the benchmark mode via the command line for four loops and take the output score.
WinRAR 5.40: link
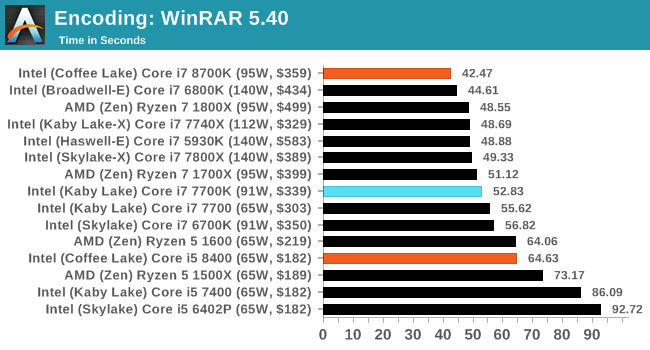
For the 2017 test suite, we move to the latest version of WinRAR in our compression test. WinRAR in some quarters is more user friendly that 7-Zip, hence its inclusion. Rather than use a benchmark mode as we did with 7-Zip, here we take a set of files representative of a generic stack (33 video files in 1.37 GB, 2834 smaller website files in 370 folders in 150 MB) of compressible and incompressible formats. The results shown are the time taken to encode the file. Due to DRAM caching, we run the test 10 times and take the average of the last five runs when the benchmark is in a steady state.
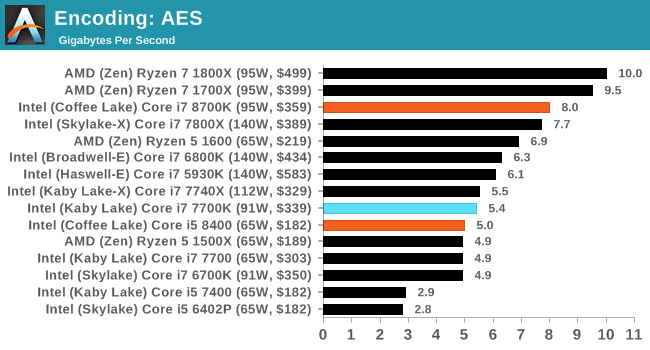
AES Encoding
Algorithms using AES coding have spread far and wide as a ubiquitous tool for encryption. Again, this is another CPU limited test, and modern CPUs have special AES pathways to accelerate their performance. We often see scaling in both frequency and cores with this benchmark. We use the latest version of TrueCrypt and run its benchmark mode over 1GB of in-DRAM data. Results shown are the GB/s average of encryption and decryption.
HandBrake v1.0.2 H264 and HEVC: link
As mentioned above, video transcoding (both encode and decode) is a hot topic in performance metrics as more and more content is being created. First consideration is the standard in which the video is encoded, which can be lossless or lossy, trade performance for file-size, trade quality for file-size, or all of the above can increase encoding rates to help accelerate decoding rates. Alongside Google's favorite codec, VP9, there are two others that are taking hold: H264, the older codec, is practically everywhere and is designed to be optimized for 1080p video, and HEVC (or H265) that is aimed to provide the same quality as H264 but at a lower file-size (or better quality for the same size). HEVC is important as 4K is streamed over the air, meaning less bits need to be transferred for the same quality content.
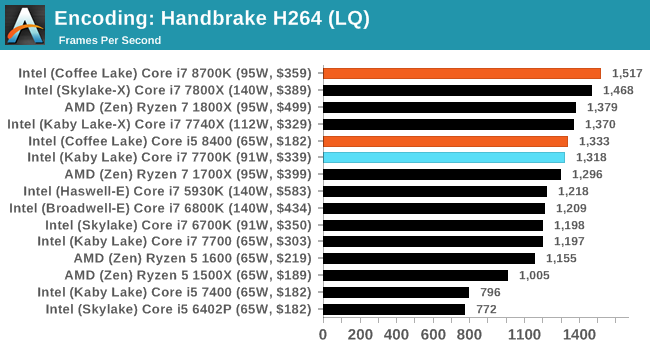
Handbrake is a favored tool for transcoding, and so our test regime takes care of three areas.
Low Quality/Resolution H264: Here we transcode a 640x266 H264 rip of a 2 hour film, and change the encoding from Main profile to High profile, using the very-fast preset.
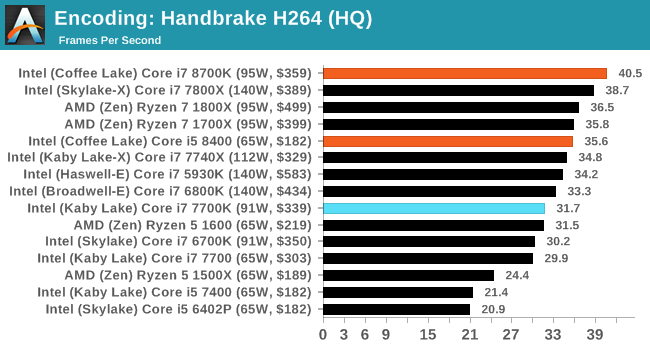
High Quality/Resolution H264: A similar test, but this time we take a ten-minute double 4K (3840x4320) file running at 60 Hz and transcode from Main to High, using the very-fast preset.
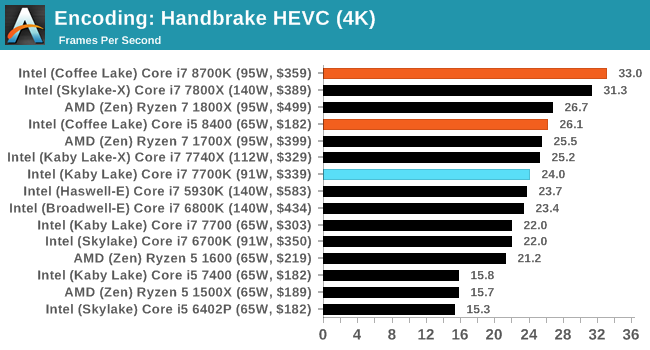
HEVC Test: Using the same video in HQ, we change the resolution and codec of the original video from 4K60 in H264 into 4K60 HEVC.


222 Comments
View All Comments
Ian Cutress - Saturday, October 7, 2017 - link
That was a mistake on my part. On that I'm still mentally in an era where 150 MHz is a 10% gain. My quick mental arithmetic failed.ScottSoapbox - Thursday, October 5, 2017 - link
It's a shame you didn't compare it to the 7820X. I think it was expected that it would better the 7800X at least to some degree, so the more interesting comparison is how much performance does the added cost of 8 cores get you.Ryan Smith - Thursday, October 5, 2017 - link
The graphs were already getting ridiculously long. For something like that, be sure to look at Bench: https://www.anandtech.com/bench/product/1904?vs=20...realistz - Thursday, October 5, 2017 - link
AMD panic mode. Price drop imminent.Anonymous Blowhard - Thursday, October 5, 2017 - link
Price drop already happened. R7 1700X now USD$300 on Amazon.willis936 - Thursday, October 5, 2017 - link
I'd like to see the memory testing done on Ryzen done on coffee lake as well. It's clear that 2 DDR4 channels is not enough for 8 cores, at least with AMD's memory subsystem. Is it enough for 6 cores with Intel's memory subsystem? Also please be sure to use a GPU powerful enough to warrant even reporting the gaming results.bharatwd - Thursday, October 5, 2017 - link
Kabylake is faster than Coffeelake. where is the 15% increase? what is the point of + and ++ iteration when there is no improvement in performance? intel is just burning wafers for no reason. Better for them to go back to tick tock clock and stop wasting resources................SunnyNW - Thursday, October 5, 2017 - link
Honestly I'm not sure why Intel doesn't just keep fab lines for the 7th gen i5s going and just re-label into the 8th gen i3s and just bin differently, ie higher base/turbo.AleXopf - Thursday, October 5, 2017 - link
Thanks for the review Ian. Just one question. Why do you think power consumption differs so much with the data from techspot, were the 8700k consumes 190w, and it's on par with the 16c32t 1920x?Ian Cutress - Saturday, October 7, 2017 - link
Are they testing at-wall power consumption at stock? That might add a bunch.Our power numbers are just for the CPU, not the at wall - they are derived from the internal calibration tools that the processor uses to determine its own power P-states, which in effect is directly related to the turbo.
There seems to be a lot of boards that screw around with multi-core turbo this generation, which may also lead to higher power consumption numbers.