The AnandTech Coffee Lake Review: Initial Numbers on the Core i7-8700K and Core i5-8400
by Ian Cutress on October 5, 2017 9:00 AM EST- Posted in
- CPUs
- Intel
- Core i5
- Core i7
- Core i3
- 14nm
- Coffee Lake
- 14++
- Hex-Core
- Hyperthreading
Grand Theft Auto V
The highly anticipated iteration of the Grand Theft Auto franchise hit the shelves on April 14th 2015, with both AMD and NVIDIA in tow to help optimize the title. GTA doesn’t provide graphical presets, but opens up the options to users and extends the boundaries by pushing even the hardest systems to the limit using Rockstar’s Advanced Game Engine under DirectX 11. Whether the user is flying high in the mountains with long draw distances or dealing with assorted trash in the city, when cranked up to maximum it creates stunning visuals but hard work for both the CPU and the GPU.
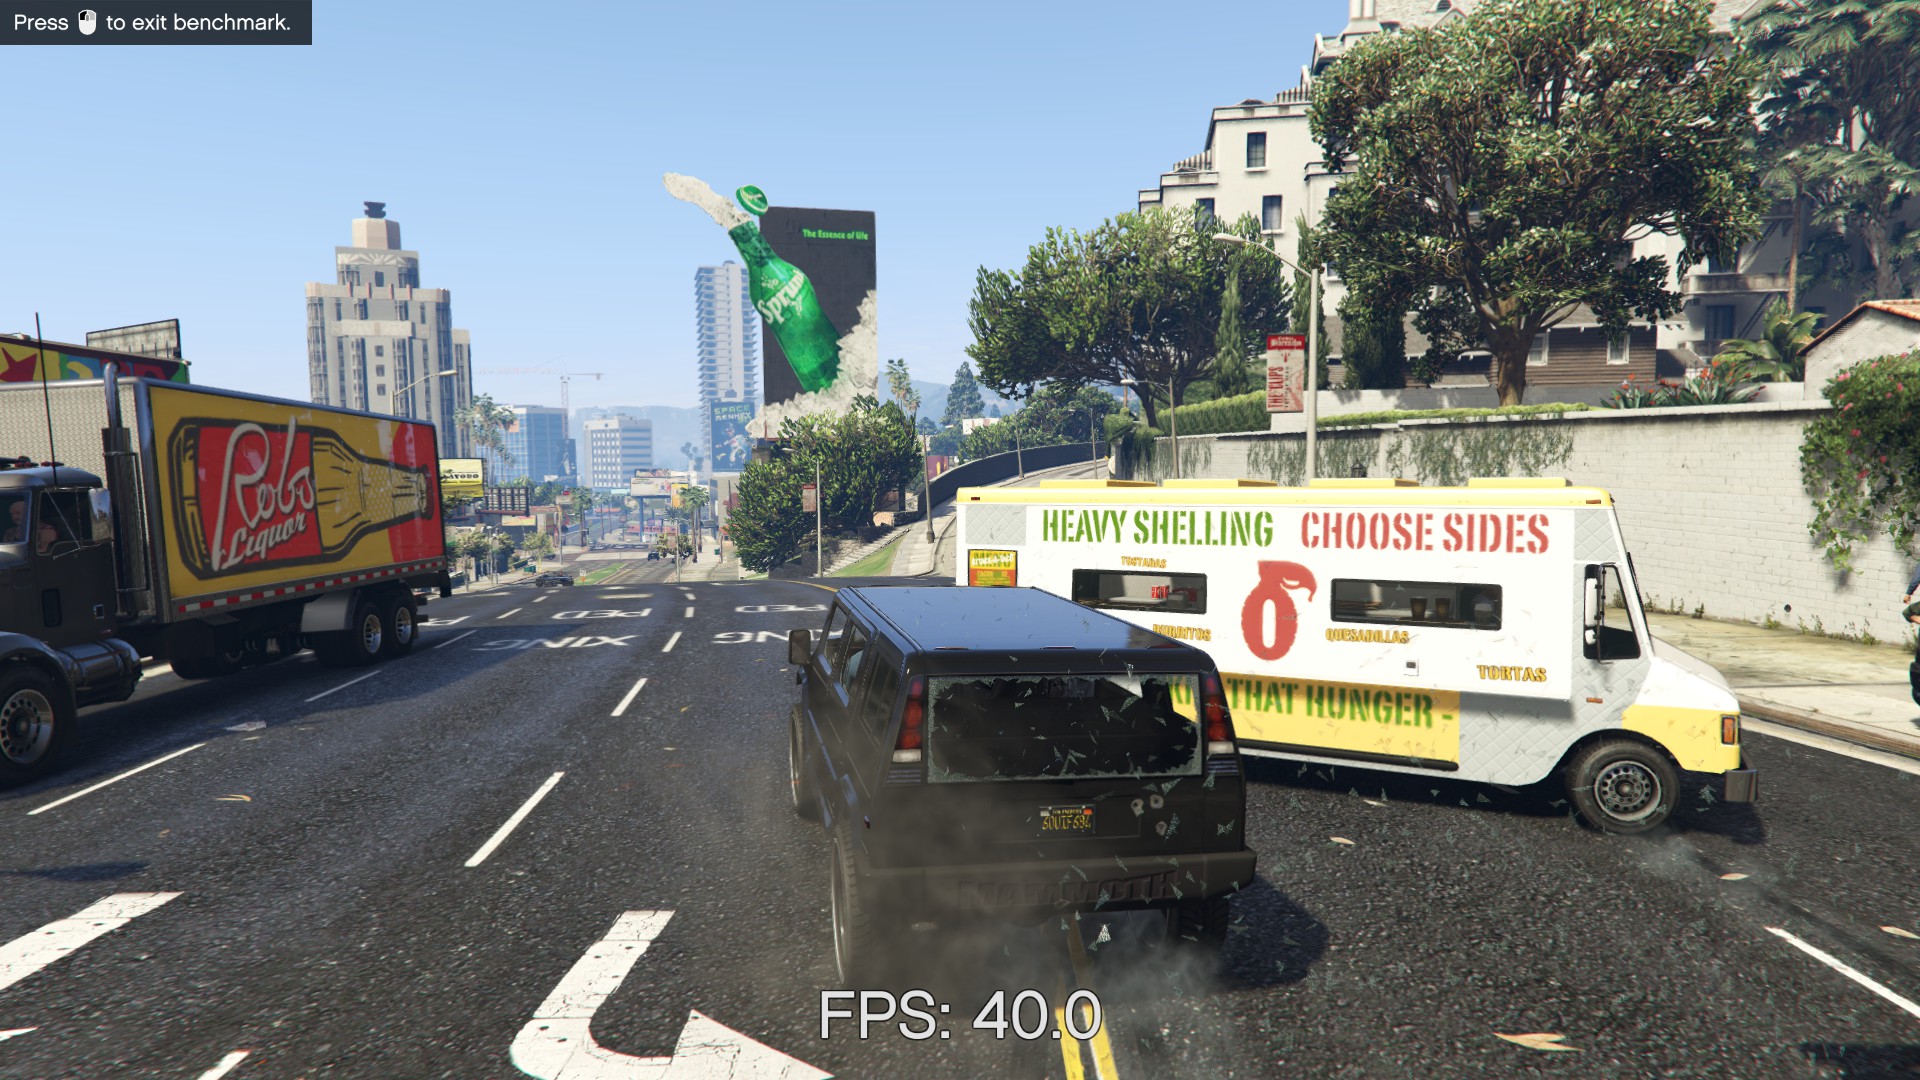
For our test we have scripted a version of the in-game benchmark. The in-game benchmark consists of five scenarios: four short panning shots with varying lighting and weather effects, and a fifth action sequence that lasts around 90 seconds. We use only the final part of the benchmark, which combines a flight scene in a jet followed by an inner city drive-by through several intersections followed by ramming a tanker that explodes, causing other cars to explode as well. This is a mix of distance rendering followed by a detailed near-rendering action sequence, and the title thankfully spits out frame time data.
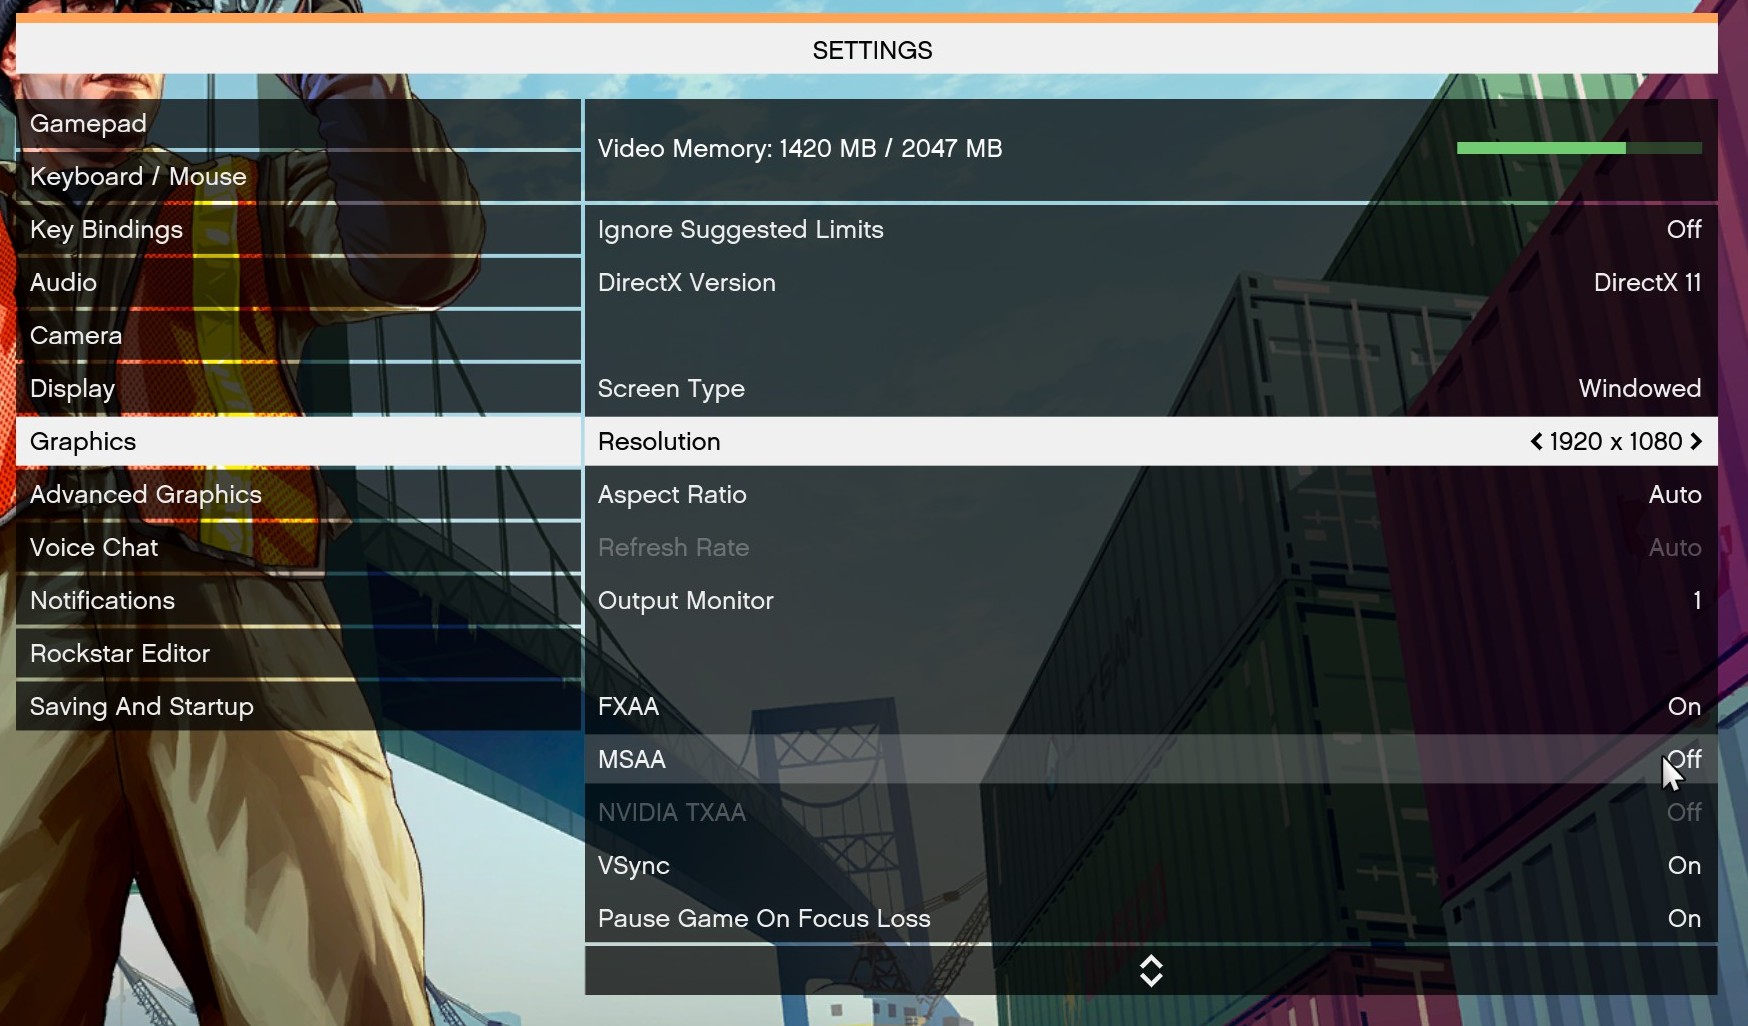
There are no presets for the graphics options on GTA, allowing the user to adjust options such as population density and distance scaling on sliders, but others such as texture/shadow/shader/water quality from Low to Very High. Other options include MSAA, soft shadows, post effects, shadow resolution and extended draw distance options. There is a handy option at the top which shows how much video memory the options are expected to consume, with obvious repercussions if a user requests more video memory than is present on the card (although there’s no obvious indication if you have a low-end GPU with lots of GPU memory, like an R7 240 4GB).
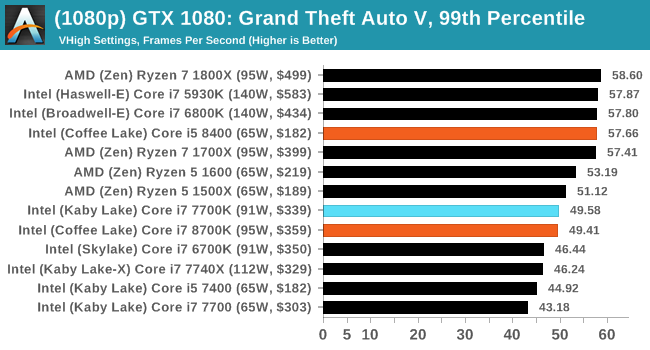
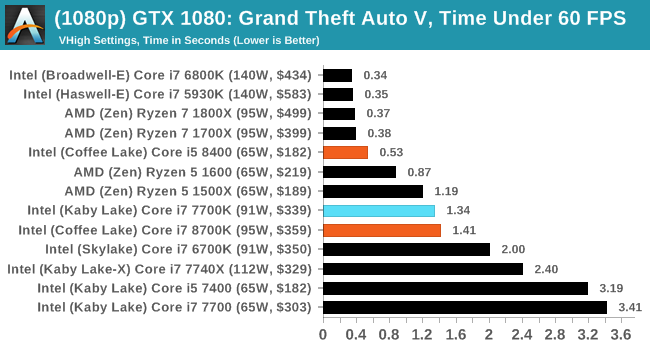
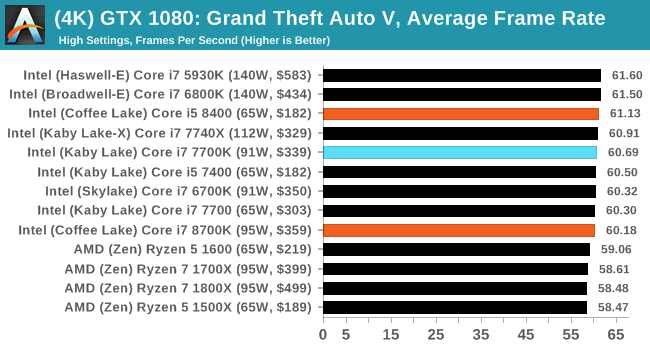
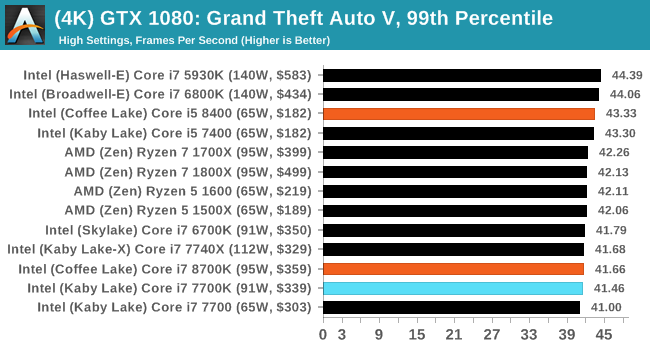
To that end, we run the benchmark at 1920x1080 using an average of Very High on the settings, and also at 4K using High on most of them. We take the average results of four runs, reporting frame rate averages, 99th percentiles, and our time under analysis.
All of our benchmark results can also be found in our benchmark engine, Bench.
MSI GTX 1080 Gaming 8G Performance
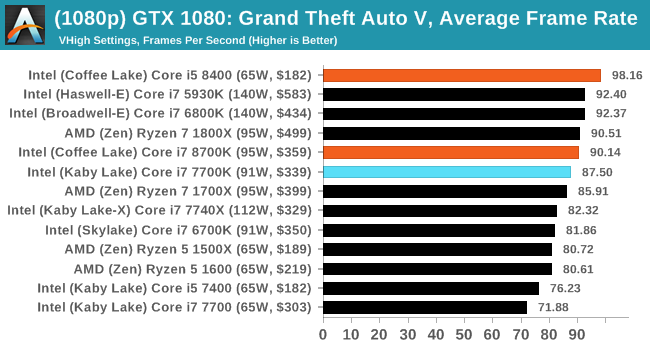
1080p
4K


222 Comments
View All Comments
zuber - Thursday, October 5, 2017 - link
I disagree, he mentioned pretty much all the info you need to know about the CPU.The choice of GPU is hardly even relevant to CPU tests anymore. For gaming performance my 6 year old i7-2600K is neck and neck (or faster in some cases) than this new crop of CPUs.
mapesdhs - Friday, October 6, 2017 - link
And if you do need more cores you can always move sideways to a very low cost SB-E or IB-EP. I built a 4.8GHz 2700K system for a friend two years ago, am upgrading it soon to a 3930K at the same clock, replacing the M4E mbd with an R4E, swapping the RAM kits (2x8GB for 4x4GB, both 2400MHz), total cost 200 UKP. 8) And the both mbds now have the option of booting from NVMe.Newer CPUs can have a distinct advantage for some types of 1080p gaming, but with newer GPUs the frame rates are usually so high it really doesn't matter. Move up the scale of resolution/complexity and quickly it becomes apparent there's plenty of life left in SB, etc. zuber, at what clock are you running your 2600K? Also note that P67/Z68 can benefit aswell from faster RAM if you're only using 1600 or less atm.
Itveryhotinhere - Thursday, October 5, 2017 - link
Not yet have power consumption graph ?Ryan Smith - Thursday, October 5, 2017 - link
It's there: https://www.anandtech.com/show/11859/the-anandtech...Itveryhotinhere - Thursday, October 5, 2017 - link
ThanksItveryhotinhere - Thursday, October 5, 2017 - link
That power consumption at full load already use boost or only at base clock ?Ian Cutress - Thursday, October 5, 2017 - link
All-core turbo, as always.SunnyNW - Thursday, October 5, 2017 - link
Can you please tell me how you got to the +20% frequency for CPU B in the twitter poll?mkaibear - Friday, October 6, 2017 - link
Yeah that doesn't make a lot of sense to me either.CPU A is the 8600K. Runs at a base of 3.6 and an all-core turbo of 4.1.
CPU B is the 8700. Runs at a base of 3.2 and an all-core turbo of 4.3.
That's either 11% slower (base) or about 5% faster (all-core turbo). Neither is 20%!
If you compare the base speed of the 8600K and the all-core turbo speed of the 8700 then you get about 19.4% which is close enough to 20% I suppose but that's not really a fair comparison?
sonny73n - Friday, October 6, 2017 - link
Nice pointing that out. But there still were about 1,800 blind votes ;)