The AnandTech Coffee Lake Review: Initial Numbers on the Core i7-8700K and Core i5-8400
by Ian Cutress on October 5, 2017 9:00 AM EST- Posted in
- CPUs
- Intel
- Core i5
- Core i7
- Core i3
- 14nm
- Coffee Lake
- 14++
- Hex-Core
- Hyperthreading
Ashes of the Singularity Escalation
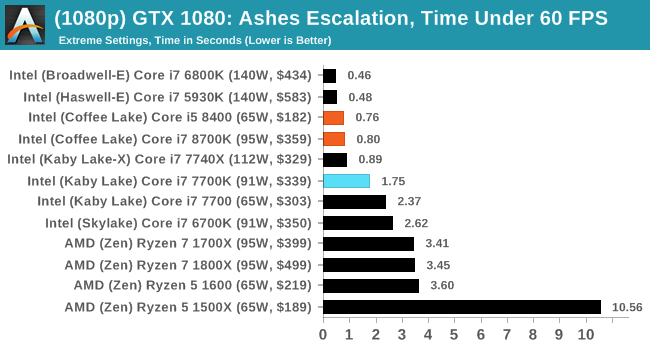
Seen as the holy child of DirectX12, Ashes of the Singularity (AoTS, or just Ashes) has been the first title to actively go explore as many of DirectX12s features as it possibly can. Stardock, the developer behind the Nitrous engine which powers the game, has ensured that the real-time strategy title takes advantage of multiple cores and multiple graphics cards, in as many configurations as possible.
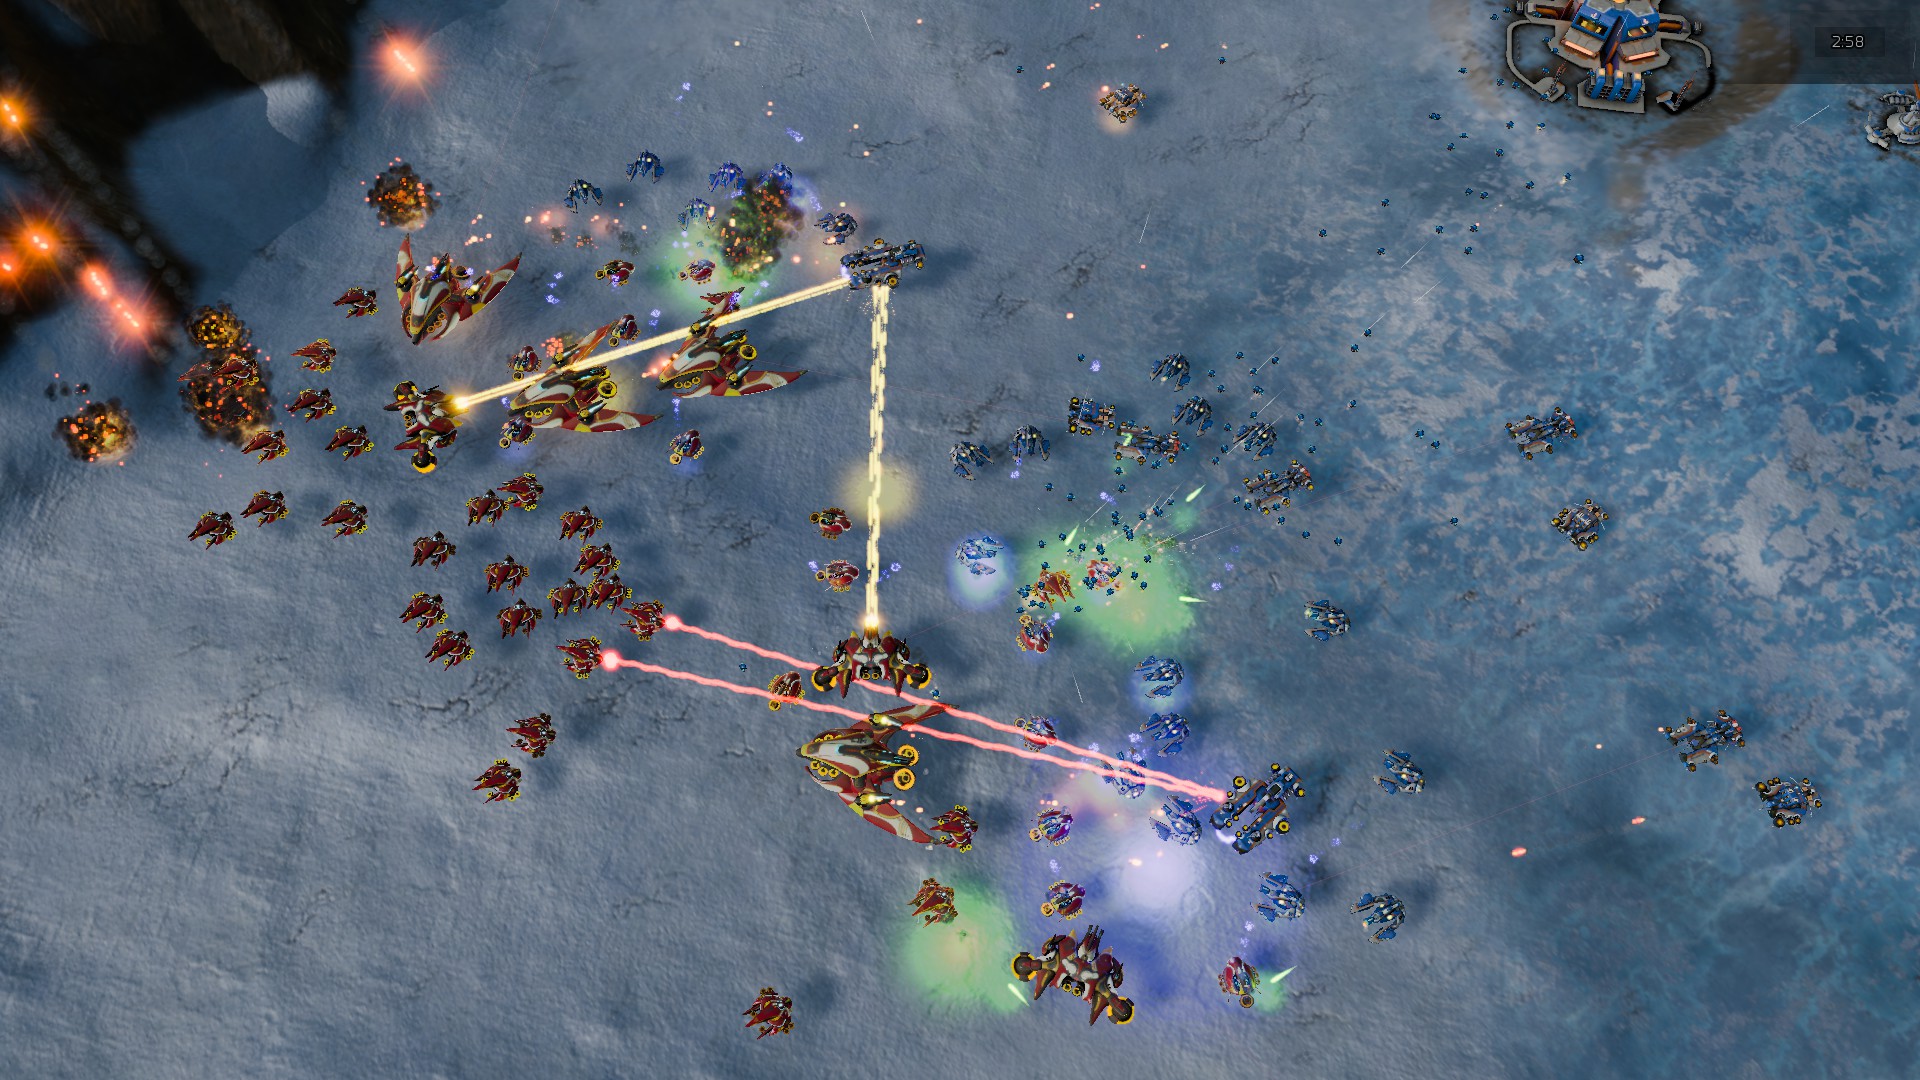
As a real-time strategy title, Ashes is all about responsiveness during both wide open shots but also concentrated battles. With DirectX12 at the helm, the ability to implement more draw calls per second allows the engine to work with substantial unit depth and effects that other RTS titles had to rely on combined draw calls to achieve, making some combined unit structures ultimately very rigid.
Stardock clearly understand the importance of an in-game benchmark, ensuring that such a tool was available and capable from day one, especially with all the additional DX12 features used and being able to characterize how they affected the title for the developer was important. The in-game benchmark performs a four-minute fixed seed battle environment with a variety of shots, and outputs a vast amount of data to analyze.
For our benchmark, we run a fixed v2.11 version of the game due to some peculiarities of the splash screen added after the merger with the standalone Escalation expansion, and have an automated tool to call the benchmark on the command line. (Prior to v2.11, the benchmark also supported 8K/16K testing, however v2.11 has odd behavior which nukes this.)
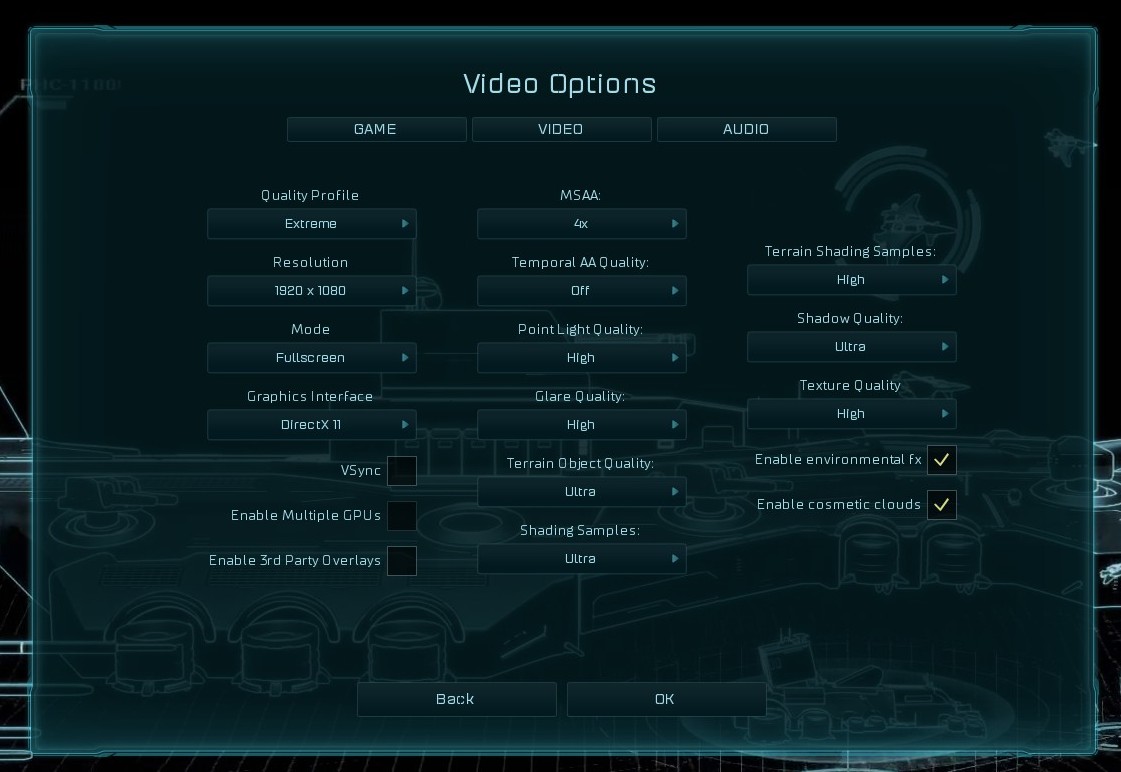
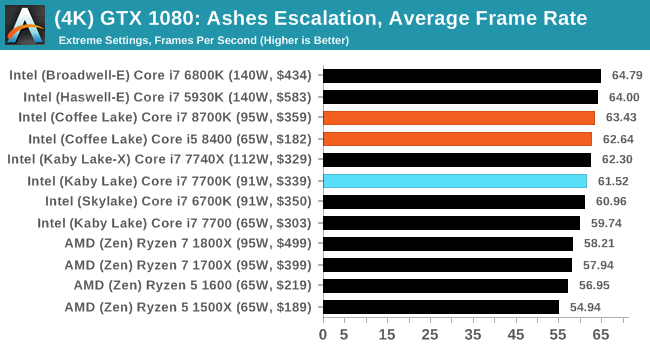
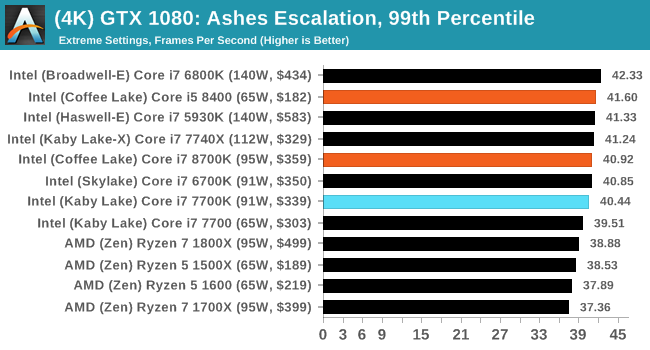
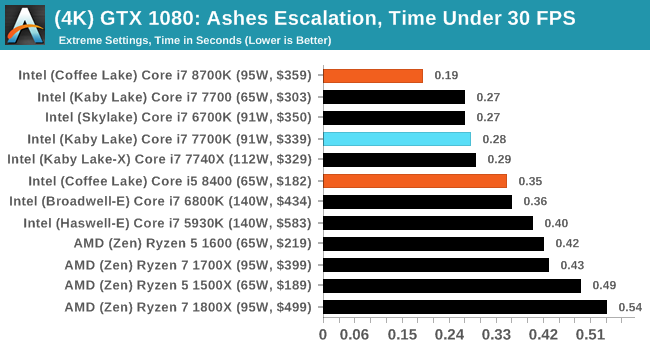
At both 1920x1080 and 4K resolutions, we run the same settings. Ashes has dropdown options for MSAA, Light Quality, Object Quality, Shading Samples, Shadow Quality, Textures, and separate options for the terrain. There are several presents, from Very Low to Extreme: we run our benchmarks at Extreme settings, and take the frame-time output for our average, percentile, and time under analysis.
All of our benchmark results can also be found in our benchmark engine, Bench.
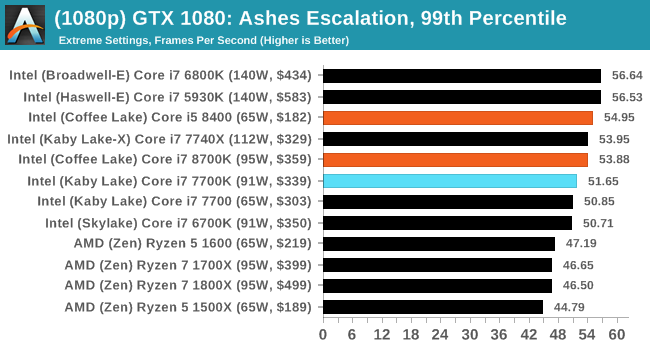
MSI GTX 1080 Gaming 8G Performance
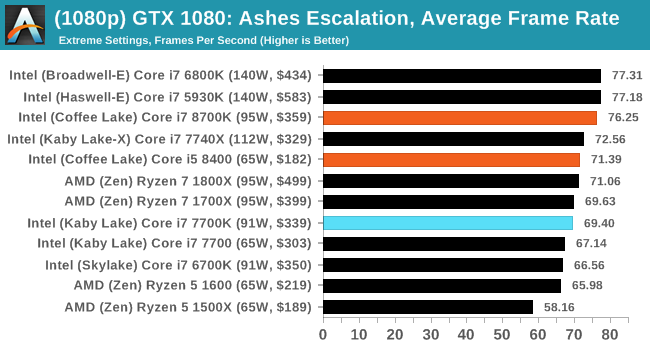
1080p
4K


222 Comments
View All Comments
zuber - Thursday, October 5, 2017 - link
I disagree, he mentioned pretty much all the info you need to know about the CPU.The choice of GPU is hardly even relevant to CPU tests anymore. For gaming performance my 6 year old i7-2600K is neck and neck (or faster in some cases) than this new crop of CPUs.
mapesdhs - Friday, October 6, 2017 - link
And if you do need more cores you can always move sideways to a very low cost SB-E or IB-EP. I built a 4.8GHz 2700K system for a friend two years ago, am upgrading it soon to a 3930K at the same clock, replacing the M4E mbd with an R4E, swapping the RAM kits (2x8GB for 4x4GB, both 2400MHz), total cost 200 UKP. 8) And the both mbds now have the option of booting from NVMe.Newer CPUs can have a distinct advantage for some types of 1080p gaming, but with newer GPUs the frame rates are usually so high it really doesn't matter. Move up the scale of resolution/complexity and quickly it becomes apparent there's plenty of life left in SB, etc. zuber, at what clock are you running your 2600K? Also note that P67/Z68 can benefit aswell from faster RAM if you're only using 1600 or less atm.
Itveryhotinhere - Thursday, October 5, 2017 - link
Not yet have power consumption graph ?Ryan Smith - Thursday, October 5, 2017 - link
It's there: https://www.anandtech.com/show/11859/the-anandtech...Itveryhotinhere - Thursday, October 5, 2017 - link
ThanksItveryhotinhere - Thursday, October 5, 2017 - link
That power consumption at full load already use boost or only at base clock ?Ian Cutress - Thursday, October 5, 2017 - link
All-core turbo, as always.SunnyNW - Thursday, October 5, 2017 - link
Can you please tell me how you got to the +20% frequency for CPU B in the twitter poll?mkaibear - Friday, October 6, 2017 - link
Yeah that doesn't make a lot of sense to me either.CPU A is the 8600K. Runs at a base of 3.6 and an all-core turbo of 4.1.
CPU B is the 8700. Runs at a base of 3.2 and an all-core turbo of 4.3.
That's either 11% slower (base) or about 5% faster (all-core turbo). Neither is 20%!
If you compare the base speed of the 8600K and the all-core turbo speed of the 8700 then you get about 19.4% which is close enough to 20% I suppose but that's not really a fair comparison?
sonny73n - Friday, October 6, 2017 - link
Nice pointing that out. But there still were about 1,800 blind votes ;)