The AnandTech Coffee Lake Review: Initial Numbers on the Core i7-8700K and Core i5-8400
by Ian Cutress on October 5, 2017 9:00 AM EST- Posted in
- CPUs
- Intel
- Core i5
- Core i7
- Core i3
- 14nm
- Coffee Lake
- 14++
- Hex-Core
- Hyperthreading
Benchmarking Performance: CPU Legacy Tests
Our legacy tests represent benchmarks that were once at the height of their time. Some of these are industry standard synthetics, and we have data going back over 10 years. All of the data here has been rerun on Windows 10, and we plan to go back several generations of components to see how performance has evolved.
All of our benchmark results can also be found in our benchmark engine, Bench.
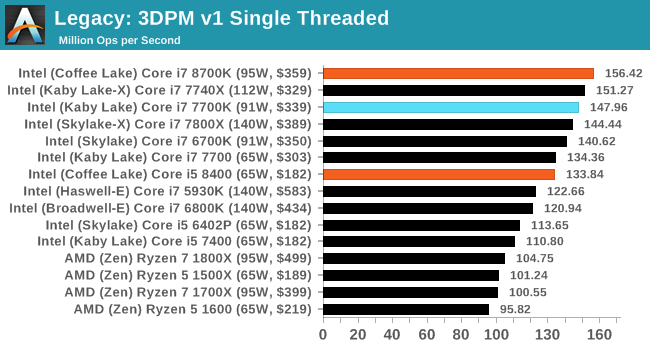
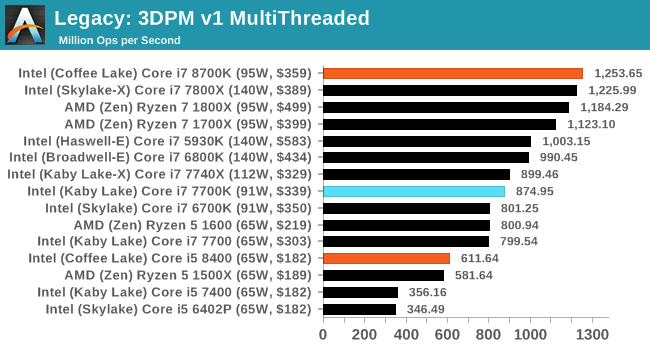
3D Particle Movement v1
3DPM is a self-penned benchmark, taking basic 3D movement algorithms used in Brownian Motion simulations and testing them for speed. High floating point performance, MHz and IPC wins in the single thread version, whereas the multithread version has to handle the threads and loves more cores. This is the original version, written in the style of a typical non-computer science student coding up an algorithm for their theoretical problem, and comes without any non-obvious optimizations not already performed by the compiler, such as false sharing.
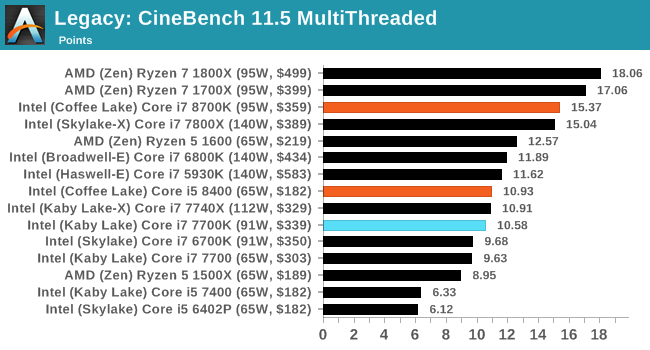
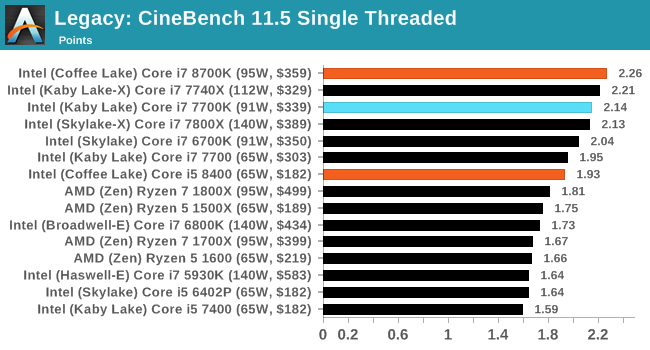
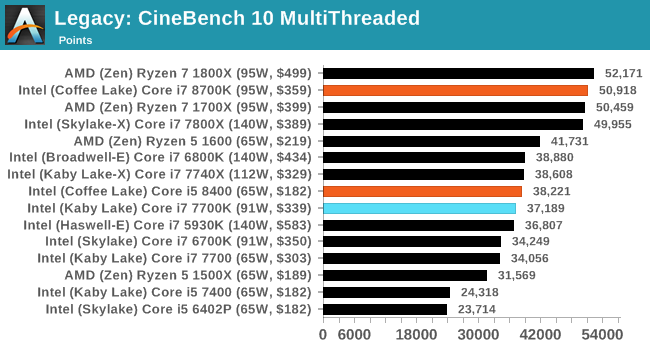
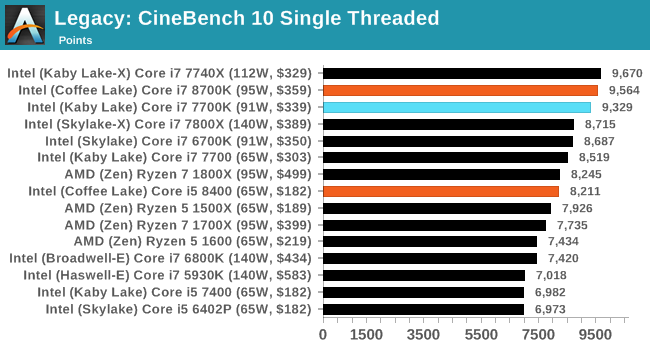
CineBench 11.5 and 10
Cinebench is a widely known benchmarking tool for measuring performance relative to MAXON's animation software Cinema 4D. Cinebench has been optimized over a decade and focuses on purely CPU horsepower, meaning if there is a discrepancy in pure throughput characteristics, Cinebench is likely to show that discrepancy. Arguably other software doesn't make use of all the tools available, so the real world relevance might purely be academic, but given our large database of data for Cinebench it seems difficult to ignore a small five minute test. We run the modern version 15 in this test, as well as the older 11.5 and 10 due to our back data.
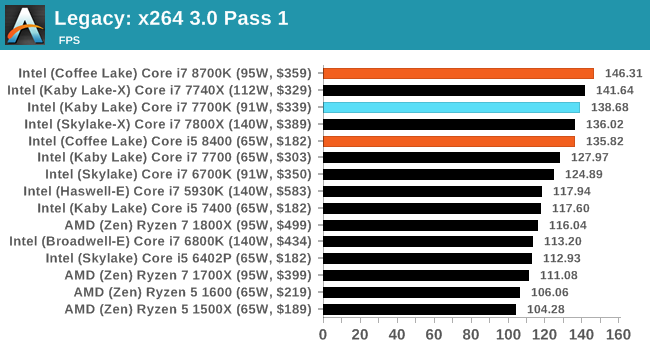
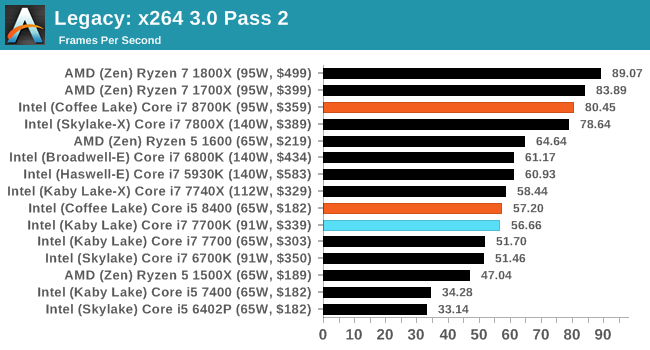
x264 HD 3.0
Similarly, the x264 HD 3.0 package we use here is also kept for historic regressional data. The latest version is 5.0.1, and encodes a 1080p video clip into a high quality x264 file. Version 3.0 only performs the same test on a 720p file, and in most circumstances the software performance hits its limit on high end processors, but still works well for mainstream and low-end. Also, this version only takes a few minutes, whereas the latest can take over 90 minutes to run.


222 Comments
View All Comments
Ian Cutress - Saturday, October 7, 2017 - link
That was a mistake on my part. On that I'm still mentally in an era where 150 MHz is a 10% gain. My quick mental arithmetic failed.ScottSoapbox - Thursday, October 5, 2017 - link
It's a shame you didn't compare it to the 7820X. I think it was expected that it would better the 7800X at least to some degree, so the more interesting comparison is how much performance does the added cost of 8 cores get you.Ryan Smith - Thursday, October 5, 2017 - link
The graphs were already getting ridiculously long. For something like that, be sure to look at Bench: https://www.anandtech.com/bench/product/1904?vs=20...realistz - Thursday, October 5, 2017 - link
AMD panic mode. Price drop imminent.Anonymous Blowhard - Thursday, October 5, 2017 - link
Price drop already happened. R7 1700X now USD$300 on Amazon.willis936 - Thursday, October 5, 2017 - link
I'd like to see the memory testing done on Ryzen done on coffee lake as well. It's clear that 2 DDR4 channels is not enough for 8 cores, at least with AMD's memory subsystem. Is it enough for 6 cores with Intel's memory subsystem? Also please be sure to use a GPU powerful enough to warrant even reporting the gaming results.bharatwd - Thursday, October 5, 2017 - link
Kabylake is faster than Coffeelake. where is the 15% increase? what is the point of + and ++ iteration when there is no improvement in performance? intel is just burning wafers for no reason. Better for them to go back to tick tock clock and stop wasting resources................SunnyNW - Thursday, October 5, 2017 - link
Honestly I'm not sure why Intel doesn't just keep fab lines for the 7th gen i5s going and just re-label into the 8th gen i3s and just bin differently, ie higher base/turbo.AleXopf - Thursday, October 5, 2017 - link
Thanks for the review Ian. Just one question. Why do you think power consumption differs so much with the data from techspot, were the 8700k consumes 190w, and it's on par with the 16c32t 1920x?Ian Cutress - Saturday, October 7, 2017 - link
Are they testing at-wall power consumption at stock? That might add a bunch.Our power numbers are just for the CPU, not the at wall - they are derived from the internal calibration tools that the processor uses to determine its own power P-states, which in effect is directly related to the turbo.
There seems to be a lot of boards that screw around with multi-core turbo this generation, which may also lead to higher power consumption numbers.