The Intel Core i9-7980XE and Core i9-7960X CPU Review Part 1: Workstation
by Ian Cutress on September 25, 2017 3:01 AM ESTBenchmarking Performance: CPU System Tests
Our first set of tests is our general system tests. These set of tests are meant to emulate more about what people usually do on a system, like opening large files or processing small stacks of data. This is a bit different to our office testing, which uses more industry standard benchmarks, and a few of the benchmarks here are relatively new and different.
All of our benchmark results can also be found in our benchmark engine, Bench.
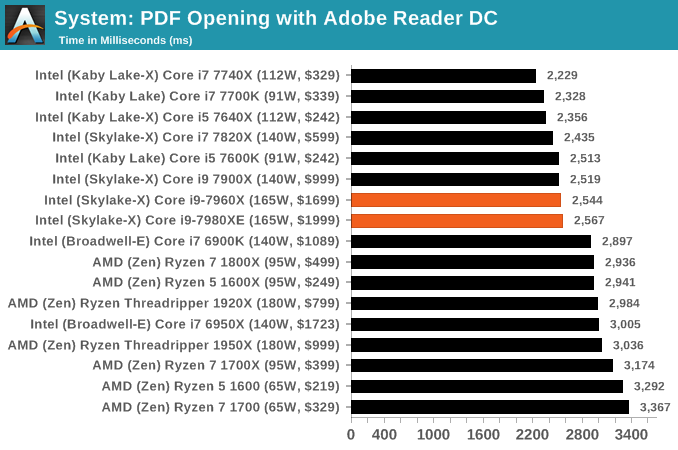
PDF Opening
First up is a self-penned test using a monstrous PDF we once received in advance of attending an event. While the PDF was only a single page, it had so many high-quality layers embedded it was taking north of 15 seconds to open and to gain control on the mid-range notebook I was using at the time. This put it as a great candidate for our 'let's open an obnoxious PDF' test. Here we use Adobe Reader DC, and disable all the update functionality within. The benchmark sets the screen to 1080p, opens the PDF to in fit-to-screen mode, and measures the time from sending the command to open the PDF until it is fully displayed and the user can take control of the software again. The test is repeated ten times, and the average time taken. Results are in milliseconds.
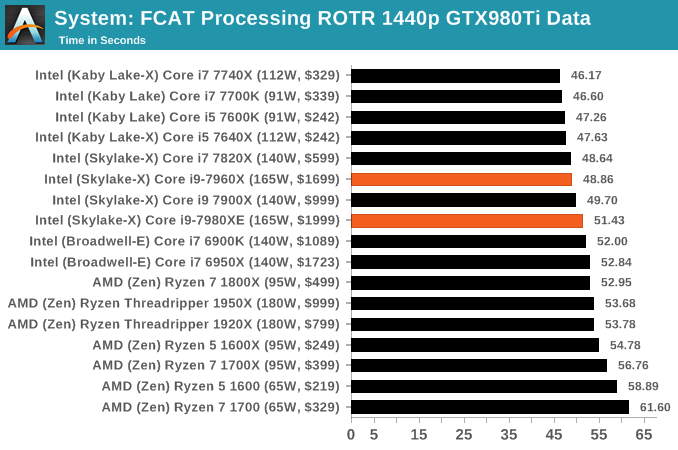
FCAT Processing: link
One of the more interesting workloads that has crossed our desks in recent quarters is FCAT - the tool we use to measure stuttering in gaming due to dropped or runt frames. The FCAT process requires enabling a color-based overlay onto a game, recording the gameplay, and then parsing the video file through the analysis software. The software is mostly single-threaded, however because the video is basically in a raw format, the file size is large and requires moving a lot of data around. For our test, we take a 90-second clip of the Rise of the Tomb Raider benchmark running on a GTX 980 Ti at 1440p, which comes in around 21 GB, and measure the time it takes to process through the visual analysis tool.
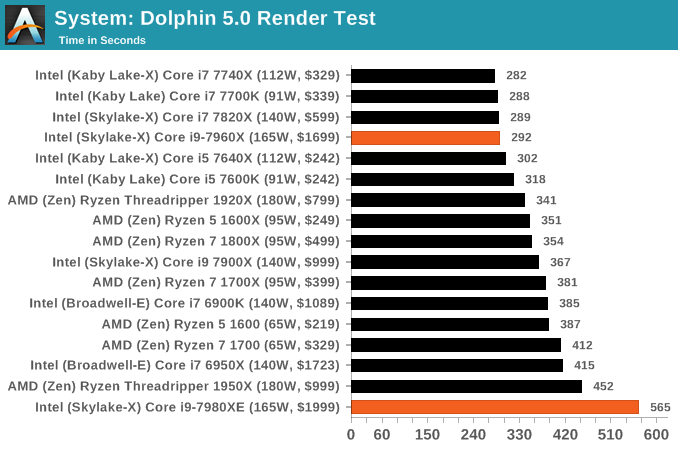
Dolphin Benchmark: link
Many emulators are often bound by single thread CPU performance, and general reports tended to suggest that Haswell provided a significant boost to emulator performance. This benchmark runs a Wii program that ray traces a complex 3D scene inside the Dolphin Wii emulator. Performance on this benchmark is a good proxy of the speed of Dolphin CPU emulation, which is an intensive single core task using most aspects of a CPU. Results are given in minutes, where the Wii itself scores 17.53 minutes.
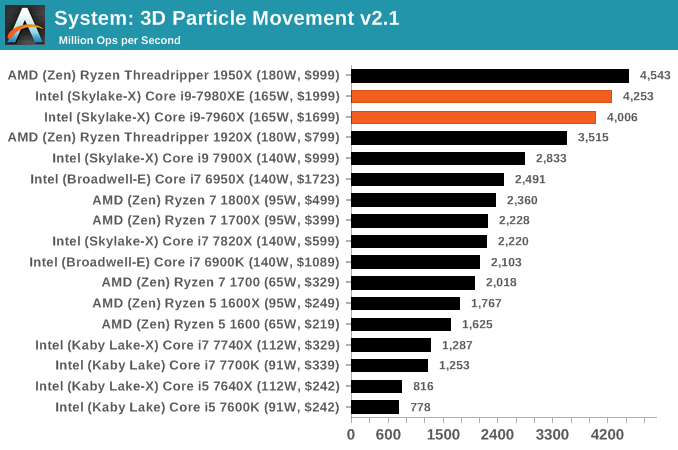
3D Movement Algorithm Test v2.1: link
This is the latest version of the self-penned 3DPM benchmark. The goal of 3DPM is to simulate semi-optimized scientific algorithms taken directly from my doctorate thesis. Version 2.1 improves over 2.0 by passing the main particle structs by reference rather than by value, and decreasing the amount of double->float->double recasts the compiler was adding in. It affords a ~25% speed-up over v2.0, which means new data.
DigiCortex v1.20: link
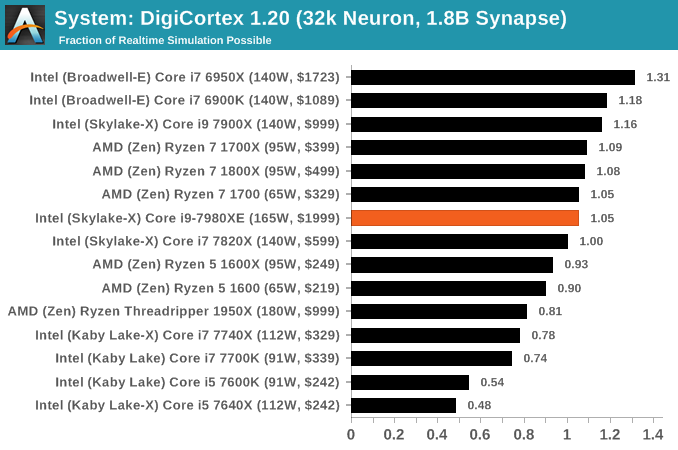
Despite being a couple of years old, the DigiCortex software is a pet project for the visualization of neuron and synapse activity in the brain. The software comes with a variety of benchmark modes, and we take the small benchmark which runs a 32k neuron/1.8B synapse simulation. The results on the output are given as a fraction of whether the system can simulate in real-time, so anything above a value of one is suitable for real-time work. The benchmark offers a 'no firing synapse' mode, which in essence detects DRAM and bus speed, however we take the firing mode which adds CPU work with every firing.
Agisoft Photoscan 1.3.3: link
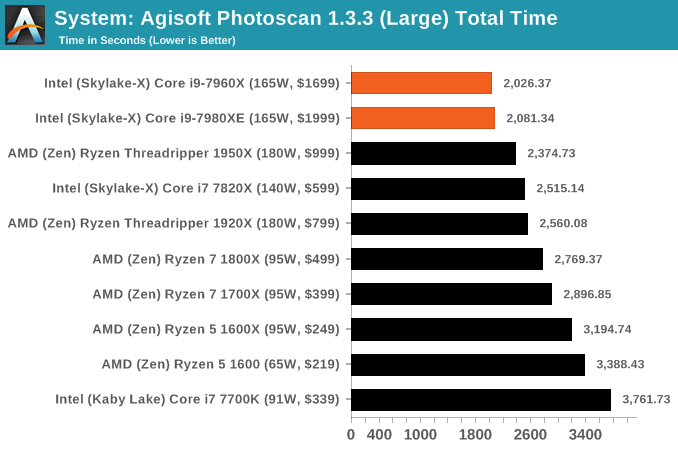
Photoscan stays in our benchmark suite from the previous version, however now we are running on Windows 10 so features such as Speed Shift on the latest processors come into play. The concept of Photoscan is translating many 2D images into a 3D model - so the more detailed the images, and the more you have, the better the model. The algorithm has four stages, some single threaded and some multi-threaded, along with some cache/memory dependency in there as well. For some of the more variable threaded workload, features such as Speed Shift and XFR will be able to take advantage of CPU stalls or downtime, giving sizeable speedups on newer microarchitectures.


152 Comments
View All Comments
Krysto - Monday, September 25, 2017 - link
Yes, it's total bullshit that they are misinterpreting what TDP is. I imagine this is how they'll get away with claiming a lower TDP than the real one in the 8700k chip, too, which has low base clock speed, but the super-high Turbo-Boost, which probably means the REAL TDP will go through the rough when that Turbo Boost is maximized.This is how Intel will get to claim that its chips are still faster than AMD "at the same TDP" (wink wink, nudge nudge).
Demigod79 - Monday, September 25, 2017 - link
"What a load of ignorance. Intel tdp is *average* power at *base* clocks, uses more power at all core turbo clocks here. Disable turbo if that's too much power for you."I find it ironic that you would call someone ignorant, then reveal your own ignorance about the TDP and turbo clocks.
Spunjji - Monday, September 25, 2017 - link
It is now, it wasn't before. Wanna bet on how many people noticed?SodaAnt - Monday, September 25, 2017 - link
I'm quite curious what happens if your system cooling simply can't handle it. I suspect if you designed a cooling solution which only supported 165W the CPU would simply throttle itself, but I'm curious by how much.ZeDestructor - Monday, September 25, 2017 - link
Strictly speaking, all forms of Turbo boost are a form of vendor-sanctioned overclocking. The fact that measured power goes beyond TDP when at max all-core turbo should really not be all that surprising. The ~36% increase in power for ~31% increase in clocks is pretty reasonable and inline when you keep that in mind. Especially when you factor that there has to have been a bit of extra voltage added for stability reasons (power scales linearly with clocks and current, and quadratically to exponentially with voltage).Demigod79 - Monday, September 25, 2017 - link
I agree. Everything looked good until that page. 190 watts is unacceptable, and Intel needs to correct this right away - either make the CPU run within the TDP limit, or update the TDP to 190 watts in the specs.HStewart - Monday, September 25, 2017 - link
It funny that people complain about CPU watts but never about external GPU watts. Keep in mind the GPU is smaller amount of area.artk2219 - Monday, September 25, 2017 - link
They most certainly do, that is one of the biggest gripes against Vega 64, people do seem to have short memory on how high GPU TDP's used to be however.IGTrading - Tuesday, September 26, 2017 - link
On a video card, the same manufacturer takes responsibility for the GPU, cooling system, design, PCB, components and warranty.On the CPU, you have somebody else designing the cooling system, the motherboard, the power lines and they all have to offer warranty for their components while Intel is only concerned with the CPU.
If the CPU is throttling or burnt out, they will say "sufficient cooling was not provided" and so on ...
It is a whole lot different.
whatevs - Tuesday, September 26, 2017 - link
Thermal throttling is not a burn out and not a warranty event, you don't get to warranty your gpu when it throttles under load, cooling warranty does not include cpu/gpu chip performance andIntel designed the ATX specification and the electrical specification for the boards.
You clearly don't know the things you're talking about.