Retesting AMD Ryzen Threadripper’s Game Mode: Halving Cores for More Performance
by Ian Cutress on August 17, 2017 12:01 PM ESTCPU System Tests
Our first set of tests is our general system tests. These set of tests are meant to emulate more about what people usually do on a system, like opening large files or processing small stacks of data. This is a bit different to our office testing, which uses more industry standard benchmarks, and a few of the benchmarks here are relatively new and different.
All of our benchmark results can also be found in our benchmark engine, Bench.
PDF Opening
First up is a self-penned test using a monstrous PDF we once received in advance of attending an event. While the PDF was only a single page, it had so many high-quality layers embedded it was taking north of 15 seconds to open and to gain control on the mid-range notebook I was using at the time. This put it as a great candidate for our 'let's open an obnoxious PDF' test. Here we use Adobe Reader DC, and disable all the update functionality within. The benchmark sets the screen to 1080p, opens the PDF to in fit-to-screen mode, and measures the time from sending the command to open the PDF until it is fully displayed and the user can take control of the software again. The test is repeated ten times, and the average time taken. Results are in milliseconds.
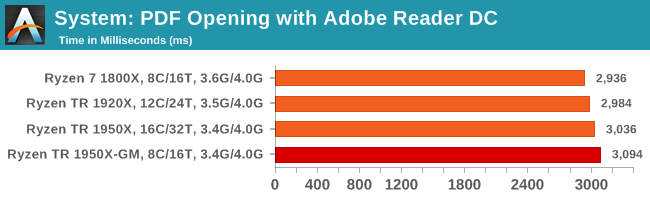
There's not much between the Threadripper CPUs here, but frequency wins the day.
FCAT Processing: link
One of the more interesting workloads that has crossed our desks in recent quarters is FCAT - the tool we use to measure and visually analyze stuttering in gaming due to dropped or runt frames. The FCAT process requires enabling a color-based overlay onto a game, recording the gameplay, and then parsing the video file through the analysis software. The software is mostly single-threaded, however because the video is basically in a raw format, the file size is large and requires moving a lot of data around. For our test, we take a 90-second clip of the Rise of the Tomb Raider benchmark running on a GTX 980 Ti at 1440p, which comes in around 21 GB, and measure the time it takes to process through the visual analysis tool.
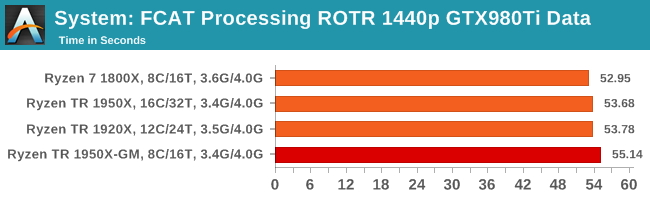
Similar to PDF opening, single threaded performance wins out.
Dolphin Benchmark: link
Many emulators are often bound by single thread CPU performance, and general reports tended to suggest that Haswell provided a significant boost to emulator performance. This benchmark runs a Wii program that ray traces a complex 3D scene inside the Dolphin Wii emulator. Performance on this benchmark is a good proxy of the speed of Dolphin CPU emulation, which is an intensive single core task using most aspects of a CPU. Results are given in minutes, where the Wii itself scores 17.53 minutes.
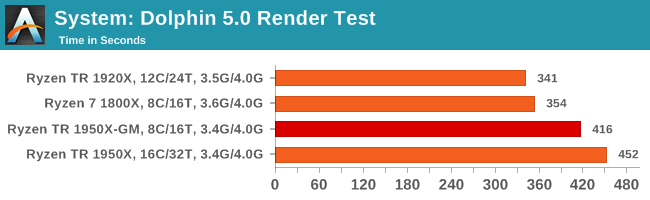
Dolphin likes single thread performance as well, although interpreting this graph is giving me somewhat of a headache. Game Mode seems to give a small improvement here.
3D Movement Algorithm Test v2.1: link
This is the latest version of the self-penned 3DPM benchmark. The goal of 3DPM is to simulate semi-optimized scientific algorithms taken directly from my doctorate thesis. Version 2.1 improves over 2.0 by passing the main particle structs by reference rather than by value, and decreasing the amount of double->float->double recasts the compiler was adding in. It affords a ~25% speed-up over v2.0, which means new data.
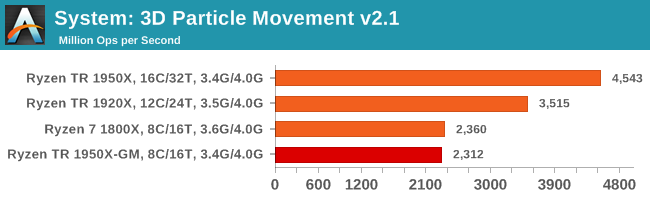
Our first pure multithreaded test, and the 1950X wins with 32 threads. The 1920X beats the 1950X in Game mode, due to 24 threads beating 16 cores. The 1800X edges out the 1950X-GM due to frequency.
DigiCortex v1.20: link
Despite being a couple of years old, the DigiCortex software is a pet project for the visualization of neuron and synapse activity in the brain. The software comes with a variety of benchmark modes, and we take the small benchmark which runs a 32k neuron/1.8B synapse simulation. The results on the output are given as a fraction of whether the system can simulate in real-time, so anything above a value of one is suitable for real-time work. The benchmark offers a 'no firing synapse' mode, which in essence detects DRAM and bus speed, however we take the firing mode which adds CPU work with every firing.
Unfortunately we had issues with the 1920X posting a result.
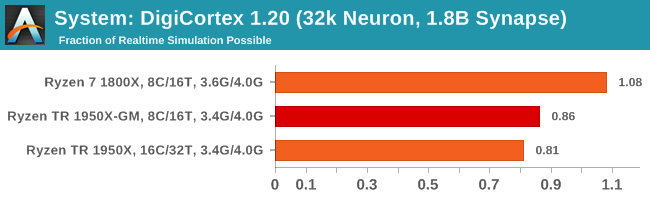
DigiCortex requires a mash of CPU frequency and DRAM performance to get a good result, although the 1950X in any mode regresses the result, even in Game Mode, suggesting it is more sensitive to overall DRAM latency.
Agisoft Photoscan 1.0: link
Photoscan stays in our benchmark suite from the previous version, however now we are running on Windows 10 so features such as Speed Shift on the latest processors come into play. The concept of Photoscan is translating many 2D images into a 3D model - so the more detailed the images, and the more you have, the better the model. The algorithm has four stages, some single threaded and some multi-threaded, along with some cache/memory dependency in there as well. For some of the more variable threaded workload, features such as Speed Shift and XFR will be able to take advantage of CPU stalls or downtime, giving sizeable speedups on newer microarchitectures.
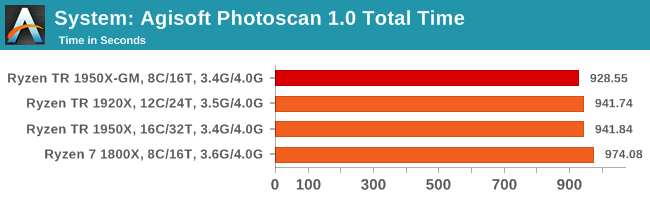
The variable threaded nature of Agisoft shows that in our workflow, it's a mix of cores, IPC and frequency required to win. The quad-channel memory and lower crosstalk of the 1950X in Game Mode seems to get a marginal improvement over the 1950X.


104 Comments
View All Comments
silverblue - Friday, August 18, 2017 - link
I'd like to see what happens when you manually set a 2+2+2+2 core configuration, instead of enabling Game Mode. From what I've read, Game Mode destroys memory bandwidth but yields better latency, however it's not answering whether Zen cores can really benefit from the extra bandwidth that a quad-channel memory interface affords.Alternatively, just clock the 1950 and 1920 identically, and see if the 1920's per-core performance is any higher.
KAlmquist - Friday, August 18, 2017 - link
“One of the interesting data points in our test is the Compile. Because <B>this test requires a lot of cross-core communication</B> and DRAM, we get an interesting metric where the 1950X still comes out on top due to the core counts, but because the 1920X has fewer cores per CCX, it actually falls behind the 1950X in Game Mode and the 1800X despite having more cores.”Generally speaking, copmpilers are single threaded, so the parallelism in a software build comes from compiling multiple source files in parallel, meaning the cross-core communication is minimal. I have no idea what MSVC is doing here, can you explain? In any case, while I appreciate you including a software development benchmark, the one you've chosen would seem to provide no useful information to anyone who doesn't use MSVC.
peevee - Friday, August 18, 2017 - link
I use MSVC and it scales pretty well if you are using it right. They are doing something wrong.KAlmquist - Saturday, August 19, 2017 - link
Thanks. It makes sense that MSVC would scale about as well as any other build environment.ARS Technica also benchmarked a Chromium build, which I think uses MSVC, but uses the Google tools GN and Ninja to manage the build. They get:
Ryzen 1800X (8 cores) - 9.8 build/day
Threadripper 1920X (12 cores) - 16.7 build/day
Threadripper 1950X (16 cores) - 18.6 build/day
Very good speedup with the 1920X over the 1800X, but not so much going from the 1920X to the 1950X. Perhaps the benchmark is dependent on memory bandwidth and L3 cache.
Timur Born - Friday, August 18, 2017 - link
Thanks for the tests!I would have liked to see a combination of both being tested: Game Mode to switch off the second die and SMT disabled. That way 4 full physical cores with low latency memory access would have run the games.
Hopefully modern titles don't benefit from this, but some more "legacy" ones might like this setup even more.
Timur Born - Friday, August 18, 2017 - link
Sorry, I meant 8 cores, aka 8/8 cores mode.mat9v - Friday, August 18, 2017 - link
I wish someone had an inclination to test creative mode but with games pinned to one module. It is essentially NUMA mode but with all cores active.Or just enable SMT that is disabled in Gaming Mode - we actually then get a Ryzen 1800X CPU that overclocks well but with possibly higher performance due to all system task running on different module (if we configure system that way) and unencumbered access to more PCIEx lines.
peevee - Friday, August 18, 2017 - link
Yes, that would be interesting.c:\>start /REALTIME /NODE 0 /AFFINITY 5555 you_game_here.exe
mat9v - Friday, August 18, 2017 - link
I think I would start it on node 1 is anything since system task would be at default running on node 0.Mask 5555? Wouldn't it be AAAA - for 8 cores (8 threads) and FFFF for 8 cores (16 threads)?
peevee - Friday, August 18, 2017 - link
The mask 5555 assumes that SMT is enabled. Otherwise it should be FF.When SMT is enabled, 5555 and AAAA will allocate threads to the same cores, just different logical CPUs.
Where system threads will be run is system dependent, nothing prevents Windows from running them on NODE 1. /NODE 0 allows to run whether or not you actually have multiple NUMA nodes.
With /REALTIME Windows will have hard time allocating anything on those logical CPUs, but can use the same cores with other logical CPUs, so yes, technically it will affect results. But unless you load it with something, the difference should not be significant - things like cache and memory bus contention are more important anyway and don't care on which cores you run.