The AMD Ryzen Threadripper 1950X and 1920X Review: CPUs on Steroids
by Ian Cutress on August 10, 2017 9:00 AM ESTRocket League
Hilariously simple pick-up-and-play games are great fun. I'm a massive fan of the Katamari franchise for that reason — passing start on a controller and rolling around, picking up things to get bigger, is extremely simple. Until we get a PC version of Katamari that I can benchmark, we'll focus on Rocket League.
Rocket League combines the elements of pick-up-and-play, allowing users to jump into a game with other people (or bots) to play football with cars with zero rules. The title is built on Unreal Engine 3, which is somewhat old at this point, but it allows users to run the game on super-low-end systems while still taxing the big ones. Since the release in 2015, it has sold over 5 million copies and seems to be a fixture at LANs and game shows. Users who train get very serious, playing in teams and leagues with very few settings to configure, and everyone is on the same level. Rocket League is quickly becoming one of the favored titles for e-sports tournaments, especially when e-sports contests can be viewed directly from the game interface.
Based on these factors, plus the fact that it is an extremely fun title to load and play, we set out to find the best way to benchmark it. Unfortunately for the most part automatic benchmark modes for games are few and far between. Partly because of this, but also on the basis that it is built on the Unreal 3 engine, Rocket League does not have a benchmark mode. In this case, we have to develop a consistent run and record the frame rate.
Read our initial analysis on our Rocket League benchmark on low-end graphics here.
With Rocket League, there is no benchmark mode, so we have to perform a series of automated actions, similar to a racing game having a fixed number of laps. We take the following approach: Using Fraps to record the time taken to show each frame (and the overall frame rates), we use an automation tool to set up a consistent 4v4 bot match on easy, with the system applying a series of inputs throughout the run, such as switching camera angles and driving around.
It turns out that this method is nicely indicative of a real bot match, driving up walls, boosting and even putting in the odd assist, save and/or goal, as weird as that sounds for an automated set of commands. To maintain consistency, the commands we apply are not random but time-fixed, and we also keep the map the same (Aquadome, known to be a tough map for GPUs due to water/transparency) and the car customization constant. We start recording just after a match starts, and record for 4 minutes of game time (think 5 laps of a DIRT: Rally benchmark), with average frame rates, 99th percentile and frame times all provided.
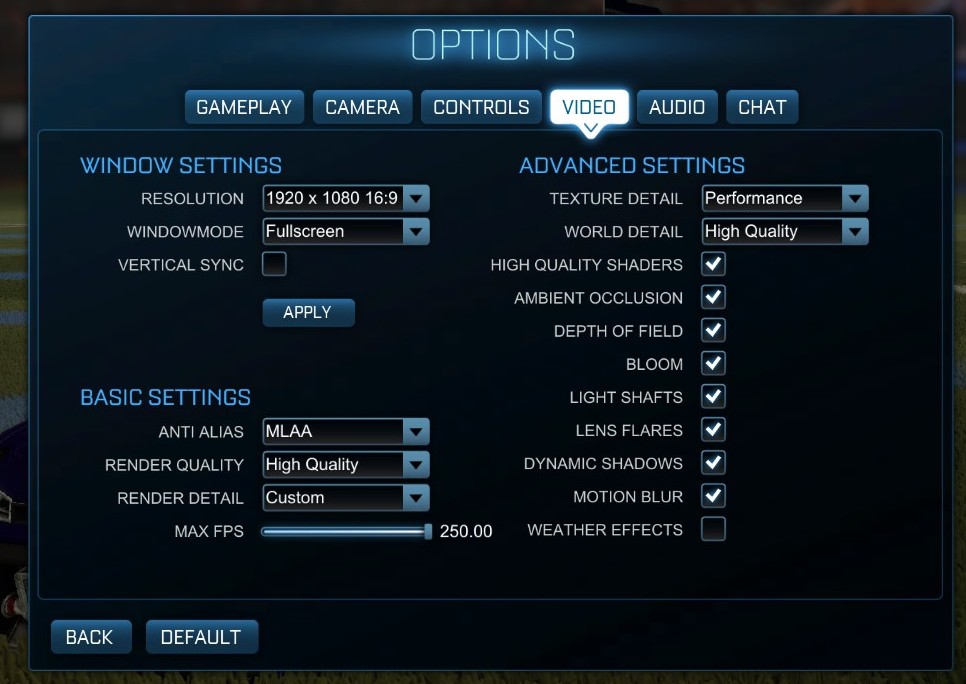
The graphics settings for Rocket League come in four broad, generic settings: Low, Medium, High and High FXAA. There are advanced settings in place for shadows and details; however, for these tests, we keep to the generic settings. For both 1920x1080 and 4K resolutions, we test at the High preset with an unlimited frame cap.
All of our benchmark results can also be found in our benchmark engine, Bench.
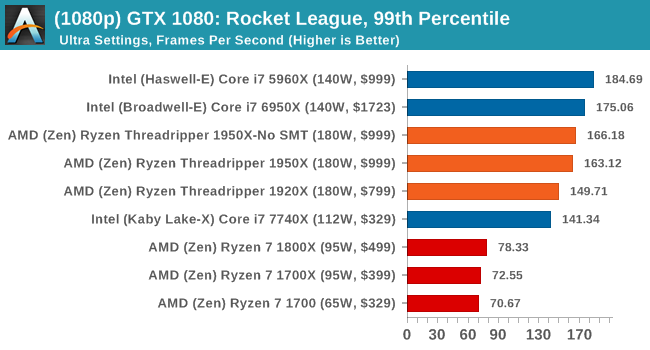
MSI GTX 1080 Gaming 8G Performance
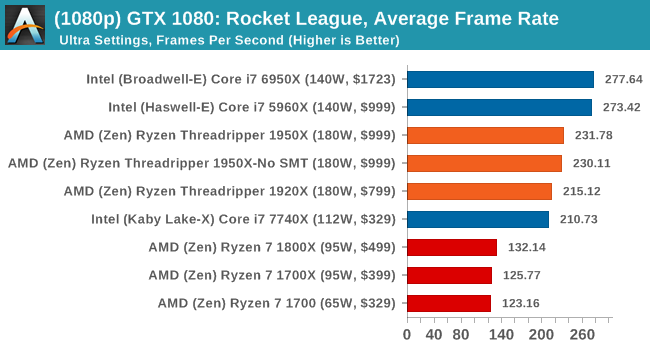
1080p
4K

ASUS GTX 1060 Strix 6G Performance
1080p
4K
Sapphire Nitro R9 Fury 4G Performance
1080p
4K
Sapphire Nitro RX 480 8G Performance
1080p
4K
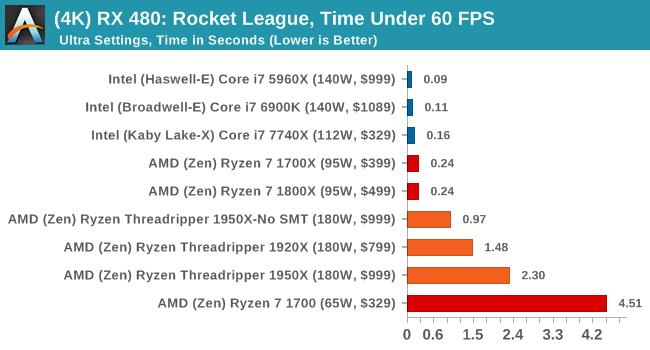
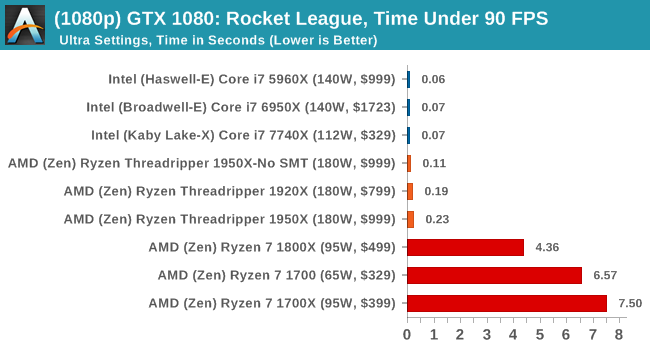
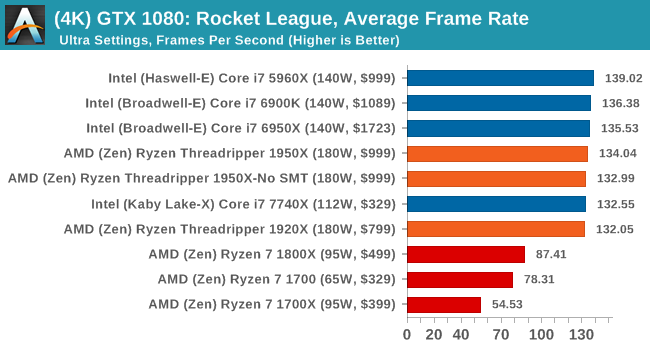
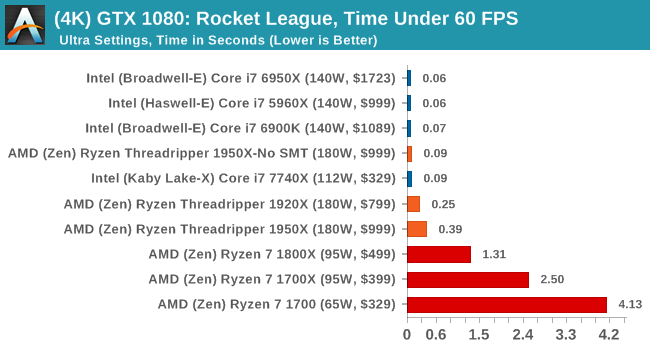
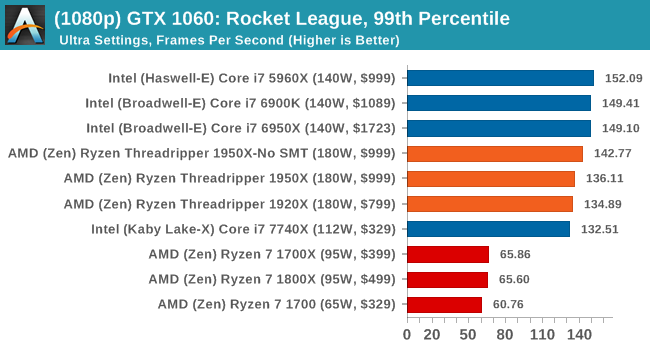
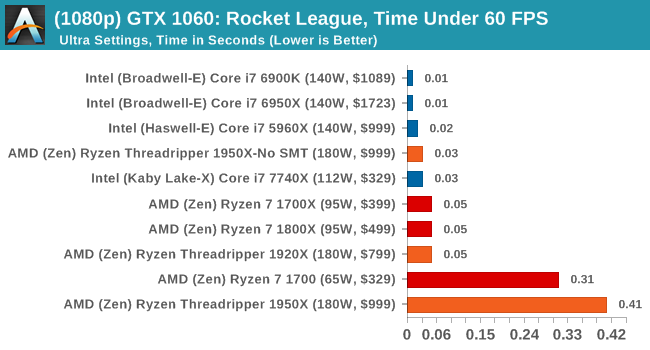
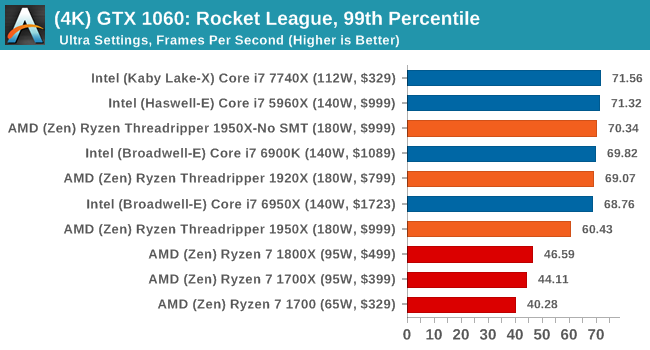
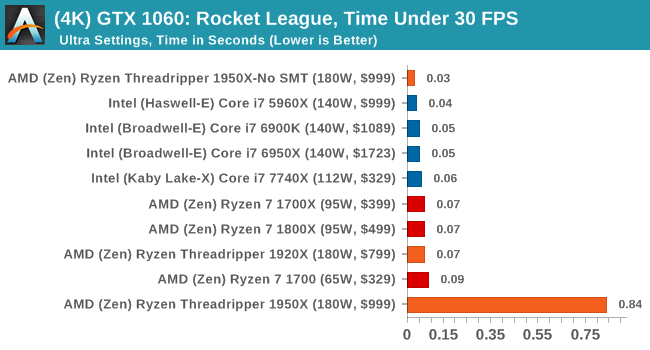
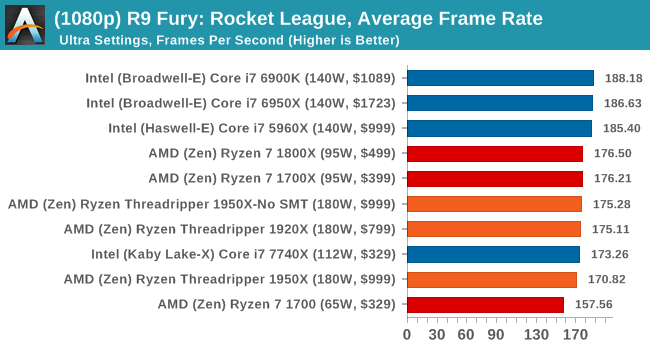
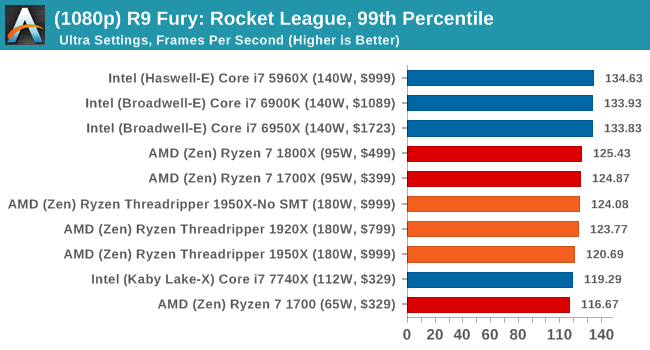
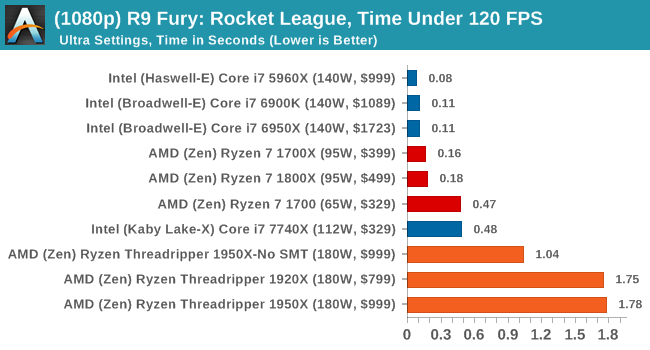
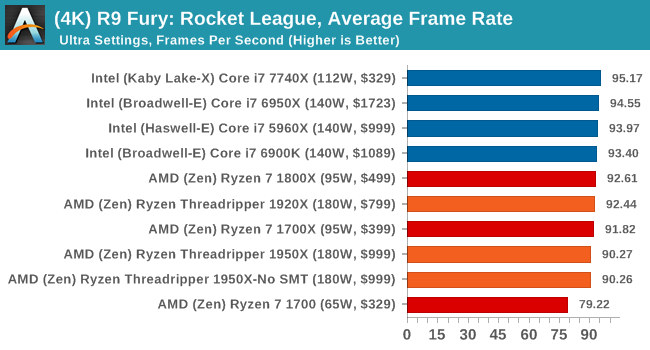
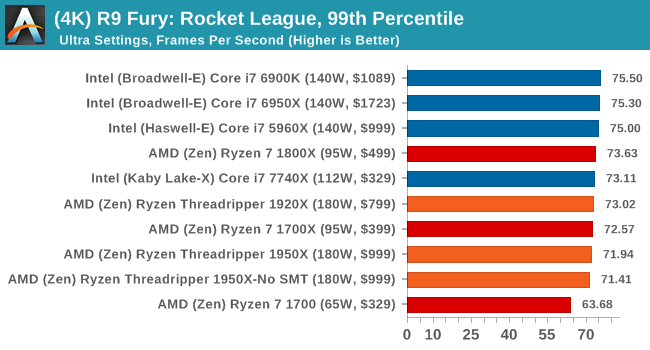
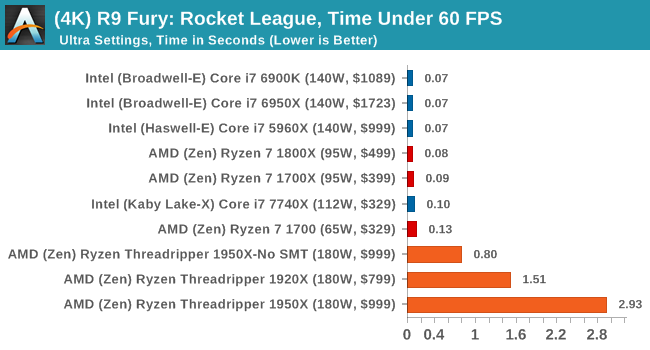
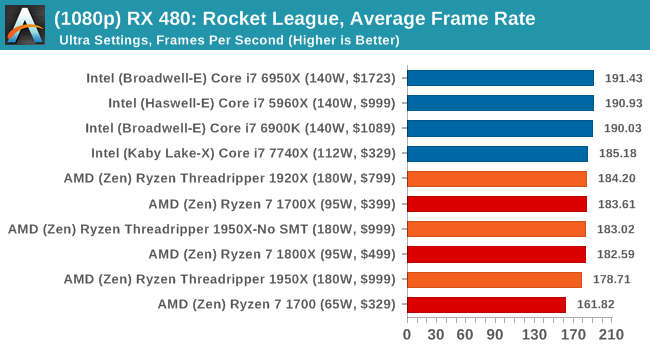
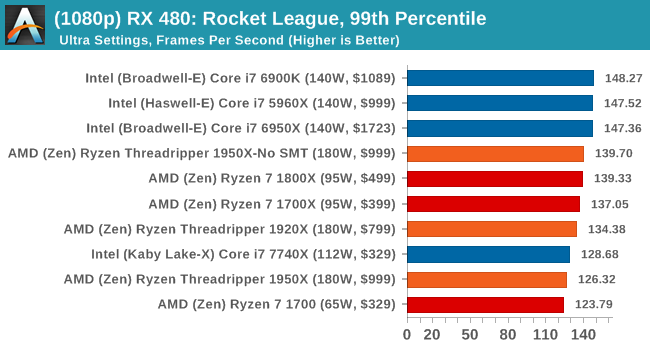
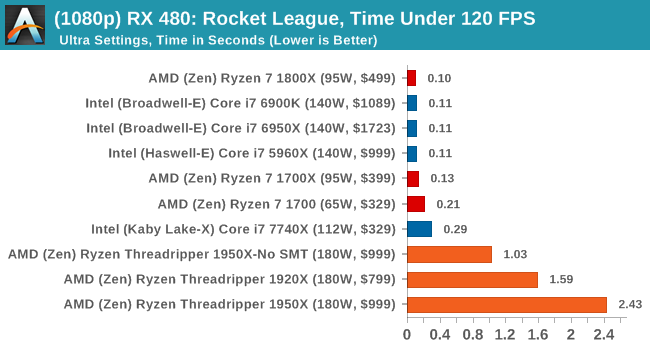
With Ryzen, we encounted some odd performance issues when using NVIDIA-based video cards that caused those cards to significantly underperform. However equally strangely, the issues we have with Ryzen on Rocket League with NVIDIA GPUs seem to almost vanish when using Threadripper. Again, still no easy wins here as Intel seems to take Rocket League in its stride, but SMT-off mode still helps the 1950X. The Time Under graphs give some cause for concern, with the 1950X consistently being at the bottom of that graph.


347 Comments
View All Comments
lefty2 - Thursday, August 10, 2017 - link
except that they haven'tDr. Swag - Thursday, August 10, 2017 - link
How so? You have the performance numbers, and they gave you power draw numbers...bongey - Thursday, August 10, 2017 - link
Just do a avx512 benchmark and Intel will jump over 300watts , 400watts(overclocked) only from the cpu. (prime95 avx512 benchmark).See der8auer's video "The X299 VRM Disaster (en)"DanNeely - Thursday, August 10, 2017 - link
The Chromium build time results are interesting. Anandtech's results have the 1950X only getting 3/4ths of the 7900X's performance. Arstechnica's getting almost equal results on both CPUs, but at 16 compiles per day vs 24 or 32 is seeing significantly worse numbers all around.I'm wondering what's different between the two compile benchmarks to see such a large spread.
cknobman - Thursday, August 10, 2017 - link
I think it has a lot to do with the RAM used by Anandtech vs Arstechnica .For all the regular benchmarking Anand used DDR4 2400, only the DDR 3200 was used in some overcloking.
Arstechnica used DDR4 3200 for all benchmarking.
Everyone already knows how faster DDR4 memory helps the Zen architecture.
DanNeely - Thursday, August 10, 2017 - link
If ram was the determining factor, Ars should be seeing faster build times though not slower ones.carewolf - Thursday, August 10, 2017 - link
Anandtech must have misconfigured something. Building chromium is scales practically linearly. You can move jobs all the way across a slow network and compile on another machine and you still get linear speed-ups with more added cores.Ian Cutress - Thursday, August 10, 2017 - link
We're using a late March v56 code base with MSVC.Ars is using a newer v62 code base with clang-cl and VC++ linking
We locked in our versions when we started testing Windows 10 a few months ago.
supdawgwtfd - Friday, August 11, 2017 - link
Maybe drop it then as it is not at all usefull info.Johan Steyn - Thursday, August 10, 2017 - link
I refrained from posting on the previous article, but now I'm quite sure Anand is being paid by Intel. It is not that I argue against the benchmarks, but how it is presented. I was even under the impression that this was an Intel review.The previous article was stated as "Introducing Intel's Desktop Processor" Huge marketing research is done on how to market products. By just stating one thing first or in a different way, quite different messages can be conveyed without lying outright.
By making the "Most Powerful, Most Scalable" Bold, that is what the readers read first, then they read "Desktop Processor" without even reading that is is Intel's. This is how marketing works, so Anand used slanted journalism to favour Intel, yet most people will just not realise it eat it up.
In this review there are so many slanted journalism problems, it is just sad. If you want, just compare it to other sites reviews. They just omit certain tests and list others at which Intel excel.
I have lost my respect for Anandtech with these last two articles of them, and I have followed Anandtech since its inception. Sad to see that you are also now bought by Intel, even though I suspected this before. Congratulations for making this so clear!!!