The AMD Ryzen Threadripper 1950X and 1920X Review: CPUs on Steroids
by Ian Cutress on August 10, 2017 9:00 AM ESTRise of the Tomb Raider (1080p, 4K)
One of the newest games in the gaming benchmark suite is Rise of the Tomb Raider (RoTR), developed by Crystal Dynamics, and the sequel to the popular Tomb Raider which was loved for its automated benchmark mode. But don’t let that fool you: the benchmark mode in RoTR is very much different this time around.
Visually, the previous Tomb Raider pushed realism to the limits with features such as TressFX, and the new RoTR goes one stage further when it comes to graphics fidelity. This leads to an interesting set of requirements in hardware: some sections of the game are typically GPU limited, whereas others with a lot of long-range physics can be CPU limited, depending on how the driver can translate the DirectX 12 workload.
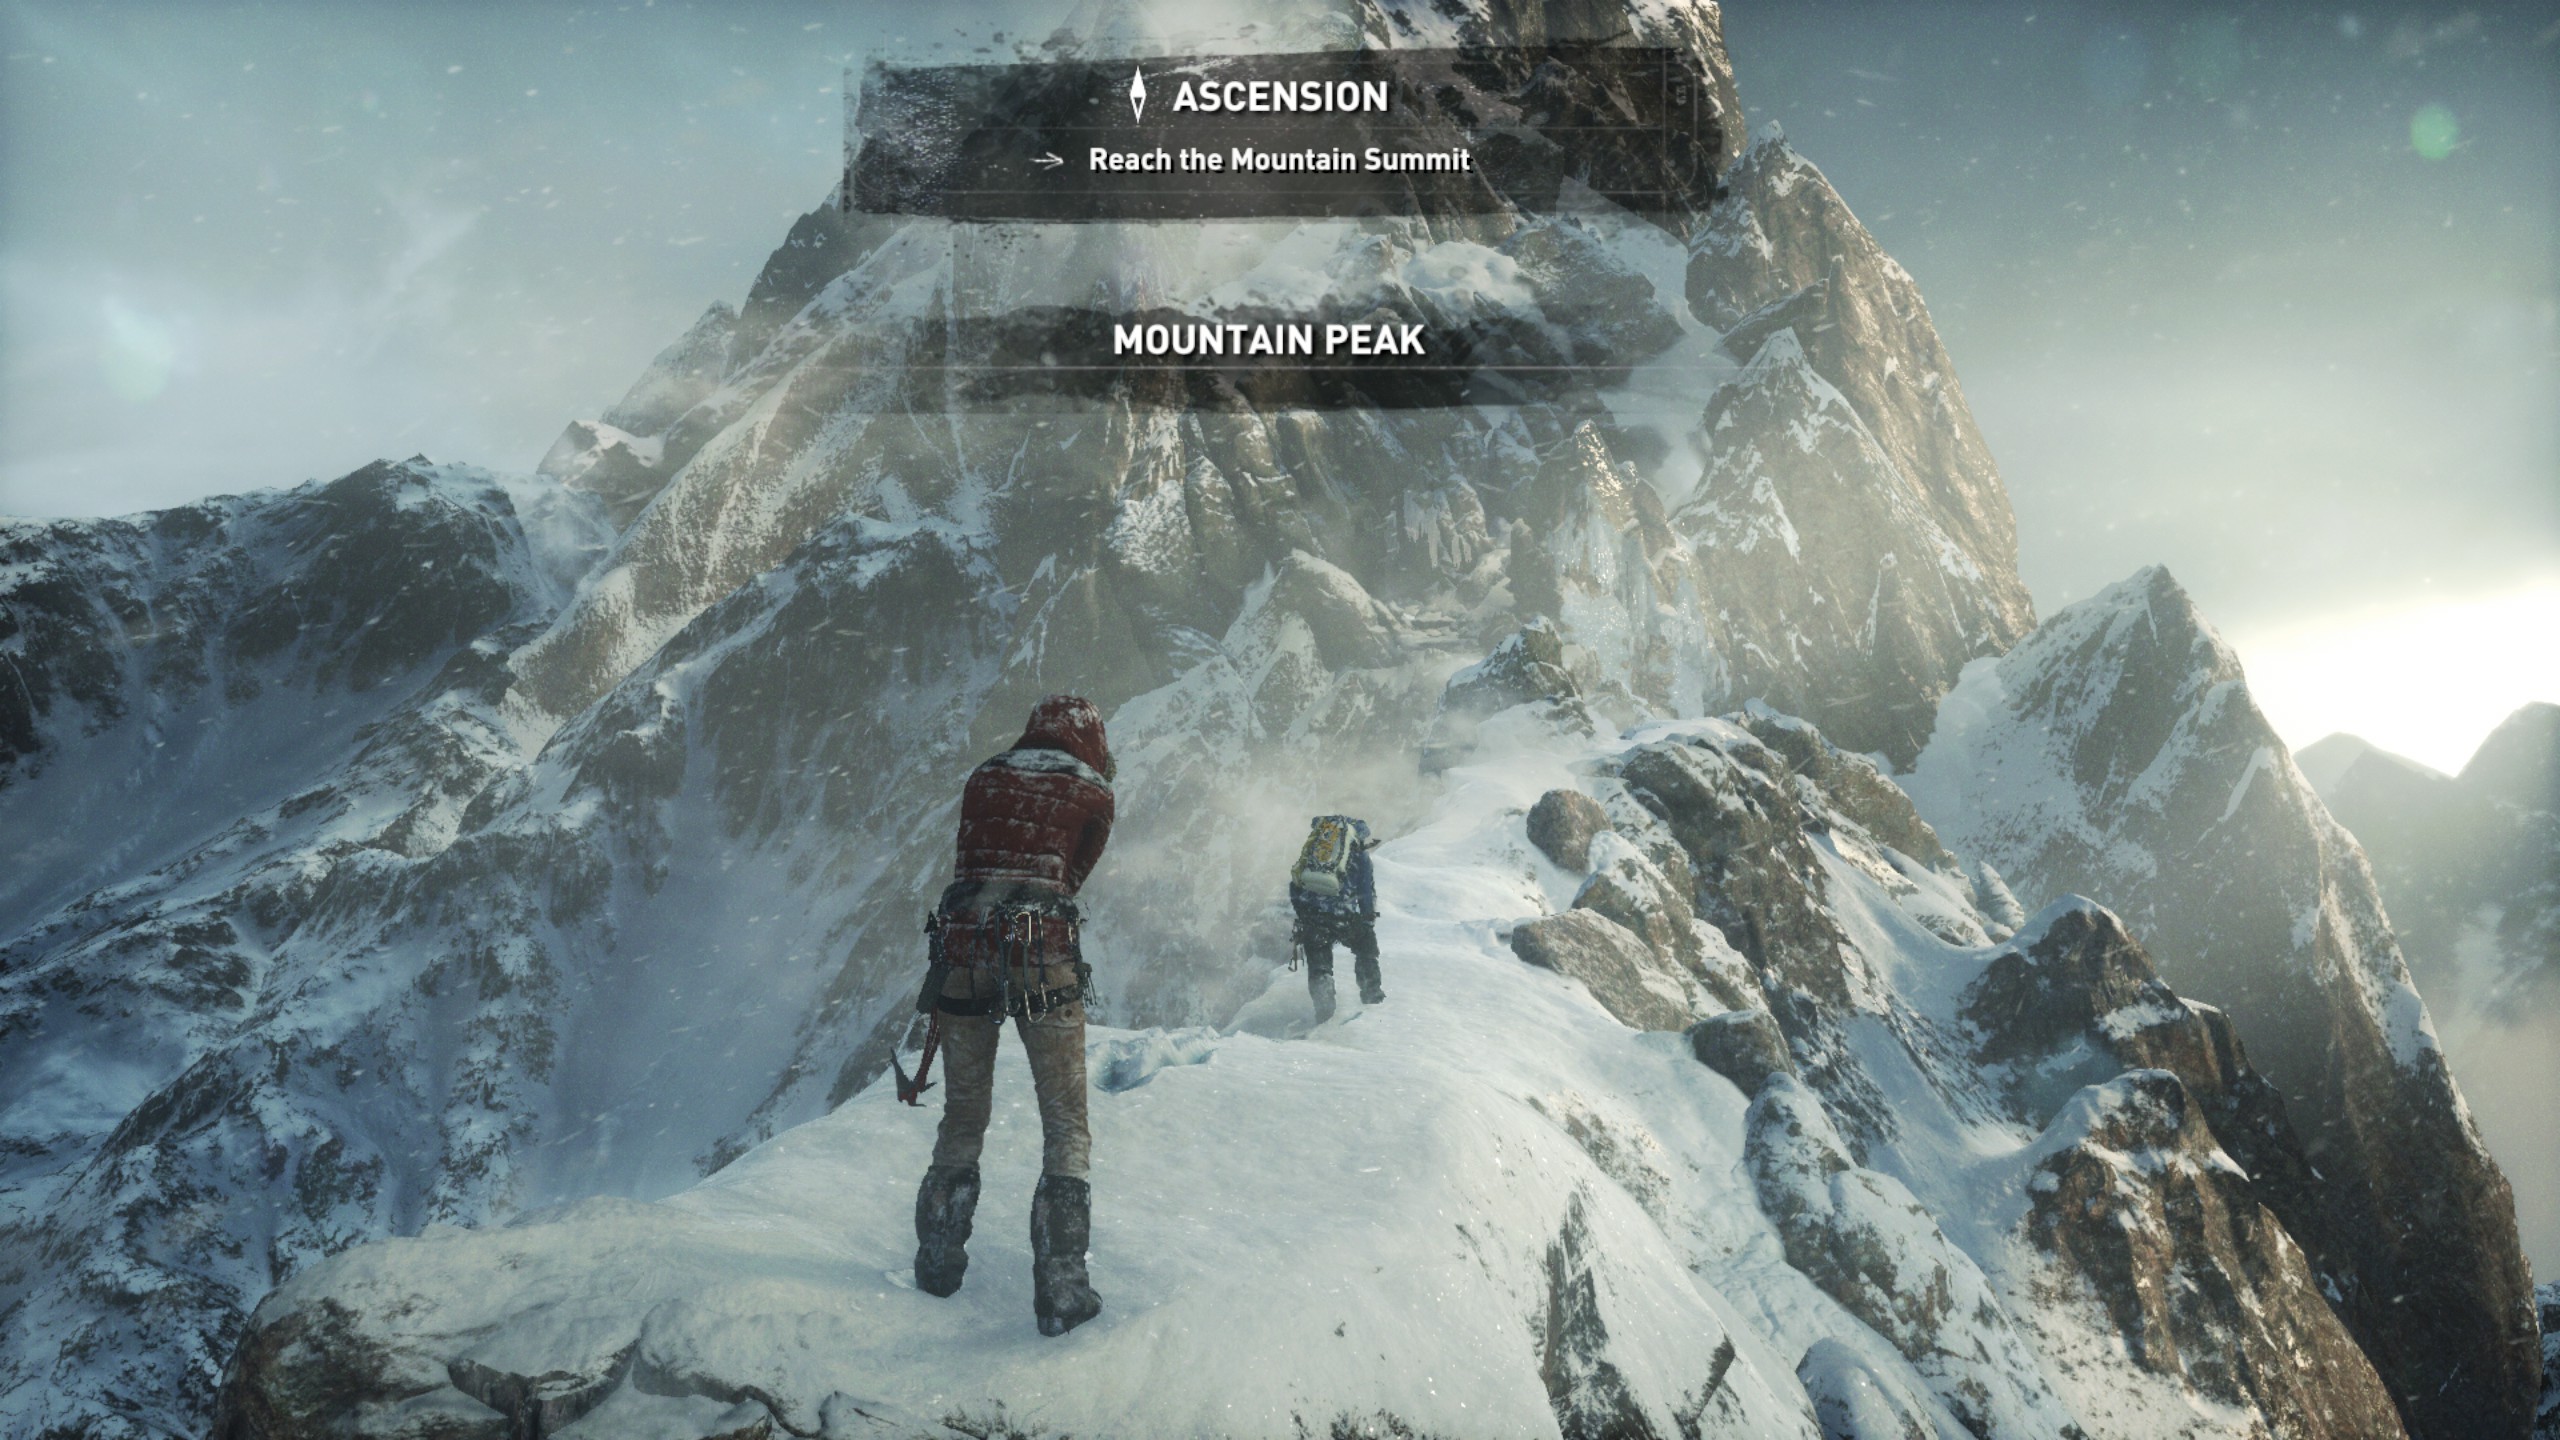
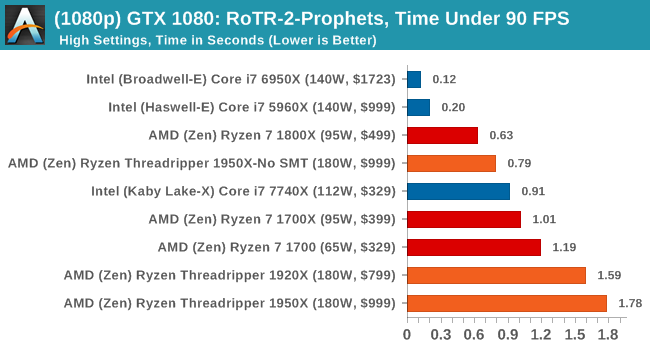
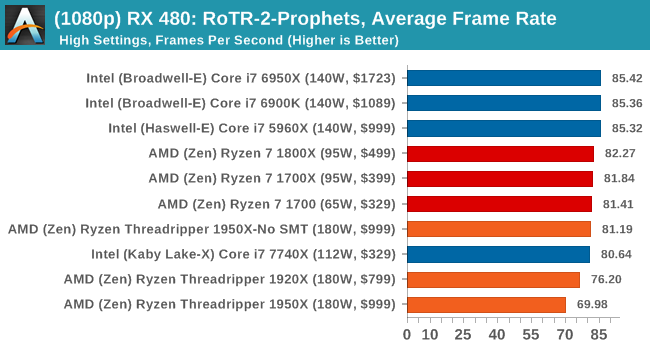
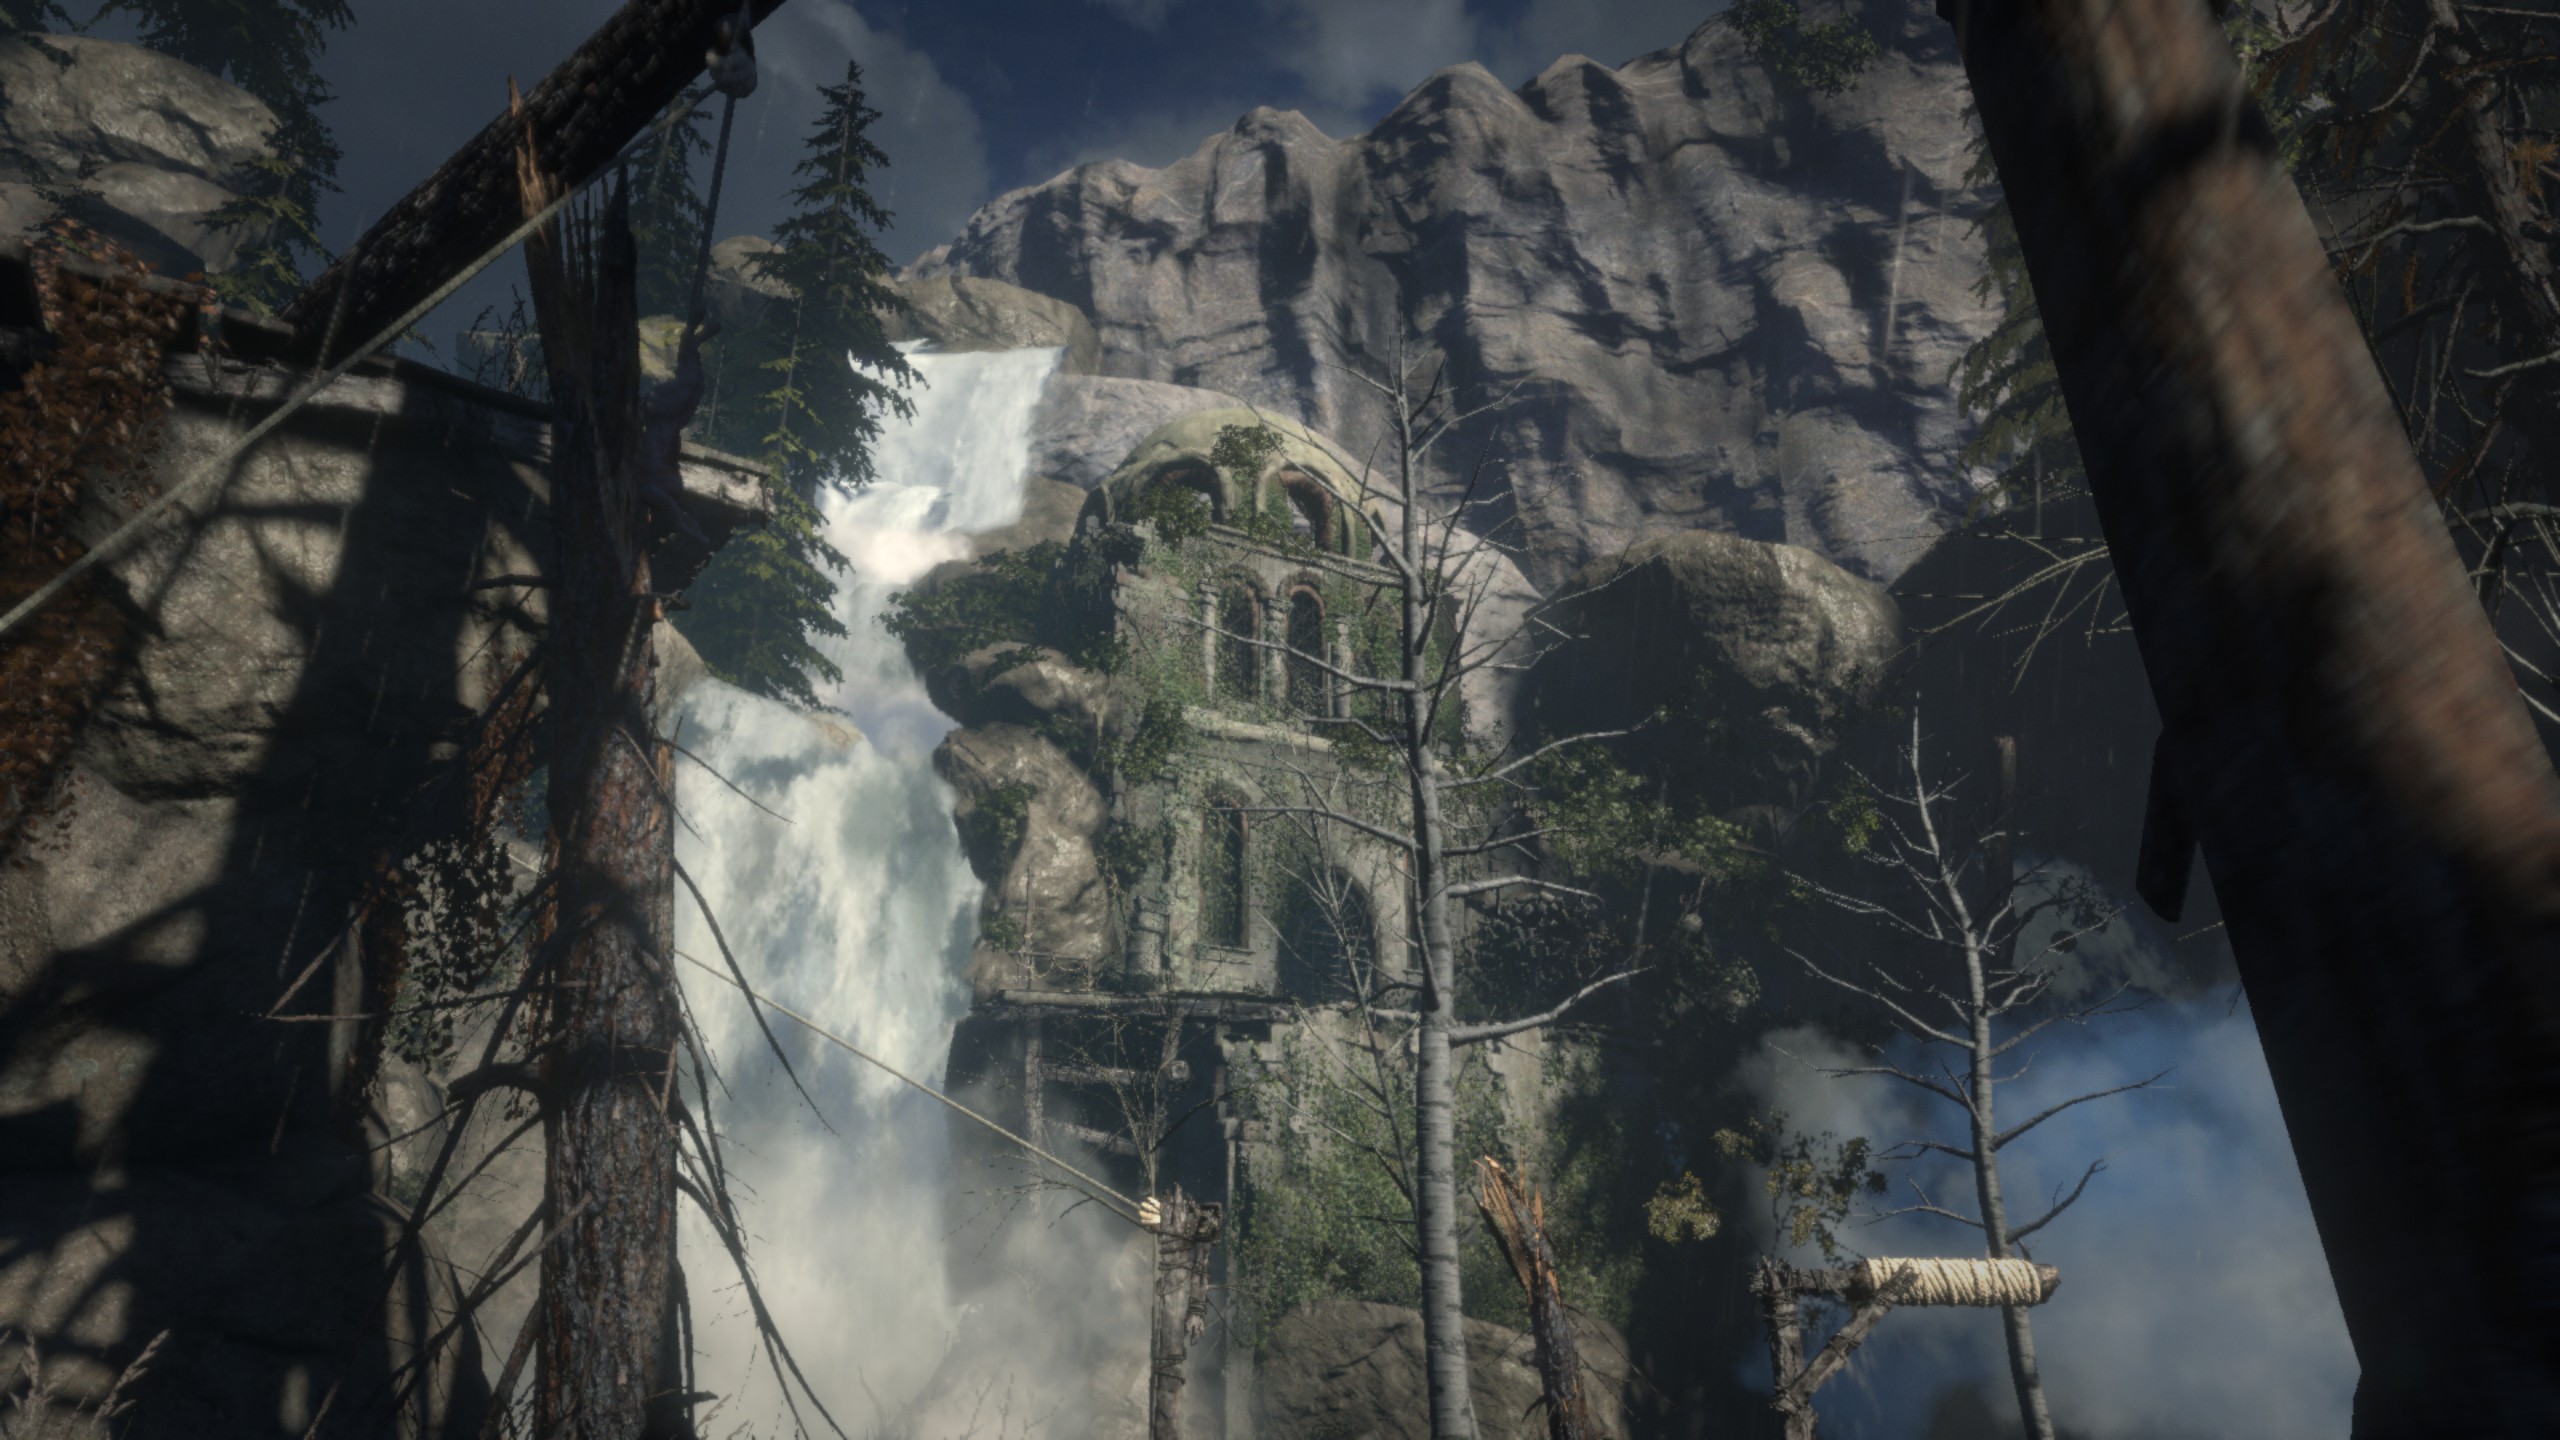
Where the old game had one benchmark scene, the new game has three different scenes with different requirements: Spine of the Mountain (1-Valley), Prophet’s Tomb (2-Prophet) and Geothermal Valley (3-Mountain) - and we test all three (and yes, I need to relabel them - I got them wrong when I set up the tests). These are three scenes designed to be taken from the game, but it has been noted that scenes like 2-Prophet shown in the benchmark can be the most CPU limited elements of that entire level, and the scene shown is only a small portion of that level. Because of this, we report the results for each scene on each graphics card separately.
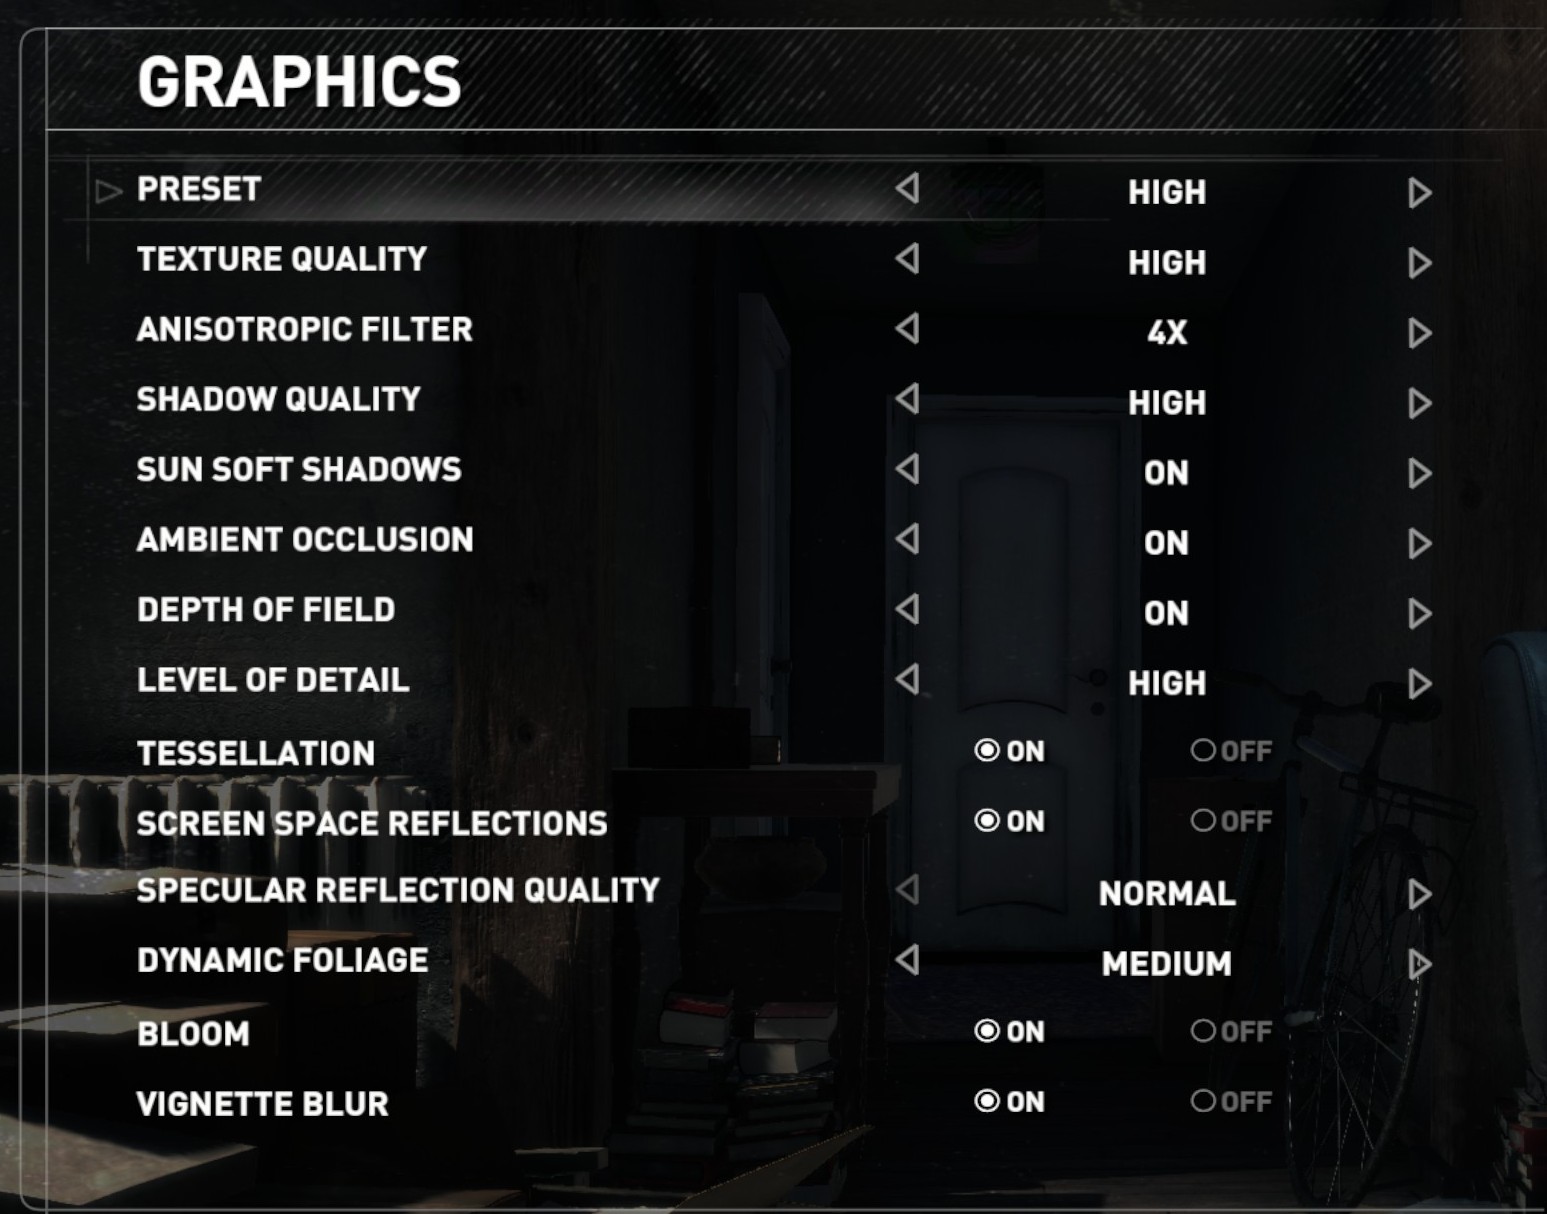
Graphics options for RoTR are similar to other games in this type, offering some presets or allowing the user to configure texture quality, anisotropic filter levels, shadow quality, soft shadows, occlusion, depth of field, tessellation, reflections, foliage, bloom, and features like PureHair which updates on TressFX in the previous game.
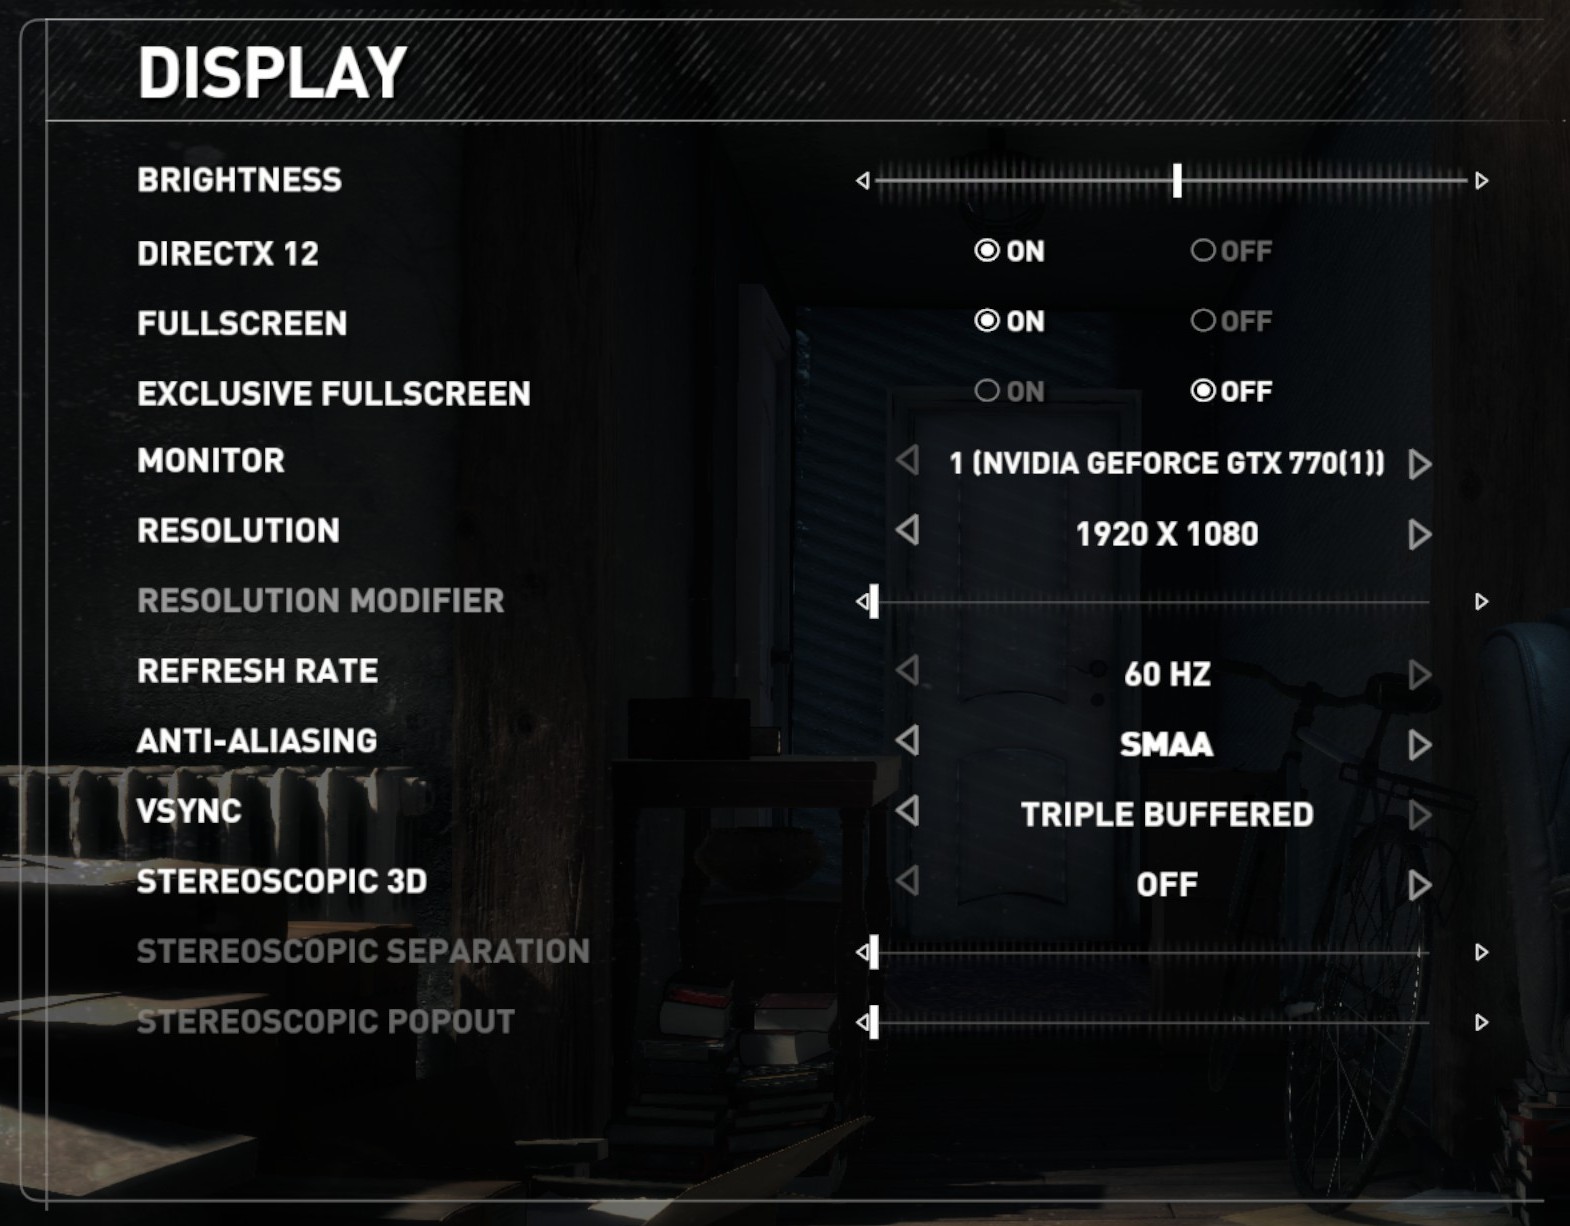
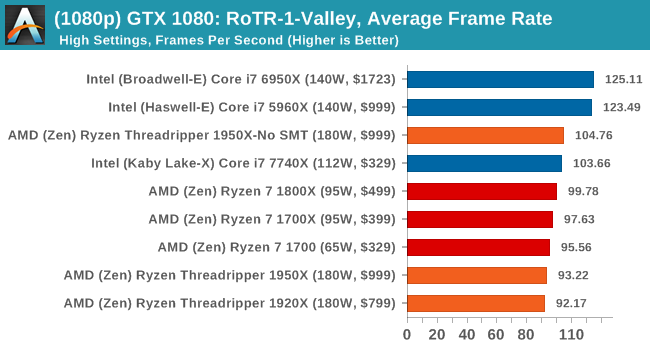
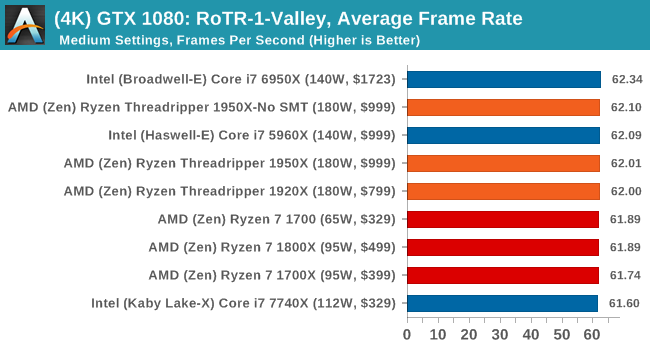
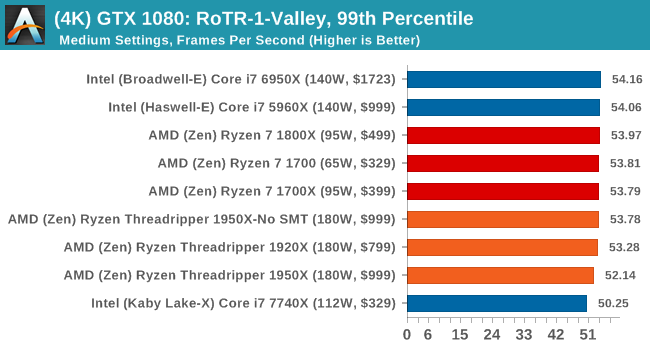
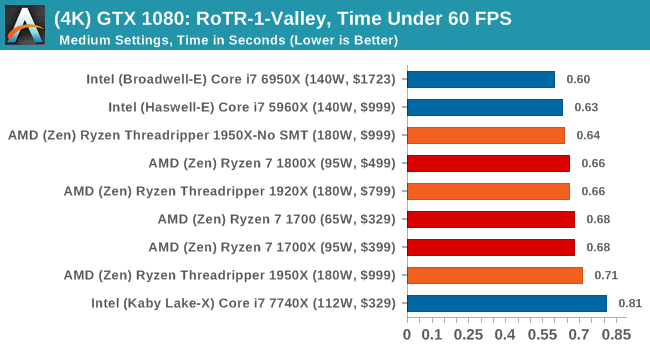
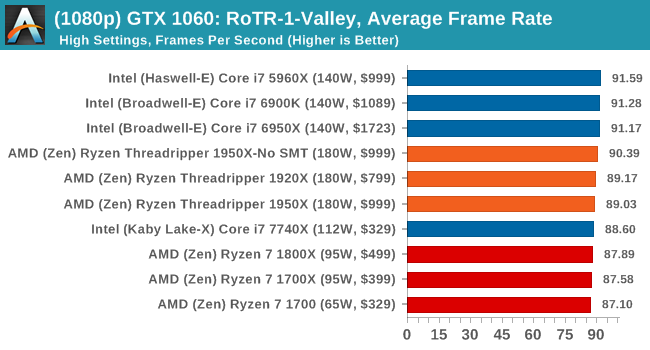
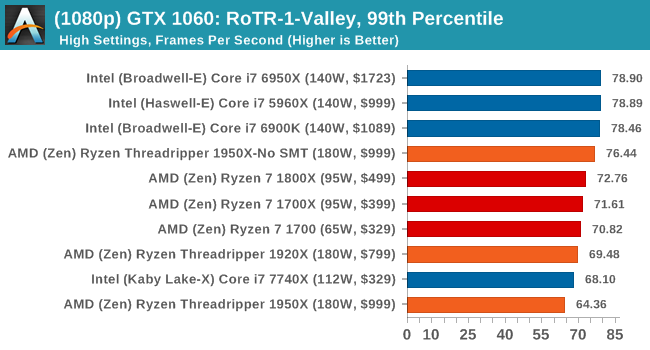
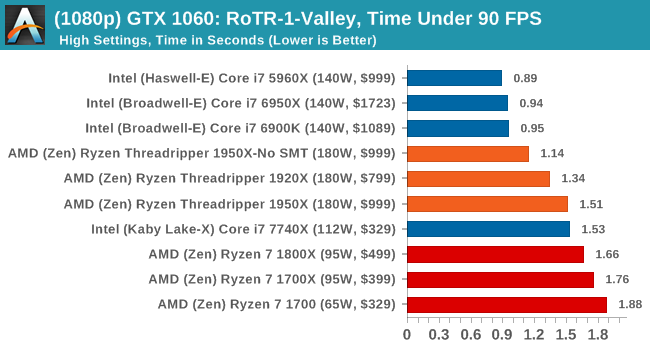
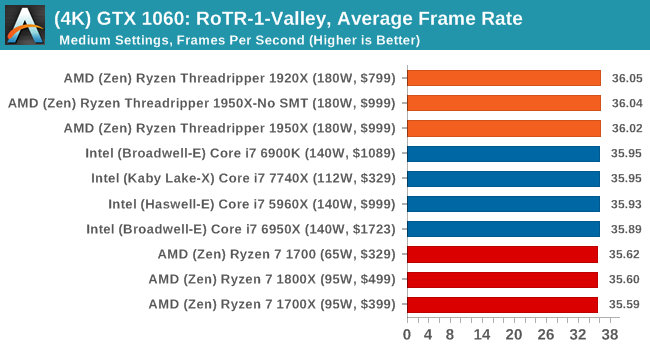
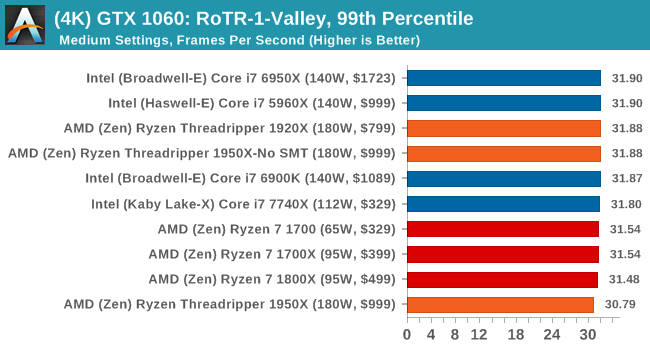
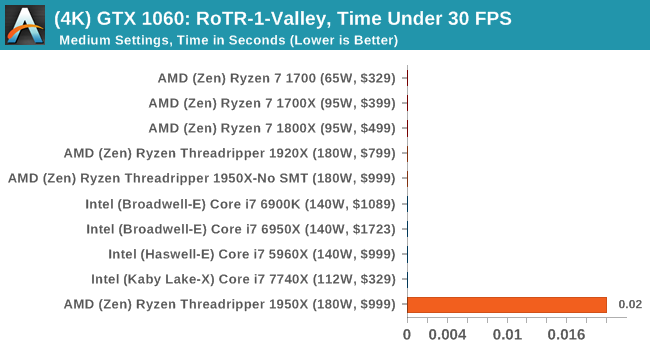
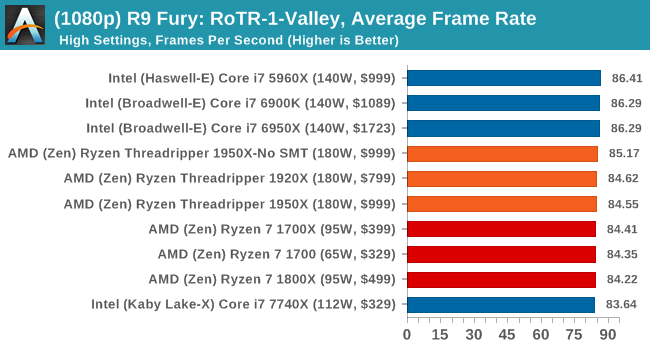
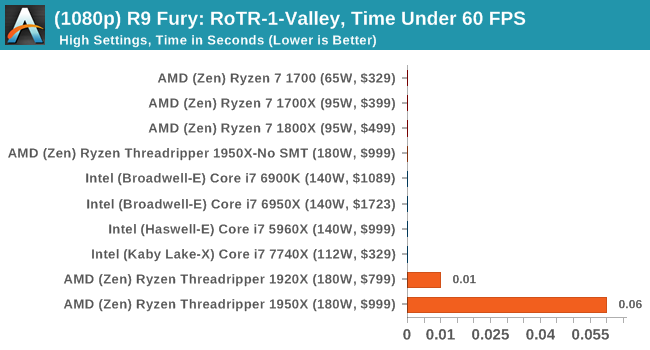
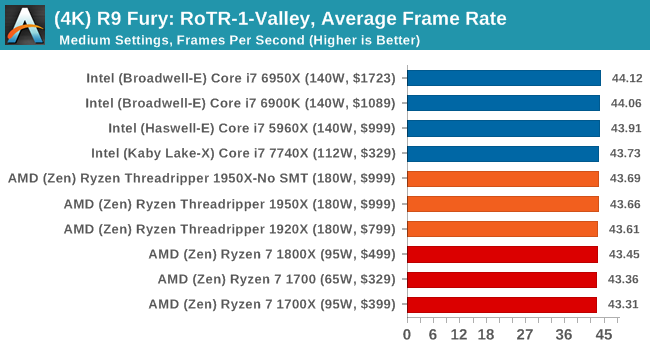
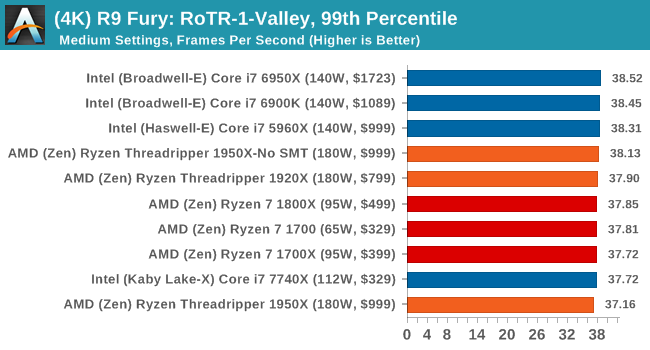
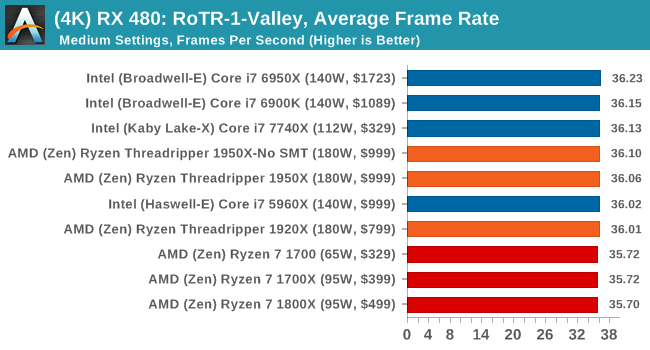
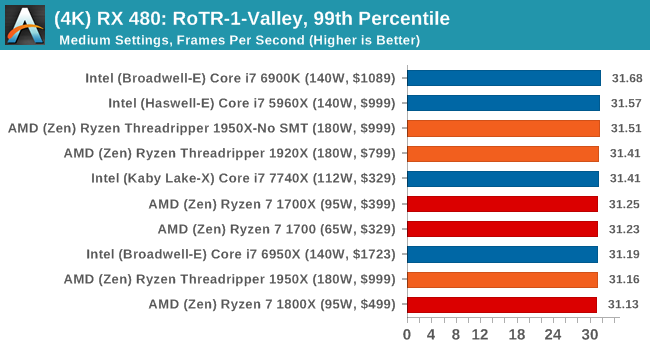
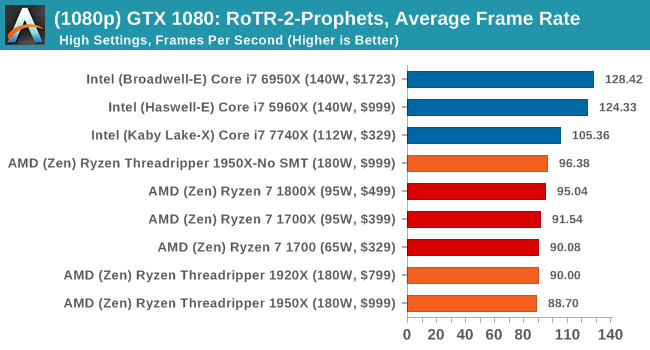
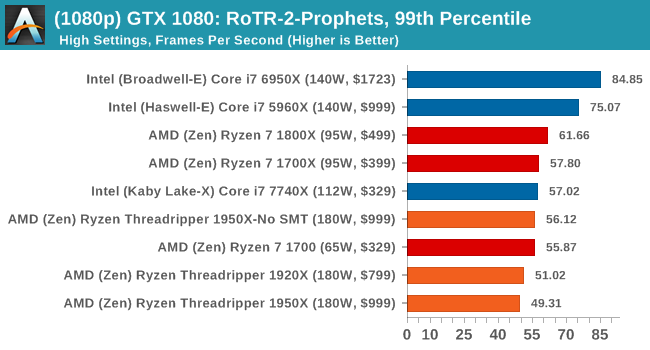
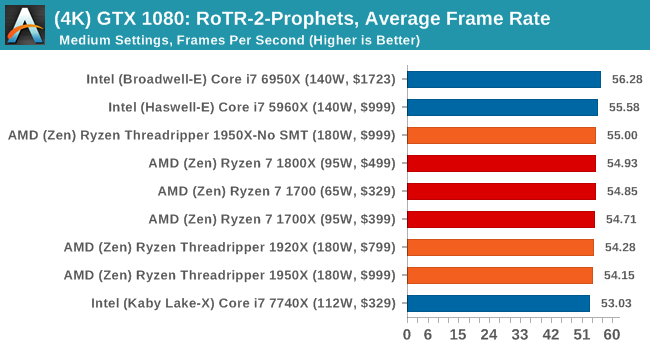
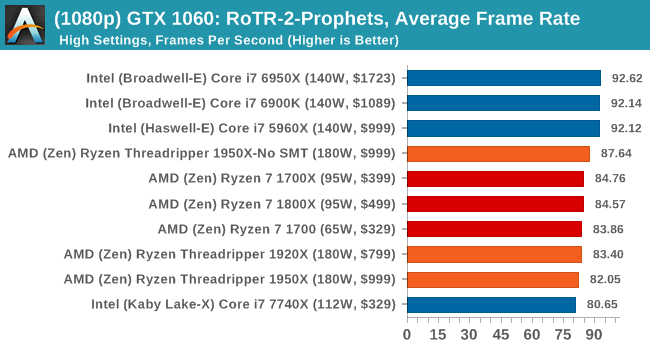
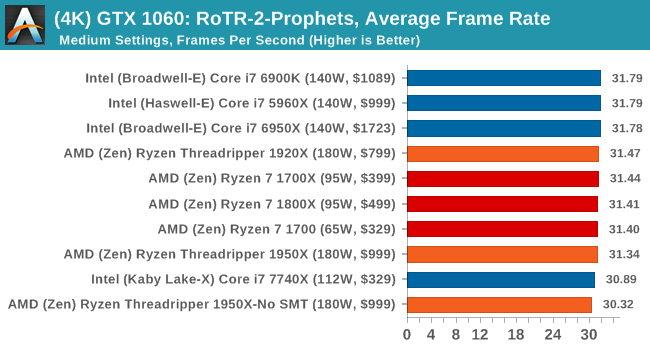
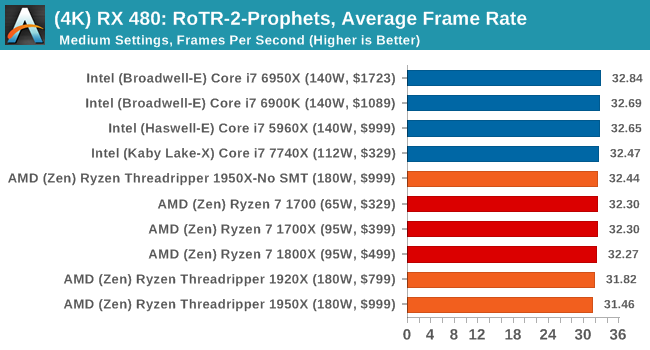
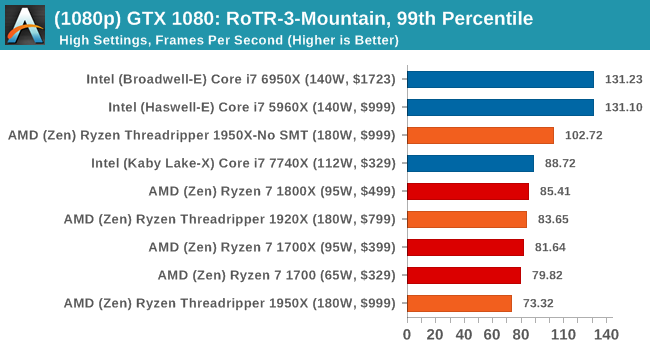
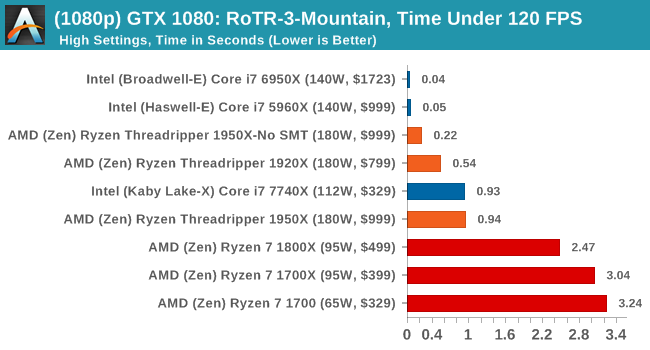
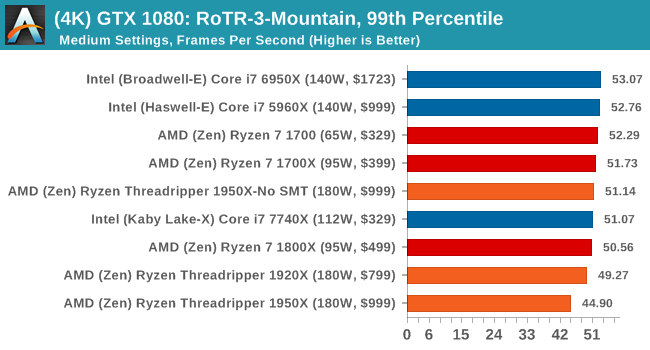
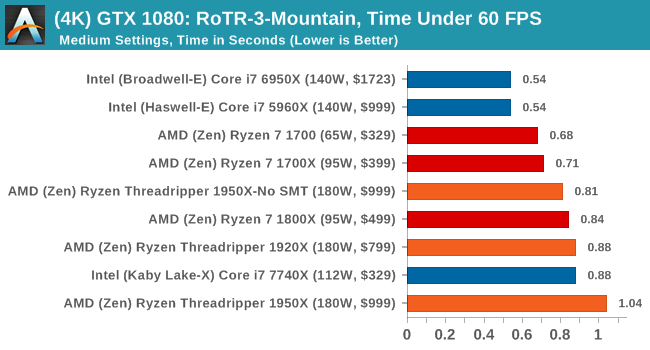
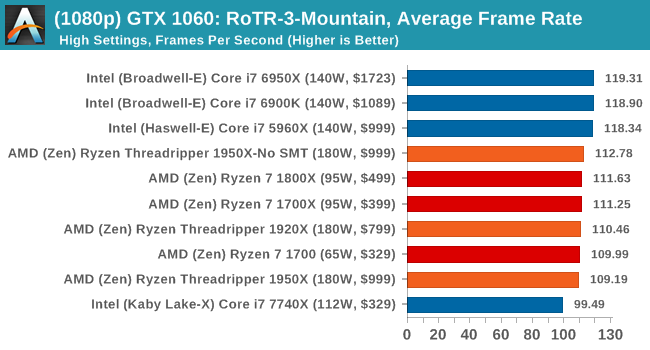
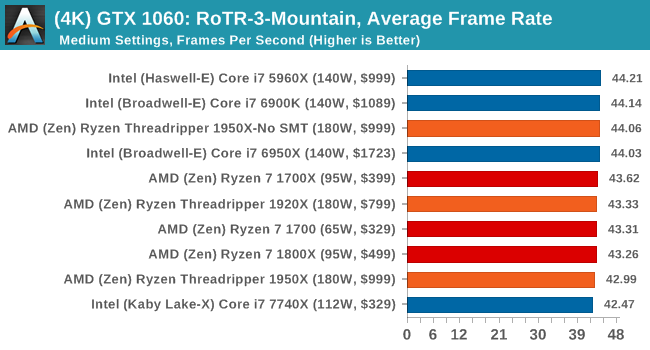
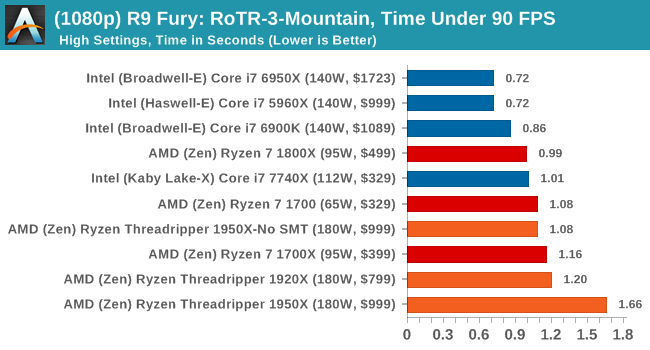
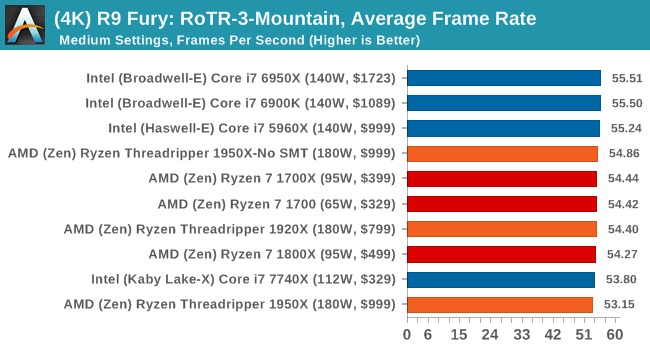
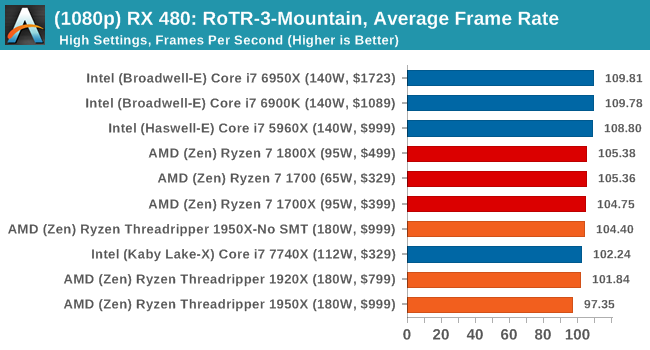
Again, we test at 1920x1080 and 4K using our native 4K displays. At 1080p we run the High preset, while at 4K we use the Medium preset which still takes a sizable hit in frame rate.
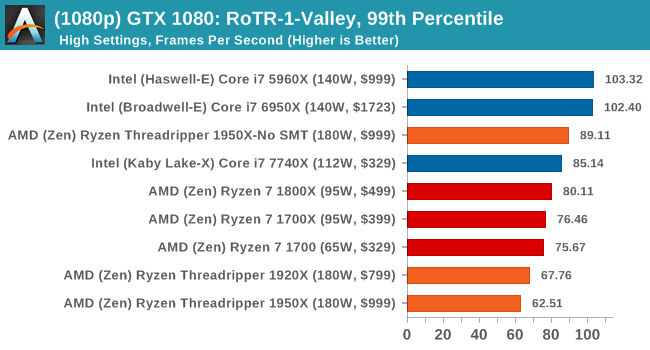
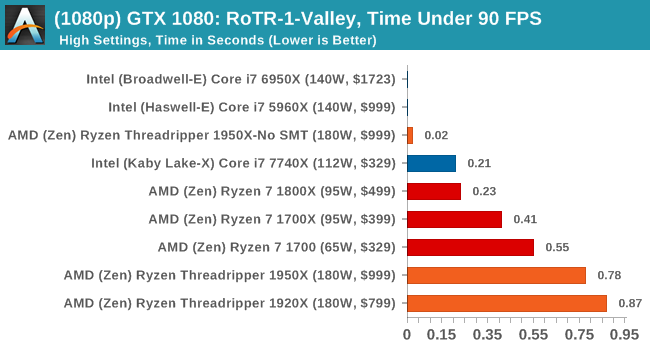
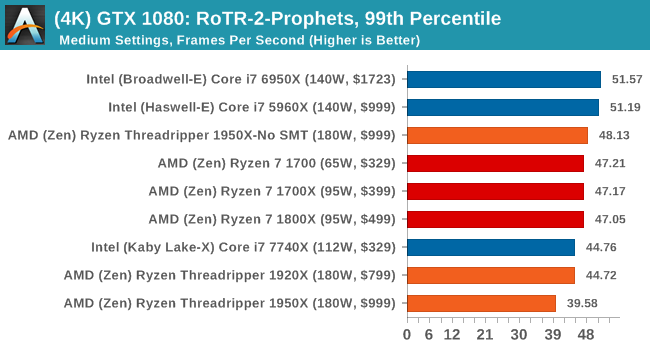
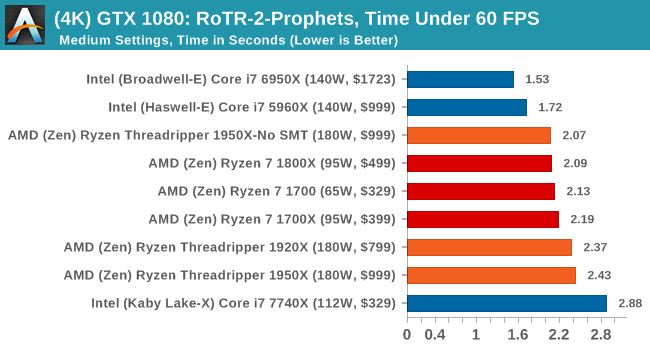
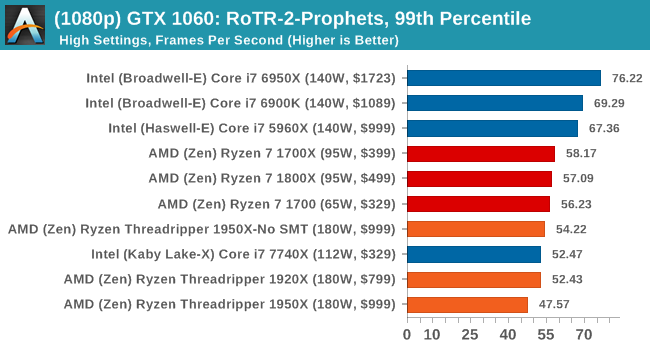
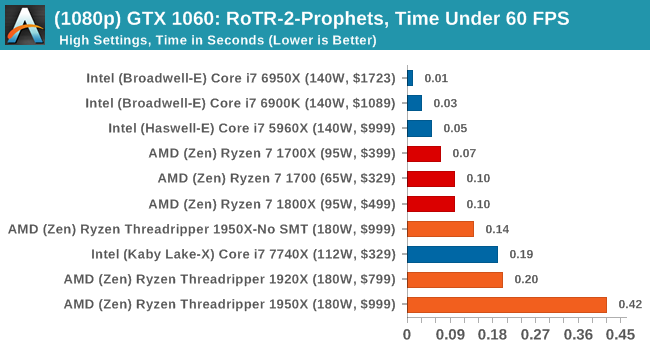
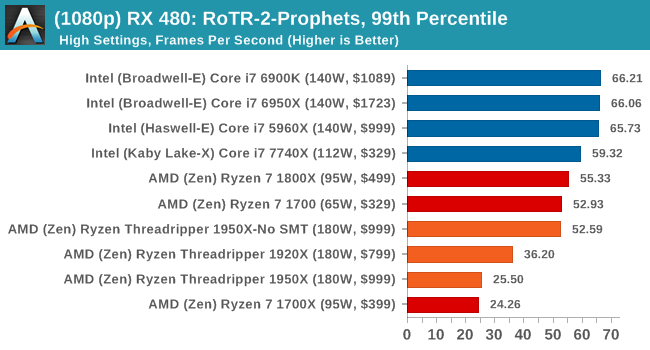
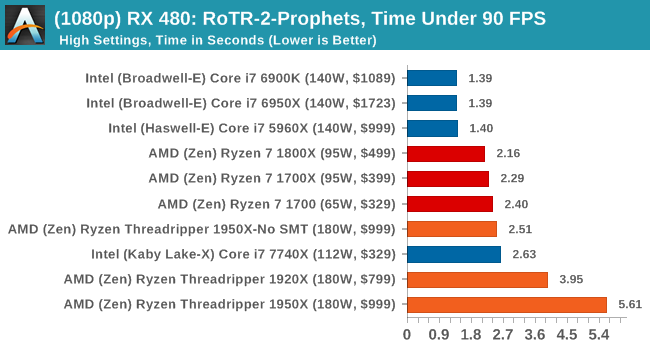
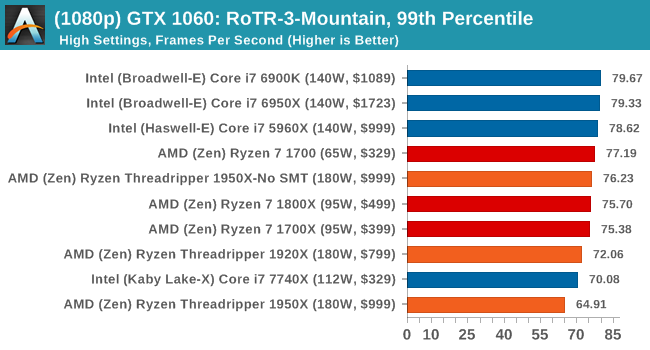
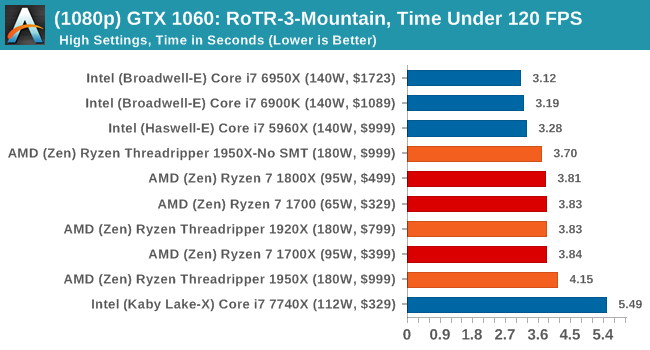
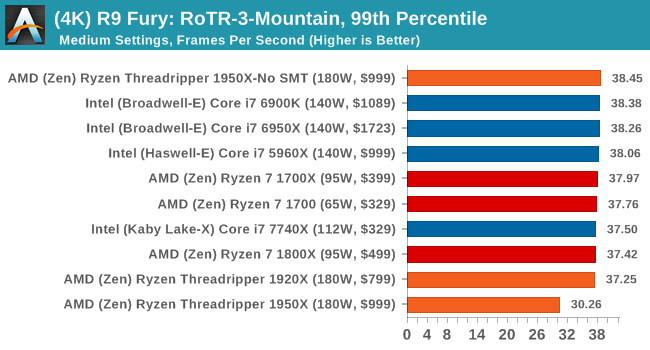
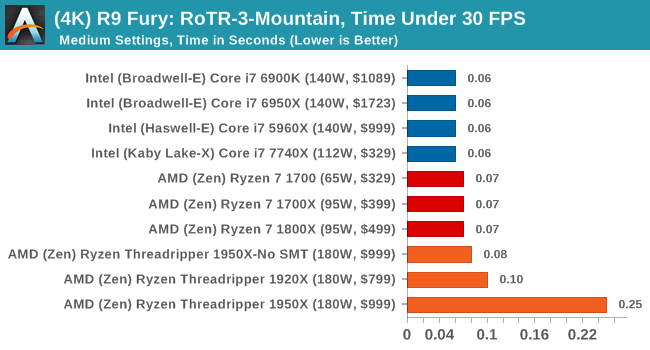
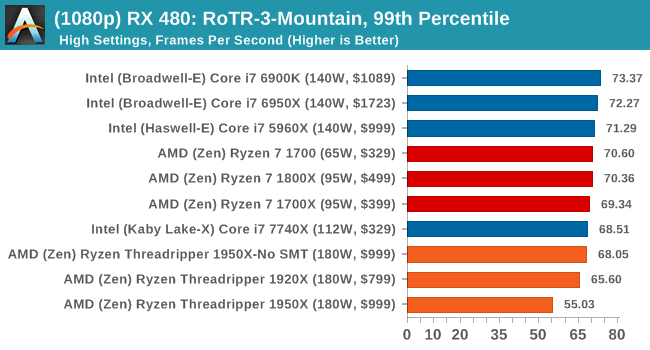
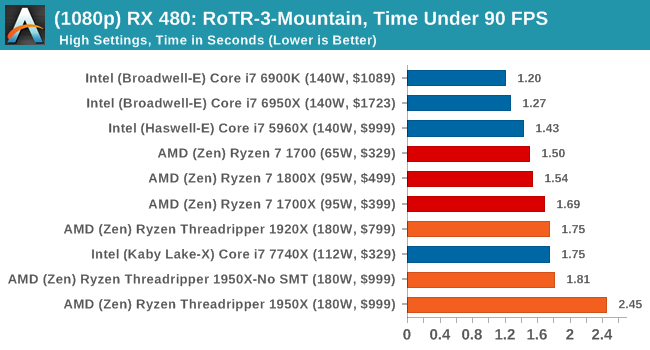
It is worth noting that RoTR is a little different to our other benchmarks in that it keeps its graphics settings in the registry rather than a standard ini file, and unlike the previous TR game the benchmark cannot be called from the command-line. Nonetheless we scripted around these issues to automate the benchmark four times and parse the results. From the frame time data, we report the averages, 99th percentiles, and our time under analysis.
All of our benchmark results can also be found in our benchmark engine, Bench.
#1 Geothermal Valley Spine of the Mountain
MSI GTX 1080 Gaming 8G Performance
1080p
4K
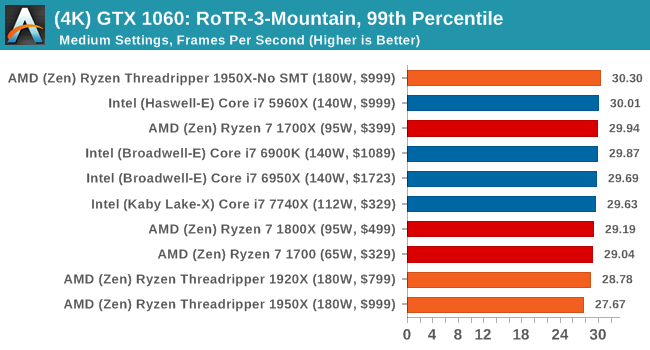
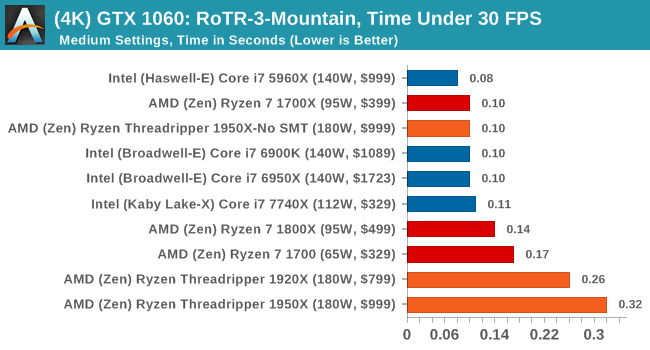
ASUS GTX 1060 Strix 6G Performance
1080p
4K
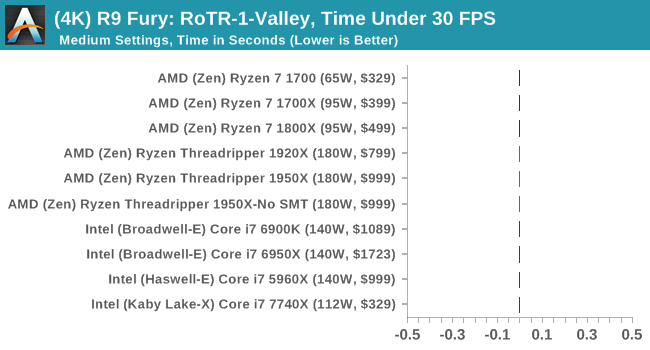
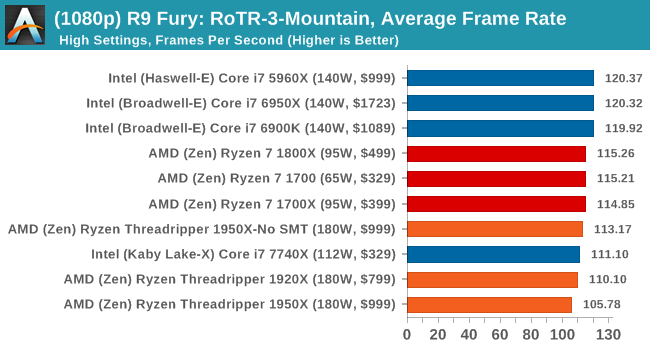
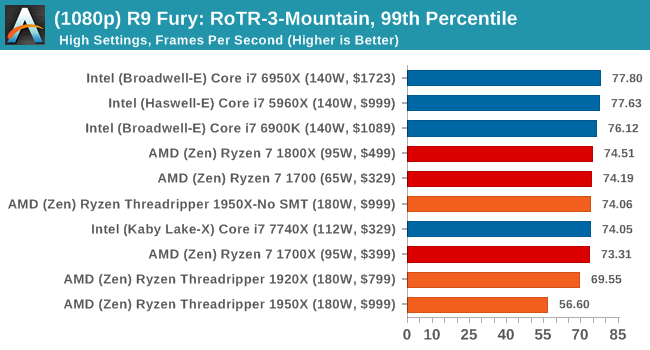
Sapphire Nitro R9 Fury 4G Performance
1080p

4K
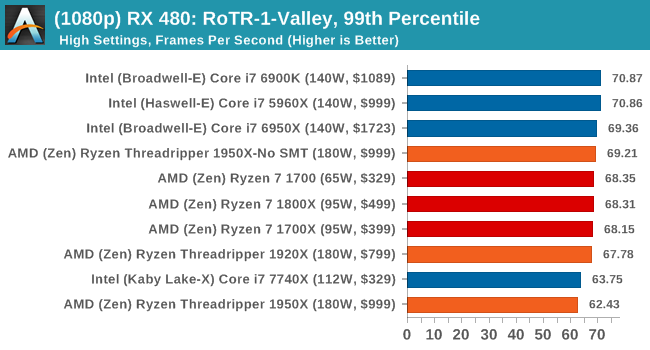
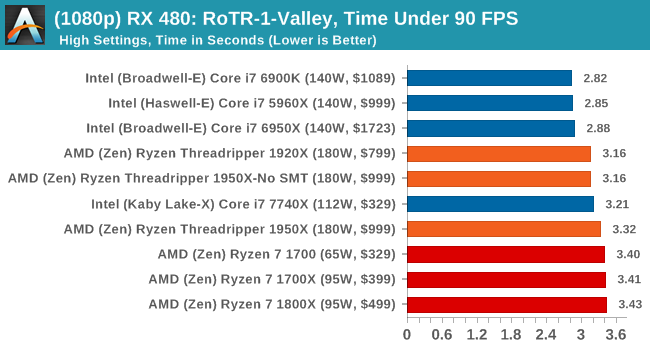
Sapphire Nitro RX 480 8G Performance
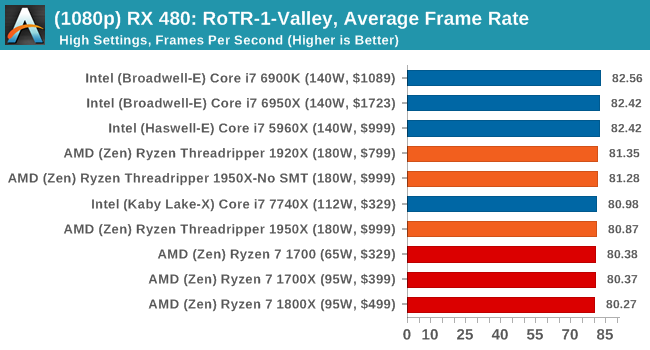
1080p
4K

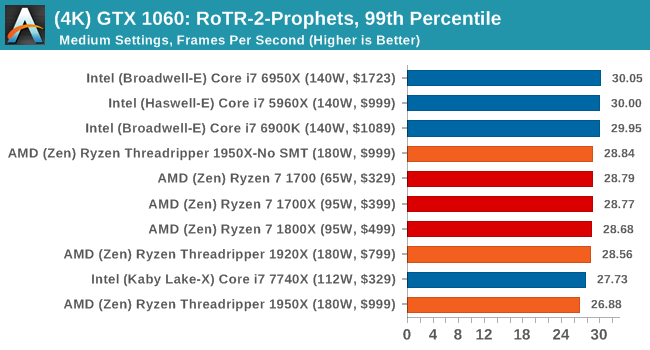
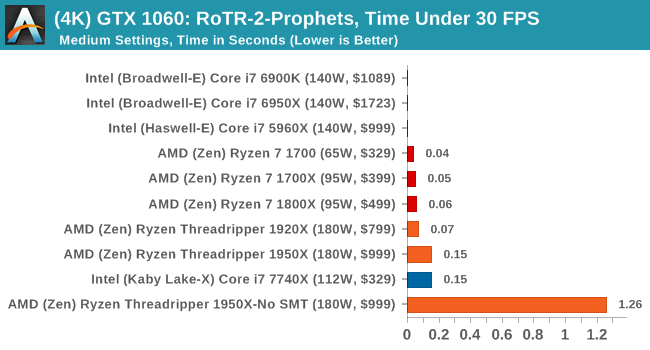
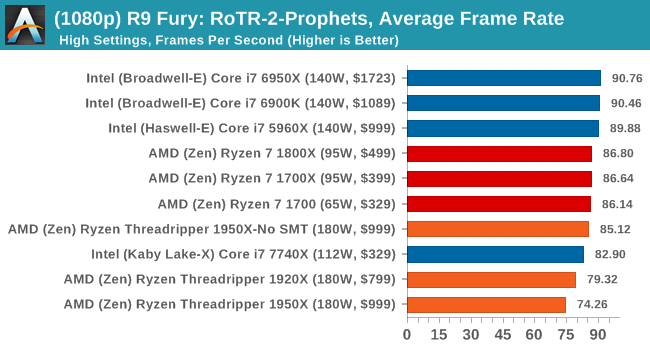
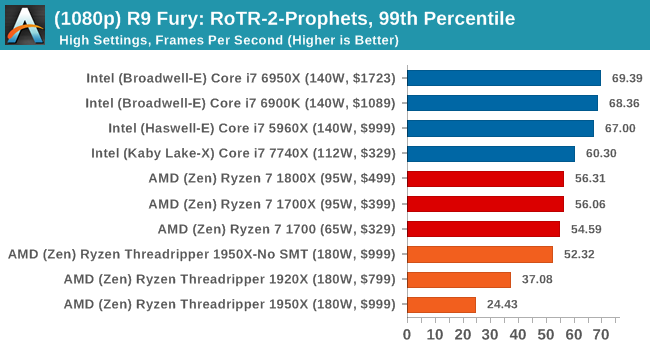
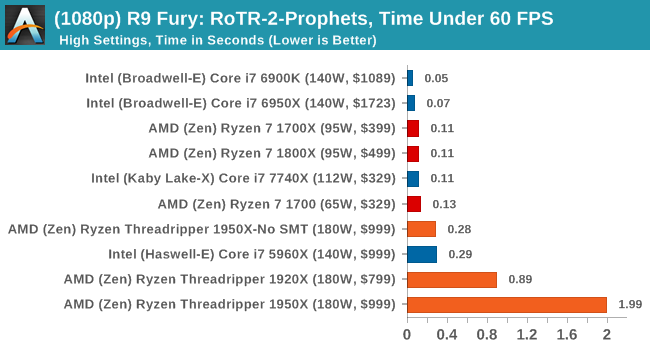
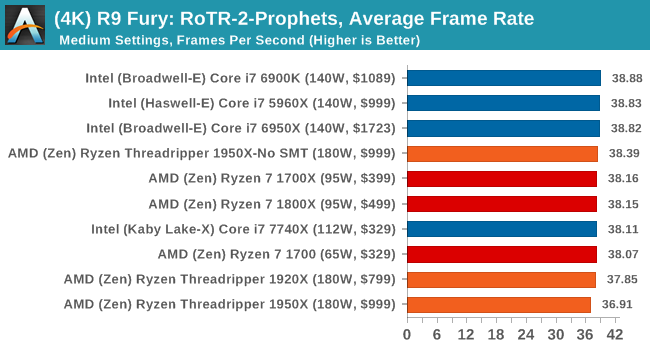
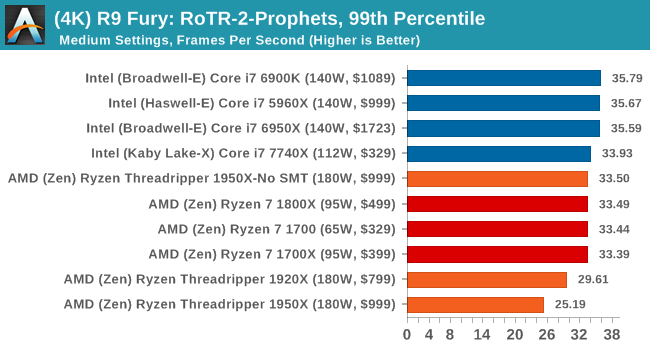
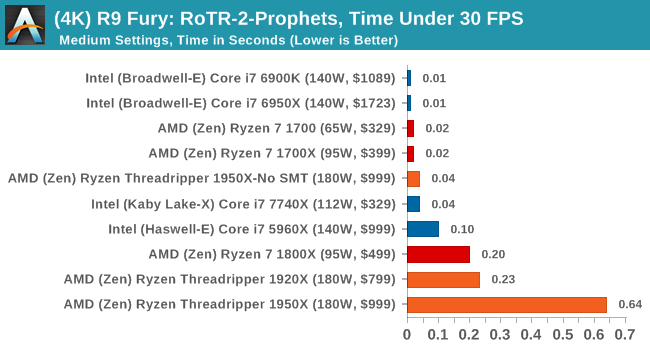
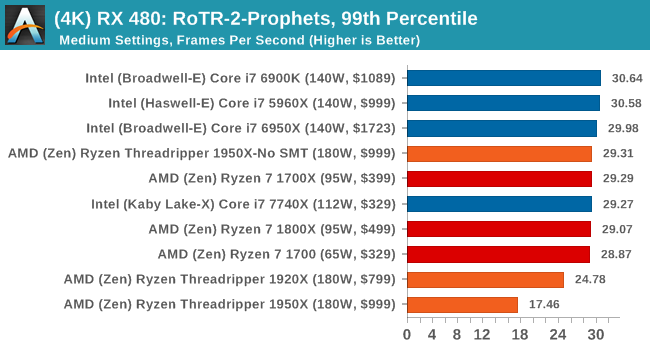
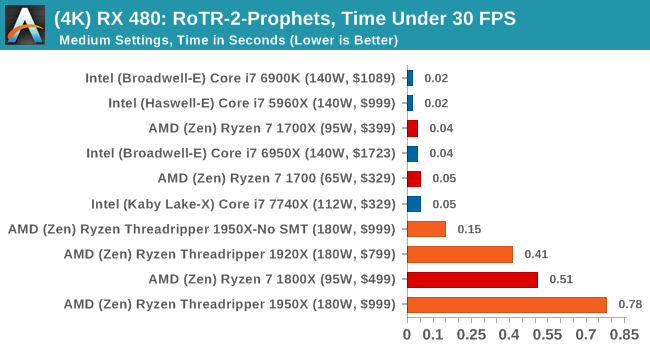
#2 Prophet’s Tomb

MSI GTX 1080 Gaming 8G Performance
1080p
4K
ASUS GTX 1060 Strix 6G Performance
1080p
4K
Sapphire Nitro R9 Fury 4G Performance
1080p
4K
Sapphire Nitro RX 480 8G Performance
1080p
4K
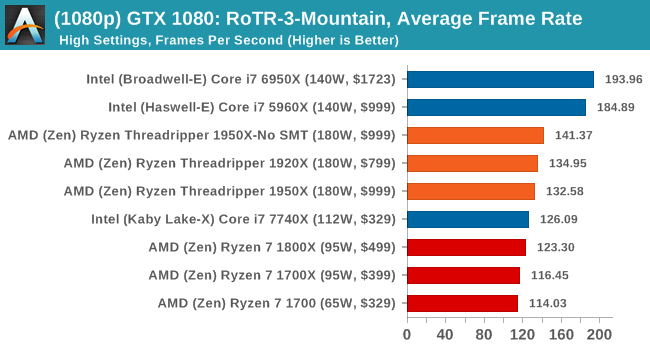
#3 Spine of the Mountain Geothermal Valley
MSI GTX 1080 Gaming 8G Performance
1080p
4K

ASUS GTX 1060 Strix 6G Performance
1080p
4K
Sapphire Nitro R9 Fury 4G Performance
1080p
4K
Sapphire Nitro RX 480 8G Performance
1080p
The 4K
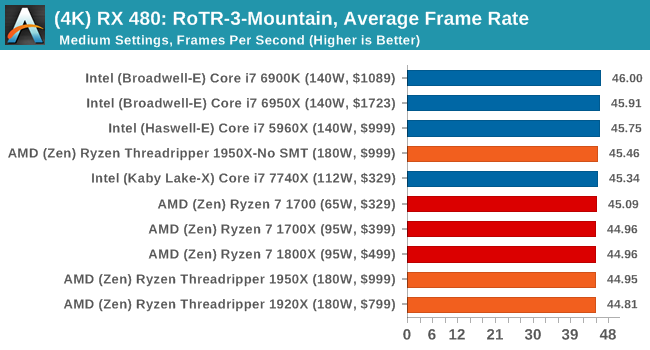
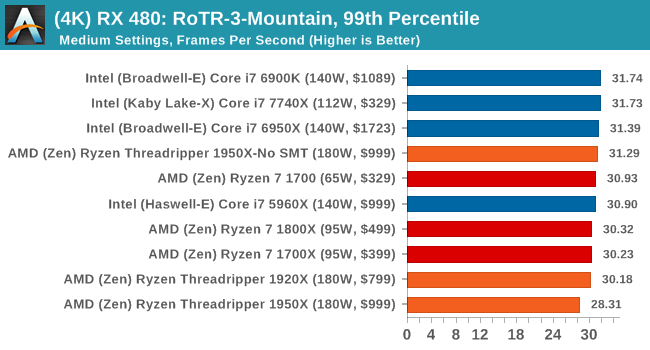
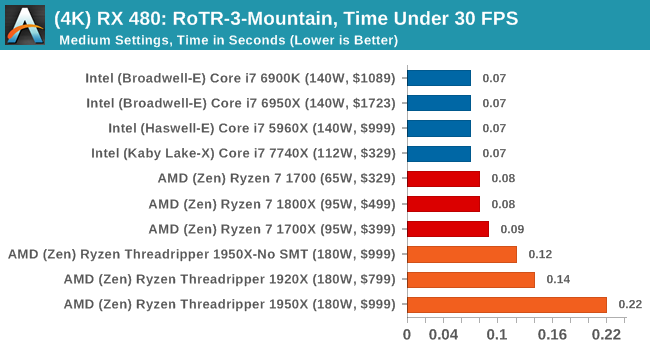
It's clear from these results that the 1950X is not the best gaming chip when in its default mode.


347 Comments
View All Comments
verl - Thursday, August 10, 2017 - link
"well above the Ryzen CPUs, and batching the 10C/8C parts from Broadwell-E and Haswell-E respectively"??? From the Power Consumption page.
bongey - Thursday, August 10, 2017 - link
Yep if you use AVX-512 it will down clock to 1.8Ghz and draw 400w just for the CPU alone and 600w from the wall. See der8auer's video title "The X299 VRM Disaster (en)", all x299 motherboards VRMs can be ran into thermal shutdown under avx 512 loads, with just a small overclock, not to mention avx512 crazy power consumption. That is why AMD didn't put avx 512 in Zen, it is power consumption monster.TidalWaveOne - Thursday, August 10, 2017 - link
Glad I went with the 7820X for software development (compiling).raddude9 - Thursday, August 10, 2017 - link
In ars' review they have TR-1950X ahead of the i9-7900X for compilation:https://arstechnica.co.uk/gadgets/2017/08/amd-thre...
In short it's very difficult to test compilation, every project you build has different properties.
emn13 - Thursday, August 10, 2017 - link
Yeah, the discrepency is huge - converted to anandtech's compile's per day the arstechnica benchmark maxes out at a little less than 20, which is a far cry from the we see here.Clearly, the details of the compiler, settings and codebase (and perhaps other things!) matter hugely.
That's unfortunate, because compilation is annoyingly slow, and it would be a boon to know what to buy to ameliorate that.
prisonerX - Thursday, August 10, 2017 - link
This is very compiler dependent. My compiler is blazingly fast on my wimpy hardware becuase it's blazingly clever. Most compilers seem to crawl no matter what they run on.bongey - Thursday, August 10, 2017 - link
Looks like anandtech's benchmark for compiling is bunk, it's just way off from all the other benchmarks out there. Not only that, no other test shows a 20% improvement over the 6950x which is also a 10 core/20 thread cpu. Something tells me the 7900x is completely wrong or has something faster like a different pcie ssd.Chad - Thursday, August 10, 2017 - link
All I know is, for those of us running Plex, SABnzbd, Sonarr, Radarr servers simultaneously (and others), while encoding and gaming all simultaneously, our day has arrived!:)
Ian Cutress - Thursday, August 10, 2017 - link
We checked with Ars as to their method.We use a fixed late March build around v56 under MSVC
Ars use a fixed newer build around v62 via clang-cl using VC++ linking
Same software, different compilers, different methods. Our results are faster than Ars, although Ars' results seem to scale better.
ddriver - Friday, August 11, 2017 - link
Of every review out there, only your "superior testing methodology" presents a picture where TR is slower than SX.