The AMD Ryzen Threadripper 1950X and 1920X Review: CPUs on Steroids
by Ian Cutress on August 10, 2017 9:00 AM ESTCreator Mode and Game Mode
*This page was updated on 8/17. A subsequent article with new information has been posted.
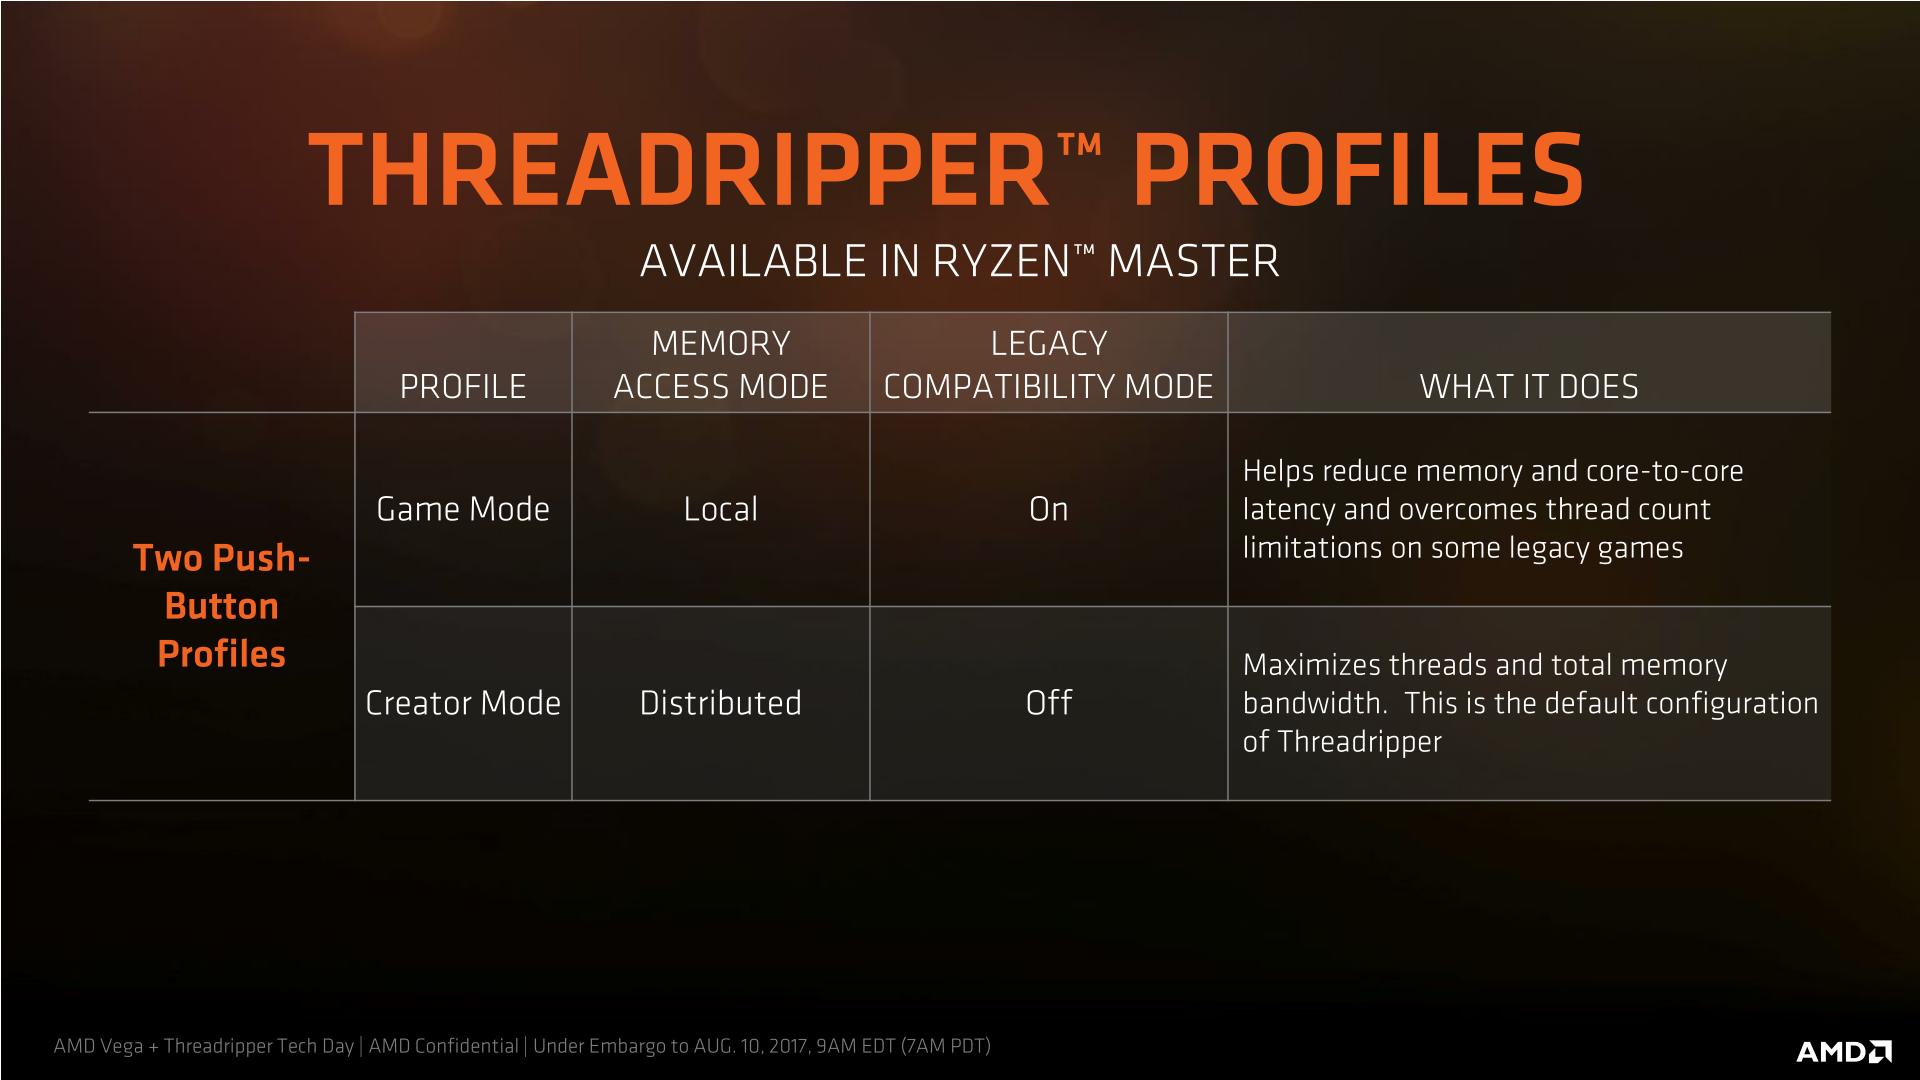
Due to the difference in memory latency between the two pairs of memory channels, AMD is implementing a ‘mode’ strategy for users to select depending on their workflow. The two modes are called Creator Mode (default), and Game Mode, and control two switches in order to adjust the performance of the system.
The two switches are:
- Legacy Compatibility Mode, on or off (off by default)
- Memory Mode: UMA vs NUMA (UMA by default)
The first switch disables the cores in one fo the silicon dies, but retains access to the DRAM channels and PCIe lanes. When the LCM switch is off, each core can handle two threads and the 16-core chip now has a total of 32 threads. When enabled, the system cuts half the cores, leaving 8 cores and 16 threads. This switch is primarily for compatibility purposes, as certain games (like DiRT) cannot work with more than 20 threads in a system. By reducing the total number of threads, these programs will be able to run. Turning the cores in one die off also alleviates some potential pressure in the core microarchitecture for cross communication.
The second switch, Memory Mode, puts the system into a unified memory architecture (UMA) or a non-unified memory architecture (NUMA) mode. Under the default setting, unified, the memory and CPU cores are seen as one massive block to the system, with maximum bandwidth and an average latency between the two. This makes it simple for code to understand, although the actual latency for a single instruction will be a good +20% faster or slower than the average, depending on which memory bank it is coming from.

NUMA still gives the system the full memory, but splits the memory and cores into into two NUMA banks depending on which pair of memory channels is nearest the core that needs the memory. The system will keep the data for a core as near to it as possible, giving the lowest latency. For a single core, that means it will fill up the memory nearest to it first at half the total bandwidth but a low latency, then the other half of the memory at the same half bandwidth at a higher latency. This mode is designed for latency sensitive workloads that rely on the lower latency removing a bottleneck in the workflow. For some code this matters, as well as some games – low latency can affect averages or 99th percentiles for game benchmarks.
The confusing thing about this switch is that AMD is calling it ‘Memory Access Mode’ in their documents, and labeling the two options as Local and Distributed. This is easier to understand than the SMT switch, in that the Local setting focuses on the latency local to the core (NUMA), and the Distributed setting focuses on the bandwidth to the core (UMA), with Distributed being default.
- When Memory Access Mode is Local, NUMA is enabled (Latency)
- When Memory Access Mode is Distributed, UMA is enabled (Bandwidth, default)
So with that in mind, there are four ways to arrange these two switches. AMD has given two of these configurations specific names to help users depending on how they use their system: Creator Mode is designed to give as many threads as possible and as much memory bandwidth as possible. Game Mode is designed to optimize for latency and compatibility, to drive game frame rates.
| AMD Threadripper Options | |||||
| Words That Make Sense | Marketing Spiel | ||||
| Ryzen Master Profile |
Two Dies or One Die |
Memory Mode |
Legacy Compatibility Mode |
Memory Access Mode |
|
| Creator Mode | Two | UMA | Off | Distributed | |
| - | Two | NUMA | Off | Local | |
| - | One | UMA | On | Distributed | |
| Game Mode | One | NUMA | On | Local | |
There are two ways to select these modes, although this is also a confusing element to this situation.
The way I would normally adjust these settings is through the BIOS, however the BIOS settings do not explicitly state ‘Creator Mode’ and ‘Game Mode’. They should give immediate access for the Memory Mode, where ASUS has used the Memory Access naming for Local and Distributed, not NUMA and UMA. For the Legacy Compatibility Mode, users will have to dive several screens down into the Zen options and manually switch off eight of the cores, if the setting is going to end up being visible to the user. This makes Ryzen Master the easiest way to implement Game Mode.
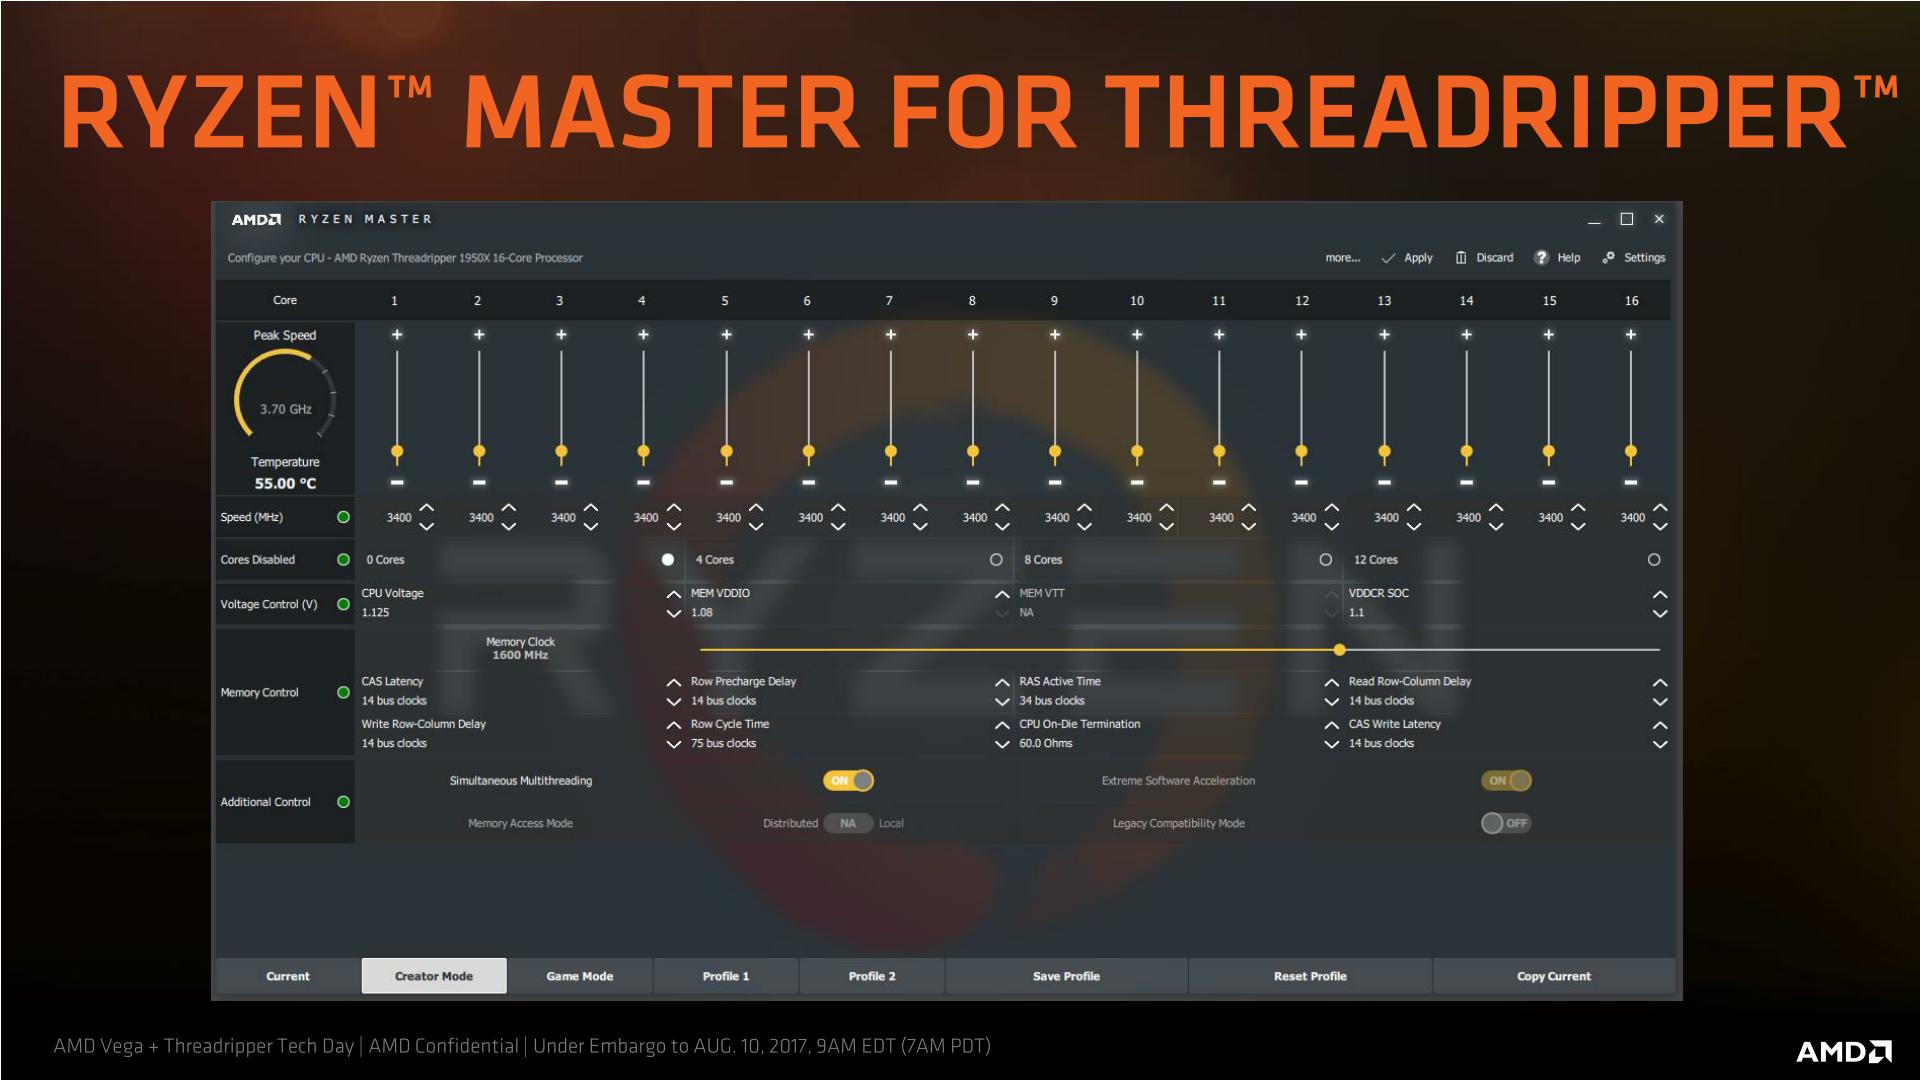
While we were testing Threadripper, AMD updated Ryzen Master several times to account for the latest updates, so chances are that by the time you are reading this, things might have changed again. But the crux is that Creator Mode and Game Mode are not separate settings here either. Instead, AMD is labelling these as ‘profiles’. Users can select the Creator Mode profile or the Game Mode profile, and within those profiles, the two switches mentioned above (labelled as Legacy Compatibility Mode and Memory Access Mode) will be switched as required.
Cache Performance
As an academic exercise, Creator Mode and Game Mode make sense depending on the workflow. If you don’t need the threads and want the latency bump, Game Mode is for you. The perhaps odd thing about this is that Threadripper is aimed at highly threaded workloads more than gaming, and so losing half the threads in Game Mode might actually be a detriment to a workstation implementation. That being said, users can leave SMT on and still change the memory access mode on its own, although AMD is really focusing more on the Creator and Game mode specifically.
For this review, we tested both Creator (default) and Game modes on the 16-core Threadripper 1950X. As an academic exercise we looked into memory latency in both modes, as well as at higher DRAM frequencies. These latency numbers take the results for the core selected (we chose core 2 in each case) and then stride through to hit L1, L2, L3 and main memory. For UMA systems like in Creator Mode, main memory will be an average between the near and far memory results. We’ve also added in here a Ryzen 5 1600X as an example of a single Zeppelin die, and a 6950X Broadwell for comparison. All CPUs were run at DDR4-2400, which is the maximum supported at two DIMMs per channel.
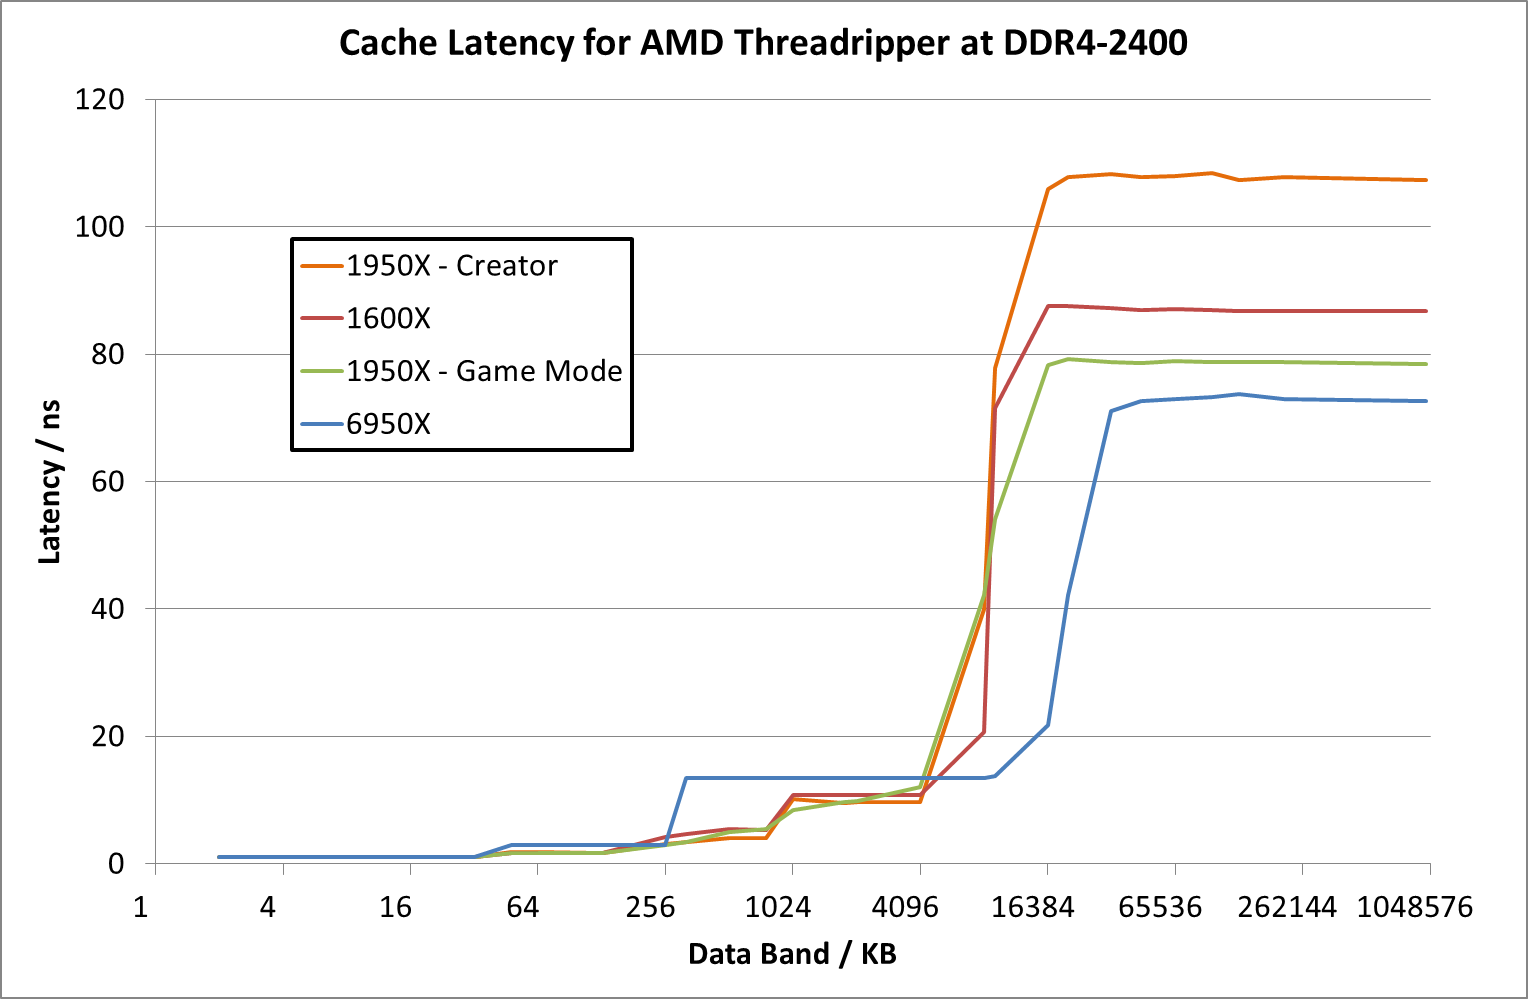
For the 1950X in the two modes, the results are essentially equal until we hit 8MB, which is the L3 cache limit per CCX. After this, the core bounces out to main memory, where the Game mode sits around 79ns while the Creator mode is at 108 ns. By comparison the Ryzen 5 1600X seems to have a lower latency at 8MB (20ns vs 41 ns), and then sits between the Creator and Game modes at 87 ns. It would appear that the bigger downside of Creator mode in this way is the fact that main memory accesses are much slower than normal Ryzen or in Game mode.
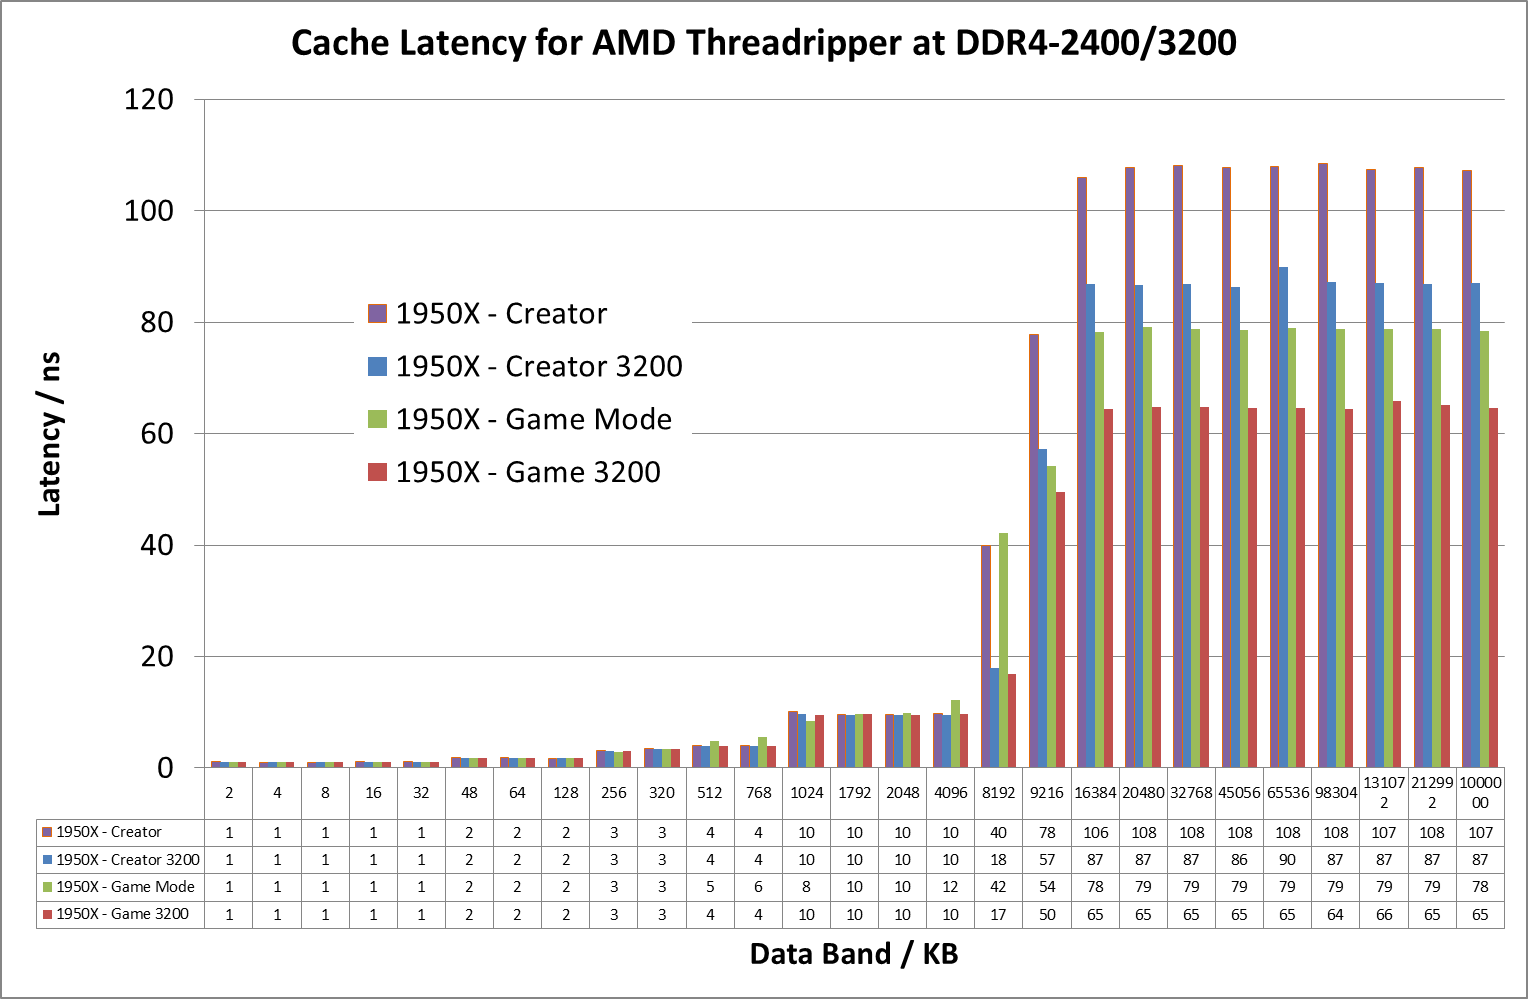
If we crank up the DRAM frequency to DDR4-3200 for the Threadripper 1950X, the numbers change a fair bit:
Click for larger image
Up until the 8MB boundary where L3 hits main memory, everything is pretty much equal. At 8MB however, the latency at DDR4-2400 is 41ns compared to 18ns at DDR4-3200. Then out into full main memory sees a pattern: Creator mode at DDR4-3200 is close to Game Mode at DDR4-2400 (87ns vs 79ns), but taking Game mode to DDR4-3200 drops the latency down to 65ns.
Another element we tested while in Game Mode was the latency for near memory and far memory as seen from a single core. Remember this slide from AMD’s deck?
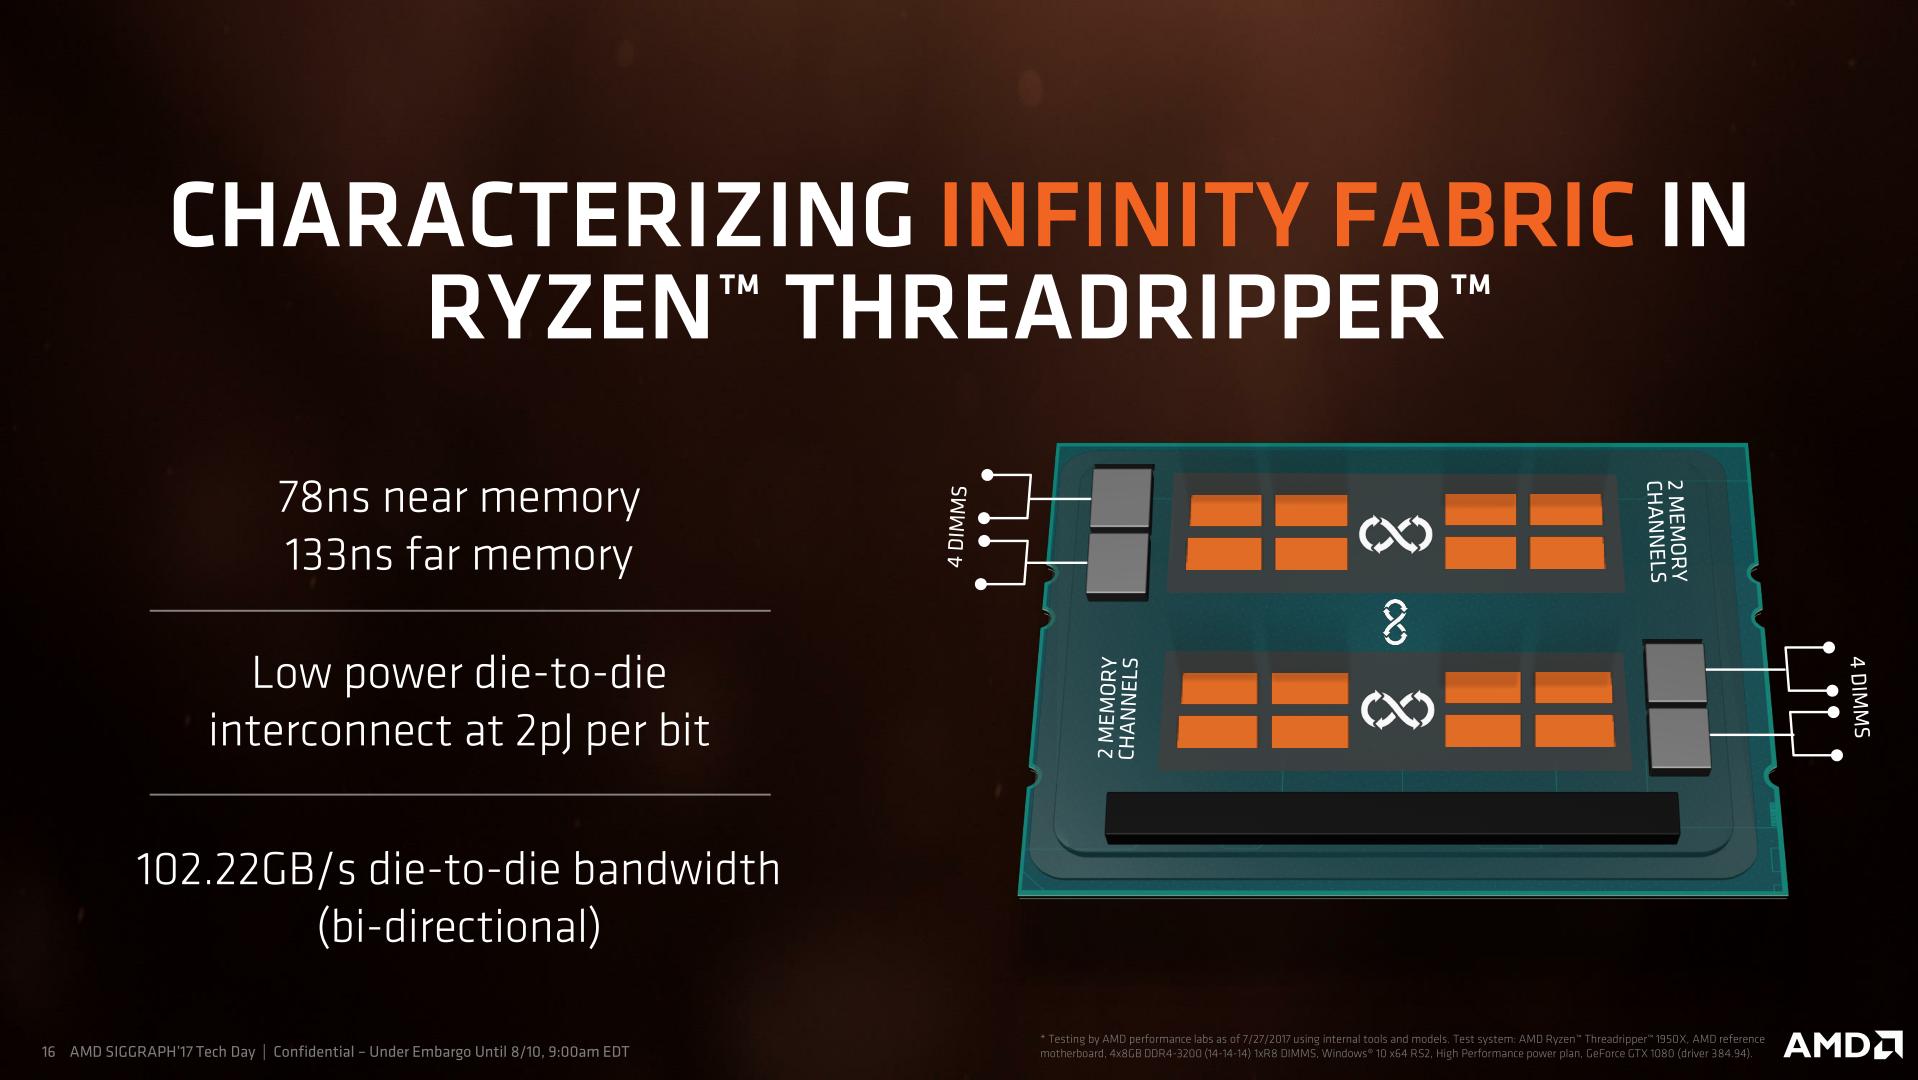
In our testing, we achieved the following:
- At DDR4-2400, 79ns near memory and 136ns far memory (108ns average)
- At DDR4-3200, 65ns near memory and 108ns far memory (87ns average)
Those average numbers are what we get for Creator mode by default, indicating that the UMA mode in Creator mode will just use memory at random between the two.


347 Comments
View All Comments
blublub - Sunday, August 13, 2017 - link
From what I have read is that all TR do 3.9hhz and some even 4-4.1ghz on all cores .What are your temp when running all 10c @4.6ghz prime for 1-2hrs
Zingam - Sunday, August 13, 2017 - link
Ian, how about testing mobile CPUs - for games and for office work. Aren't mobile CPUs selling much larger numbers thatn desktop ones these days?I can't find a single benchmark comparing i5-7300hq vs i7-7700hq vs i7-7700K showing the difference in productivity workloads and not just for rendering pretty pictures but also for more specific tasks as compiling software etc.
I also would like to see some sort of comparison of new generation to all generations upto 10 years back in time. I'd like to know how much did performance increase since the age of Nehelem. At least from now on there should be a single test to display the relative performance increase over the last few generations. The average user doesn't upgrade their PC every year. The average user maybe upgrades every 5 years and it is really difficult to find out how much peformance increase would one get with an upgrade.
SanX - Sunday, August 13, 2017 - link
I agree, there must be 5-7 years old processors in the chartsSanX - Sunday, August 13, 2017 - link
Why one core of Apple A10 costs $10 but one core of Intel 7900x costs 10x more?oranos - Sunday, August 13, 2017 - link
so its complete dogsh*t for the segment which is driving the PC market right now: gaming. got it.ballsystemlord - Sunday, August 13, 2017 - link
Hey Ian, you've been talking about anandtech's great database where we can see all the cool info. Well, according to your database the Phenom II 6 core 1090T is equally powerful when compared to the 16 core threadripper!!!!!!! http://www.anandtech.com/bench/product/1932?vs=146With those sorts of numbers why would anyone plan an upgrade?
(And there is also only one metric displayed, strange!)
Not to play the Intel card on you as others do, but this is a serious problem for at least the AMD lineup of processors.
jmelgaard - Monday, August 14, 2017 - link
o.O... I don't know how you derived that conclusion? you need a guide on how to read the database?...BurntMyBacon - Monday, August 14, 2017 - link
For anyone looking for an overall fps for two pass encoding here is your equation (hope my math is correct):FPS = 2*FPS1*FPS2/(FPS2+FPS1)
No, you can't just average the FPS scores from each pass as the processor will spend more time in the slower pass.
For the x264 encoding test, for example, a few relevant FPS scores end up being:
i9-7900X: 122.56
i7-7820X: 114.37
i7-6900K: 95.26
i7-7740X: 82.74
TR-1950X: 118.13
TR-1950X(g): 117.00
TR-1920X: 111.74
R7-1800X: 100.19
Since two pass encoding requires both passes to be usable, getting an overall FPS score seems somewhat relevant. Alternately, using time to completion is would present the same information in a different manner. Though, it would be difficult to extrapolate performance results to estimate performance in other encodes without also posting the number of frames encoded.
goldgrenade - Thursday, January 4, 2018 - link
Take all those Intel FPS performance counters and multiply them by .7 and you have what their chips actually run at without a major security flaw in them.Let's see that would be...
i9-7900X: 85.792
i7-7820X: 80.059
i7-6900K: 66.682
i7-7740X: 57.918
And that's at best. It can be up to 50% degradation when rendering or having to do many small file accesses or repeated operations with KAISER.
Gastec - Tuesday, August 15, 2017 - link
I've having a hard time trying to swallow "Threadripper is a consumer focused product" line considering the prices to "consume" it: $550 for the MB, $550 for the TR1900X ($800 or $1000 for the others is just dreaming) then the RAM. The MB(at least the Asus one) should be $200 less, but I get it, they are trying to squeeze as much as possible from the...consumers. Now don't get me wrong and I mean no offence for the rich ones among you, but those CPU are for Workstations. WORK, not gamestations. Meaning you would need them to help you make your money, faster.