The AMD Ryzen Threadripper 1950X and 1920X Review: CPUs on Steroids
by Ian Cutress on August 10, 2017 9:00 AM ESTAshes of the Singularity Escalation
Seen as the holy child of DirectX12, Ashes of the Singularity (AoTS, or just Ashes) has been the first title to actively go explore as many of DirectX12s features as it possibly can. Stardock, the developer behind the Nitrous engine which powers the game, has ensured that the real-time strategy title takes advantage of multiple cores and multiple graphics cards, in as many configurations as possible.

As a real-time strategy title, Ashes is all about responsiveness during both wide open shots but also concentrated battles. With DirectX12 at the helm, the ability to implement more draw calls per second allows the engine to work with substantial unit depth and effects that other RTS titles had to rely on combined draw calls to achieve, making some combined unit structures ultimately very rigid.
Stardock clearly understand the importance of an in-game benchmark, ensuring that such a tool was available and capable from day one, especially with all the additional DX12 features used and being able to characterize how they affected the title for the developer was important. The in-game benchmark performs a four minute fixed seed battle environment with a variety of shots, and outputs a vast amount of data to analyze.
For our benchmark, we run a fixed v2.11 version of the game due to some peculiarities of the splash screen added after the merger with the standalone Escalation expansion, and have an automated tool to call the benchmark on the command line. (Prior to v2.11, the benchmark also supported 8K/16K testing, however v2.11 has odd behavior which nukes this.)
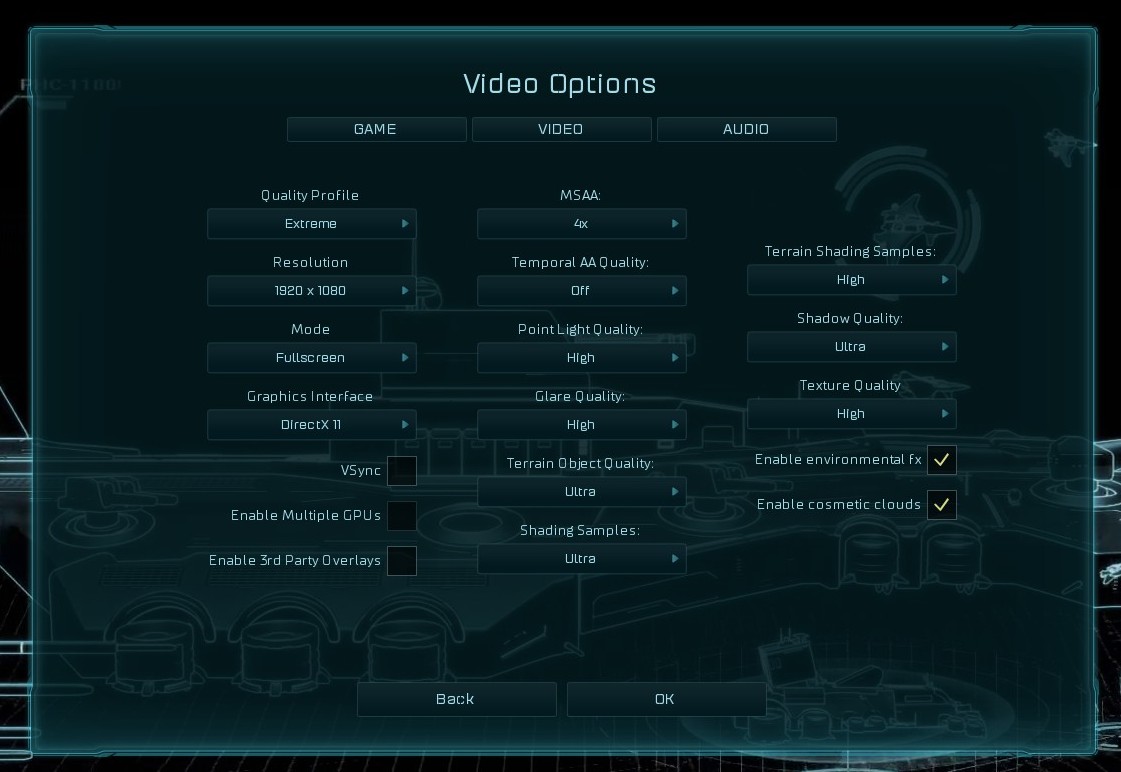
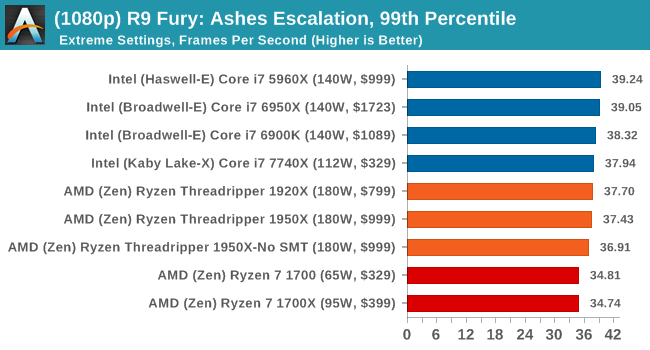
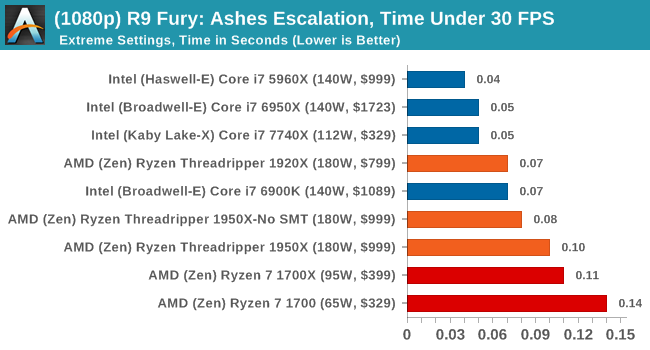
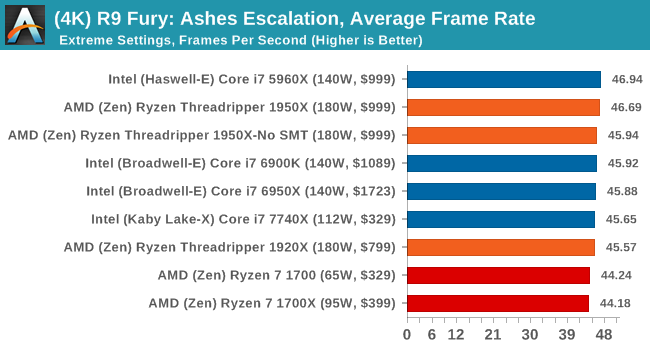
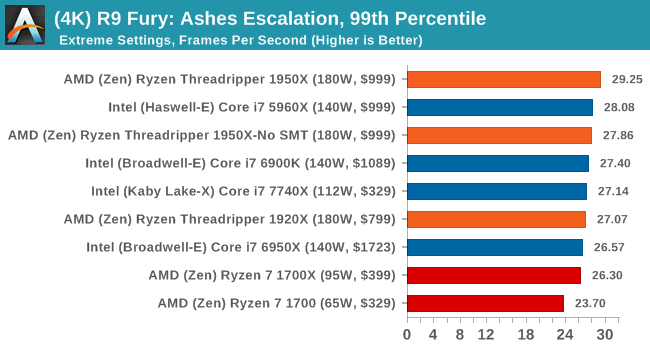
At both 1920x1080 and 4K resolutions, we run the same settings. Ashes has dropdown options for MSAA, Light Quality, Object Quality, Shading Samples, Shadow Quality, Textures, and separate options for the terrain. There are several presents, from Very Low to Extreme: we run our benchmarks at Extreme settings, and take the frame-time output for our average, percentile, and time under analysis.
All of our benchmark results can also be found in our benchmark engine, Bench.
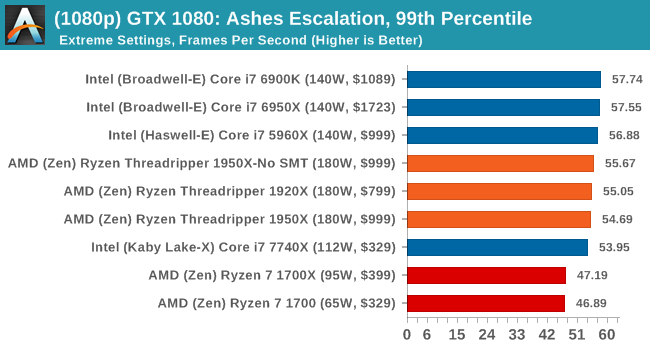
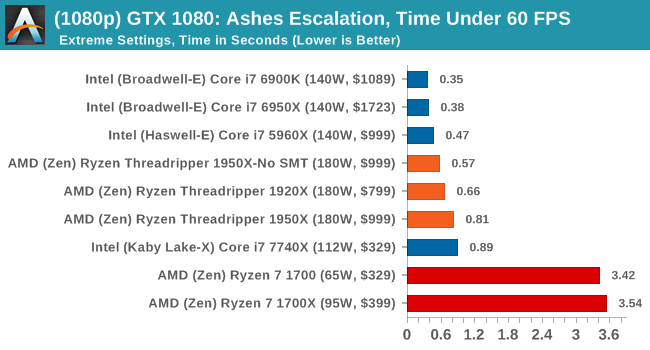
MSI GTX 1080 Gaming 8G Performance
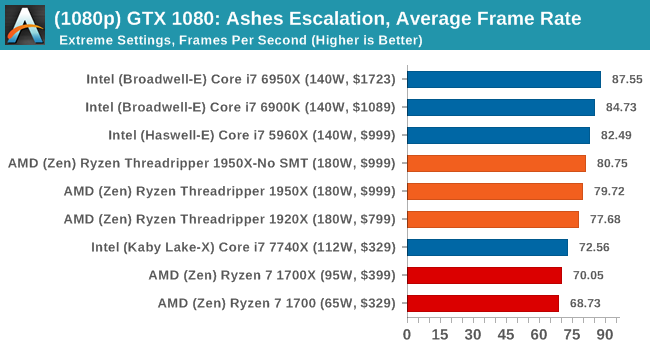
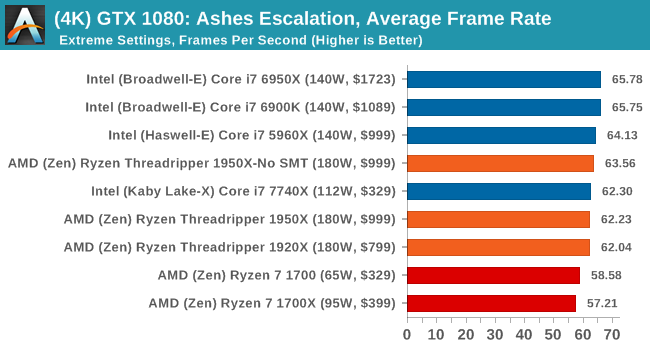
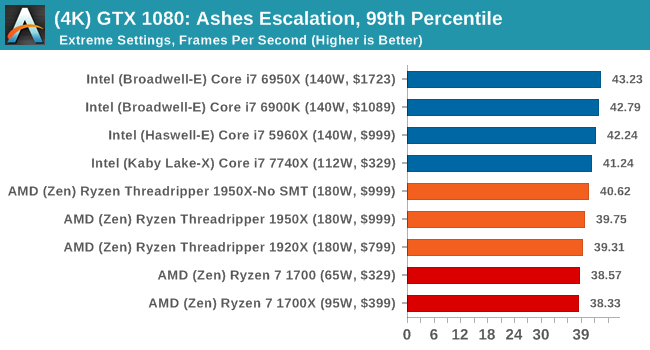
1080p
4K
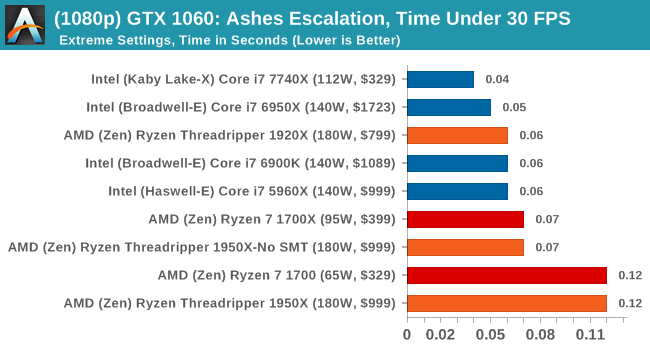
ASUS GTX 1060 Strix 6G Performance

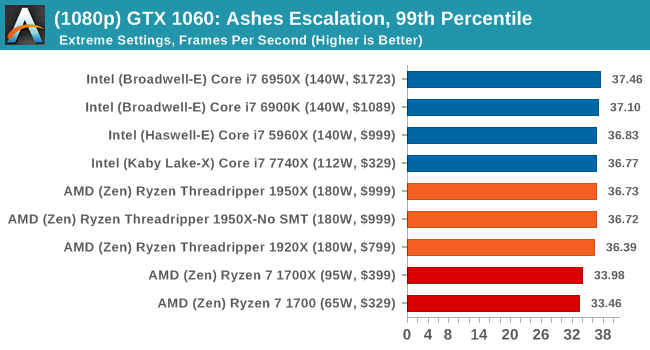
1080p
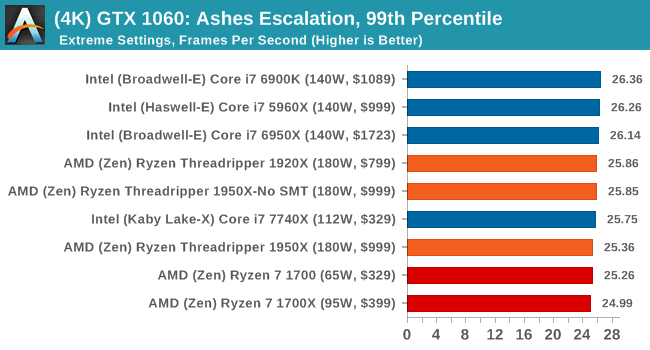
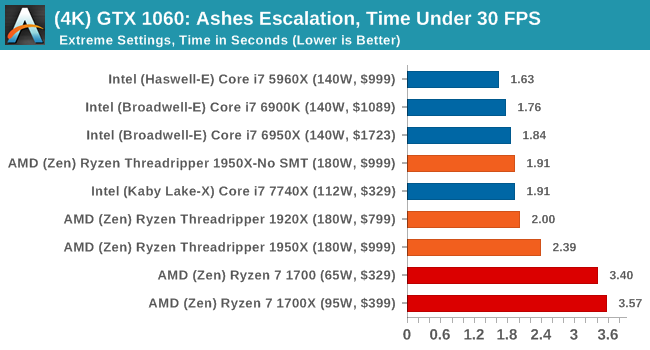
4K

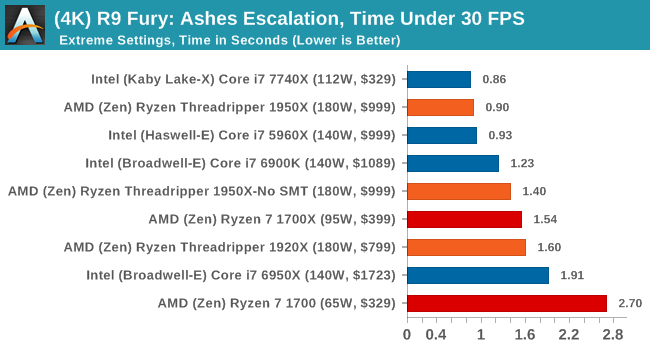
Sapphire Nitro R9 Fury 4G Performance
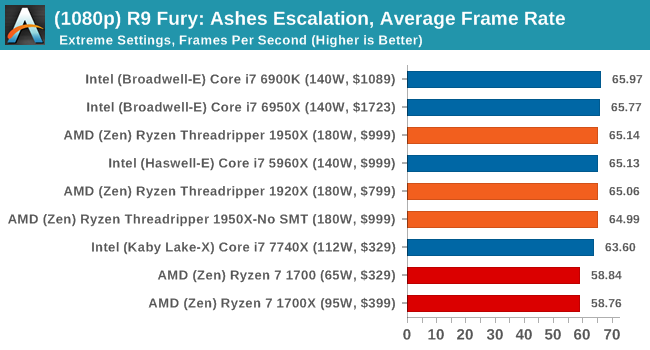
1080p
4K
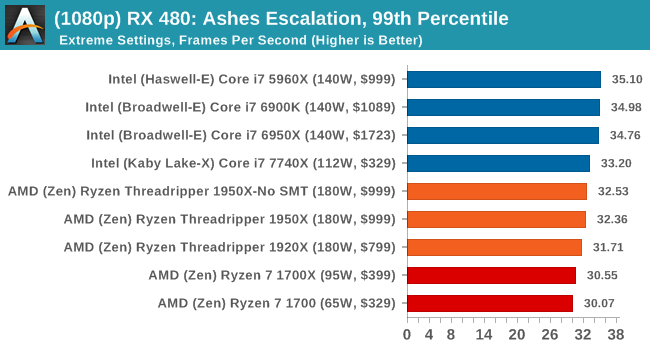
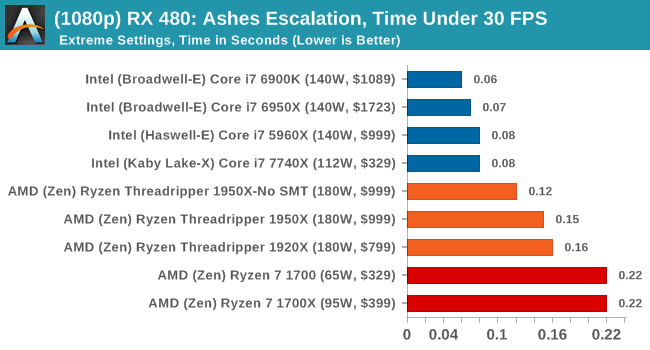
Sapphire Nitro RX 480 8G Performance
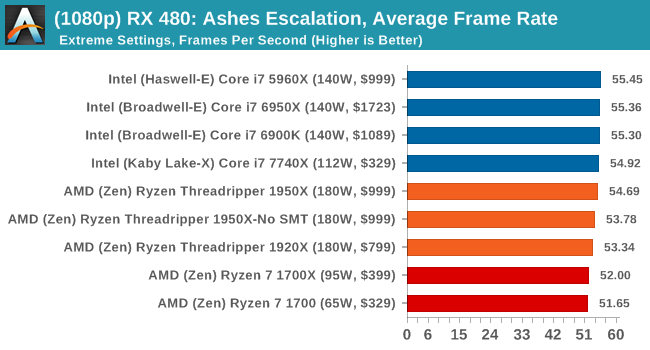
1080p
4K
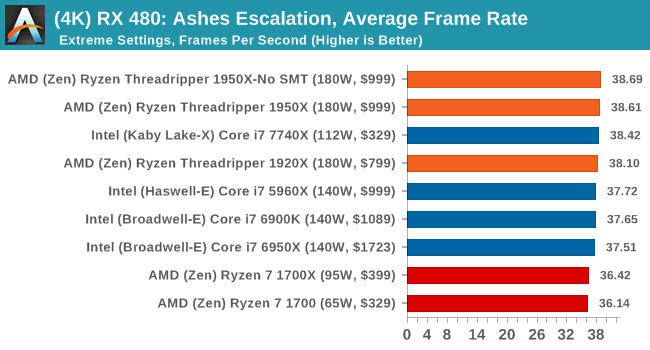
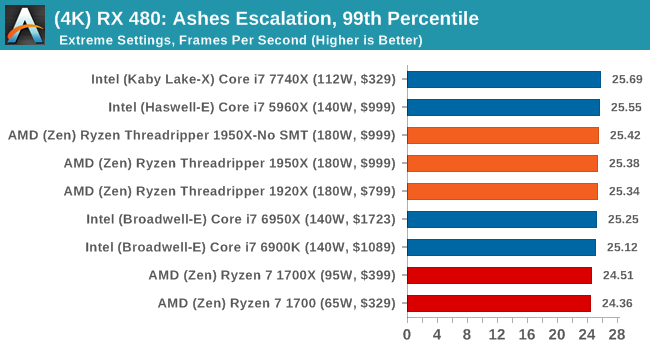
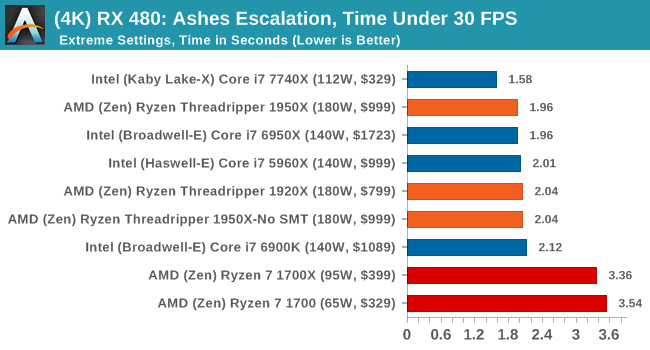
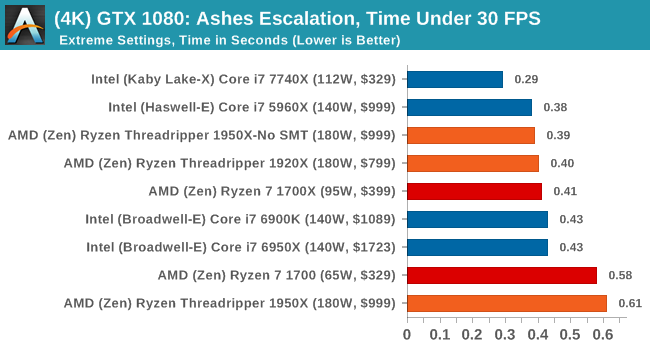
AMD gets in the mix a lot with these tests, and in a number of cases pulls ahead of the Ryzen chips in the Time Under analysis.


347 Comments
View All Comments
Notmyusualid - Sunday, August 13, 2017 - link
Yep, I'll get the door for him.Jeff007245 - Friday, August 11, 2017 - link
I don't comment much (if ever), but I have to say one thing... I miss Anand's reviews. What happened to AnandTech?What ever happened to IPC testing when IPC used to be compared on a clock for clock basis? I remember the days when IPC used to be Instructions Per Clock, and this website and others would even use a downclock/overclock processors at a nominal clock rate to compare the performance of each processor's IPC. Hell, even Bulldozer with a high clock architecture was downclocked to compare is "relative IPC" in regards using a nominal clockrate.
And to add to what other's are saying about the bias in the review... Honestly, I have been feeling the same way for some time now. Must be because AnandTech is at the "MERCY" of their mother company Purch Media... When you are at the mercy of your advertisers, you have no choice but to bend the knee, or even worse, bend over and do as they say "or else"...
Thanks for taking the time in creating this review, but AnandTech to me is no longer AnandTech... What other's say is true, this place is only good for the Forums and the very technical community that is still sticking around.
fanofanand - Tuesday, August 15, 2017 - link
Downclocking and overclocking processors to replicate a different processor within the same family can lead to inaccurate results, as IPC can and does rely (at least to a degree) on cache size and structure. I get what you are saying, but I think Ian's work is pretty damn good.SloppyFloppy - Friday, August 11, 2017 - link
Why did you leave out the i9s from the gaming tests?Why didn't you include the 7700k when you include 1800x for gaming tests?
People want to know that if they buy a $1k 7900X or 1950X if it's not only great for media creation/compiling but also gaming.
silverblue - Friday, August 11, 2017 - link
Stated why at the bottom of page 1. Also, he used the 7740X, so there is little to no point in putting the 7700K.Lolimaster - Friday, August 11, 2017 - link
The 1950X is as good at gaming as the 1800X, OCed 1700, with many more cpu resource to toy with.Swp1996 - Friday, August 11, 2017 - link
Thats The Best Title I have ever seen ...😂😂😂😂🤣🤣🤣🤣🤣 Steroids 😂😂😂🤣🤣🤣🤣🤣🤣🤣corinthos - Friday, August 11, 2017 - link
in other words.. AMD Ryzen is still the best bet for most people, and the best value. 1700 OC'd all day!BillBear - Friday, August 11, 2017 - link
>Move on 10-15 years and we are now at the heart of the Core Wars: how many CPU cores with high IPC can you fit into a consumer processor? Up to today, the answer was 10, but now AMD is pushing the barrier to 16I don't personally think of Threadripper or parts like Broadwell-E as being consumer level parts.
For me, the parts most consumers use have been using for the last decade have been Intel parts with two cores or four cores at the high end.
It's been a long period of stagnation, with cutting power use on mobile parts being the area that saw the most attention and improvement.
James S - Friday, August 11, 2017 - link
Agree the HEDT platforms are not for the average consumer they are for enthusiasts, professional workstation usage, and some other niche uses.When the frequency war stopped and the IPC war started. We should have had the core competition 5-8 years back since IPC stagnated to a couple percent gains year on year.