The AMD Ryzen Threadripper 1950X and 1920X Review: CPUs on Steroids
by Ian Cutress on August 10, 2017 9:00 AM ESTCPU Legacy Tests
Our legacy tests represent benchmarks that were once at the height of their time. Some of these are industry standard synthetics, and we have data going back over 10 years. All of the data here has been rerun on Windows 10, and we plan to go back several generations of components to see how performance has evolved.
All of our benchmark results can also be found in our benchmark engine, Bench.
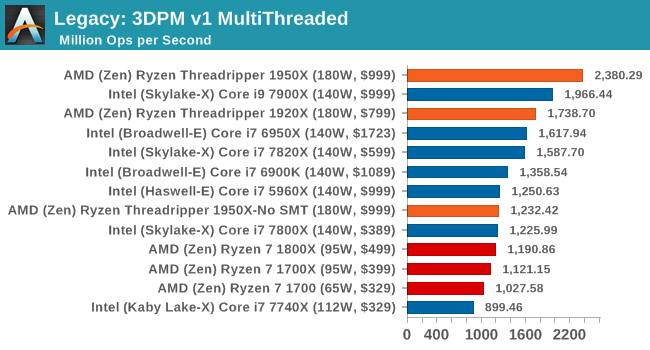
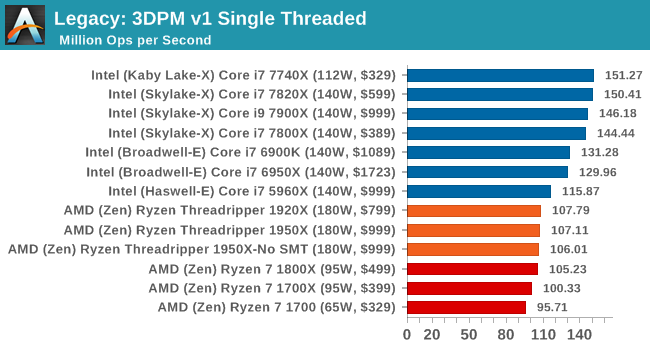
3D Particle Movement v1
3DPM is a self-penned benchmark, taking basic 3D movement algorithms used in Brownian Motion simulations and testing them for speed. High floating point performance, MHz and IPC wins in the single thread version, whereas the multithread version has to handle the threads and loves more cores. This is the original version, written in the style of a typical non-computer science student coding up an algorithm for their theoretical problem, and comes without any non-obvious optimizations not already performed by the compiler, such as false sharing.
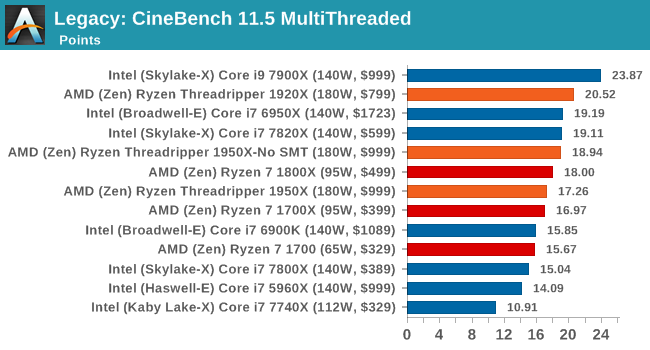
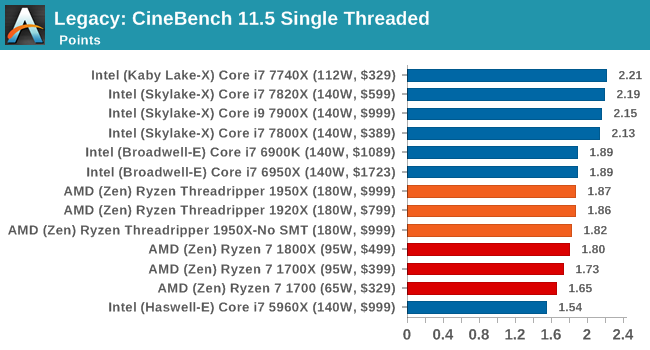
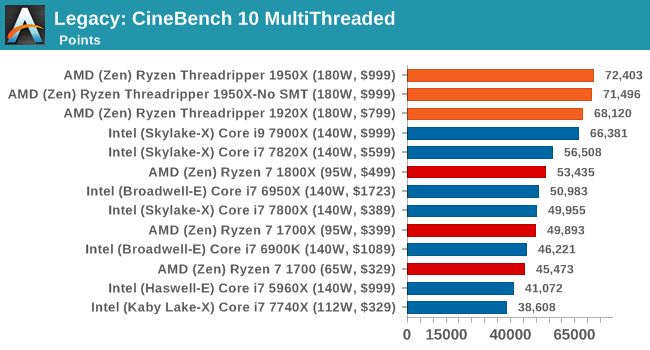
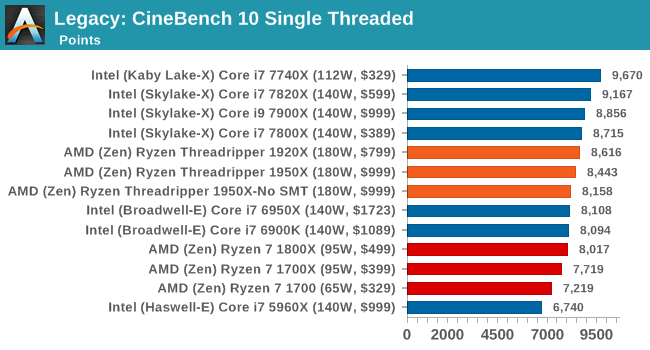
CineBench 11.5 and 10
Cinebench is a widely known benchmarking tool for measuring performance relative to MAXON's animation software Cinema 4D. Cinebench has been optimized over a decade and focuses on purely CPU horsepower, meaning if there is a discrepancy in pure throughput characteristics, Cinebench is likely to show that discrepancy. Arguably other software doesn't make use of all the tools available, so the real world relevance might purely be academic, but given our large database of data for Cinebench it seems difficult to ignore a small five minute test. We run the modern version 15 in this test, as well as the older 11.5 and 10 due to our back data.
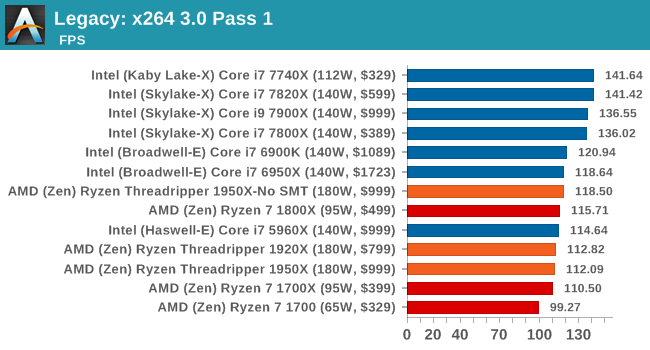
x264 HD 3.0
Similarly, the x264 HD 3.0 package we use here is also kept for historic regressional data. The latest version is 5.0.1, and encodes a 1080p video clip into a high-quality x264 file. Version 3.0 only performs the same test on a 720p file, and in most circumstances the software performance hits its limit on high-end processors, but still works well for mainstream and low-end. Also, this version only takes a few minutes, whereas the latest can take over 90 minutes to run.
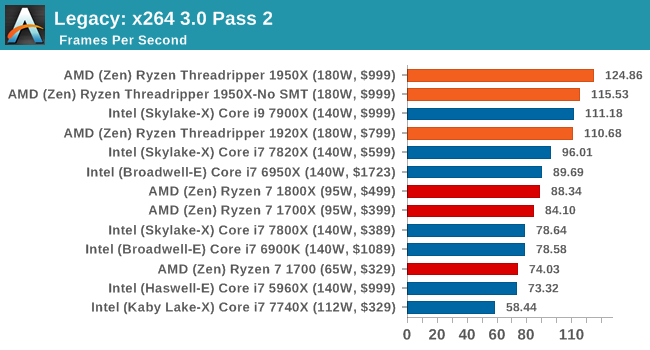
The 1950X: the first CPU to score higher on the 2nd pass of this test than it does on the first pass.


347 Comments
View All Comments
Lolimaster - Friday, August 11, 2017 - link
Adding useless singe thread benchs for people that will pay $600+ for many cores is plain stupidity like that useless open a pdf test.casperes1996 - Saturday, August 12, 2017 - link
Why do you bother replying to these, Ian? I love your enthusiasm about what you do, and am happy that you reply to comments, but as you state yourself, no matter what you say, you'll be called a shill on more than a weekly basis by either side no matter what you do. Intel shill, AMD shill, Apple shill, Nvidia shill and so on. There's no stopping it, because you just can't please the people who go into something wanting a specific result. Well, you can if you give them that result, but sometimes, facts aren't what you want them to be, and some people don't accept that.Cheers, mate
Diji1 - Thursday, August 10, 2017 - link
You sound like a crazy person.Notmyusualid - Saturday, August 12, 2017 - link
@ Diji1You are correct.
He is implying just because we want HEDT platforms / chips, that we care nothing for single-threaded performance.
He is a true AMD fan-boi, as you will see over time.
lordken - Thursday, August 10, 2017 - link
@Johan Steyn: while I agree with you that the Intel piece with PR slide at the top was a little bit lame, I even lolled at "most scalable" part (isn't something like "glued" zen the most scalable design?) I think this review is good and goes also around architecture etc., there were few instances during reading when it seemed odd wording or being unnecessarily polite toward intel's shortcoming/deficit but I cant even remember them now.Though I was surprised about power numbers, as Toms measured much higher W for 7900X , 160-200 and with TTF even up to 250-331 , but here 7800/7900x had only ~150W.
Also this sentence is odd
"All the Threadripper CPUs hit around 177W, just under the 180W TDP, while the Skylake-X CPUs move to their 140W TDP." move to their? They are above the TDP...why not state it clearly?
tamalero - Thursday, August 10, 2017 - link
Im sratching my head on power consumption as well. Almost all reviewers shows that the i9's consume more than threadripper.Could be the motherboard used?
Some used the Zenith and other reviewers used the ASROCK retail one.
smilingcrow - Thursday, August 10, 2017 - link
Power consumption can vary a lot depending on the type of task and the exact nature of that task.So you should expect a lot of variation across reviews.
Johan Steyn - Thursday, August 10, 2017 - link
The amount of tests on games in this review is unbalanced. Also read my reply to Ian.Extremely well stated: " unnecessarily polite toward Intel's shortcoming" Sometimes I think these guys think all are complete mindless drones.
carewolf - Thursday, August 10, 2017 - link
It has always been like this here. This was pretty neutral by Anandtech standards, they even admitted it when it was faster.Johan Steyn - Thursday, August 10, 2017 - link
Please read my response to Ian, I think you are not looking close enough to what is happening here.