The AMD Ryzen 3 1300X and Ryzen 3 1200 CPU Review: Zen on a Budget
by Ian Cutress on July 27, 2017 9:30 AM EST- Posted in
- CPUs
- AMD
- Zen
- Ryzen
- Ryzen 3
- Ryzen 3 1300X
- Ryzen 3 1200
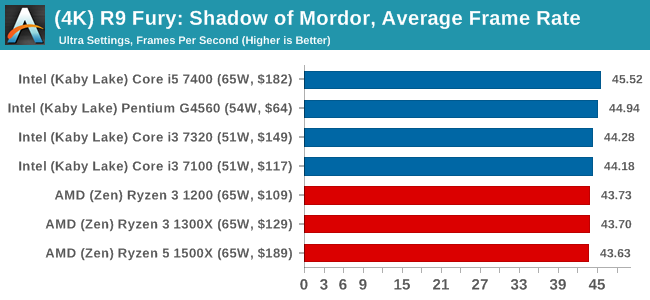
Shadow of Mordor
The next title in our testing is a battle of system performance with the open world action-adventure title, Middle Earth: Shadow of Mordor (SoM for short). Produced by Monolith and using the LithTech Jupiter EX engine and numerous detail add-ons, SoM goes for detail and complexity. The main story itself was written by the same writer as Red Dead Redemption, and it received Zero Punctuation’s Game of The Year in 2014.

A 2014 game is fairly old to be testing now, however SoM has a stable code and player base, and can still stress a PC down to the ones and zeroes. At the time, SoM was unique, offering a dynamic screen resolution setting allowing users to render at high resolutions that are then scaled down to the monitor. This form of natural oversampling was designed to let the user experience a truer vision of what the developers wanted, assuming you had the graphics hardware to power it but had a sub-4K monitor.
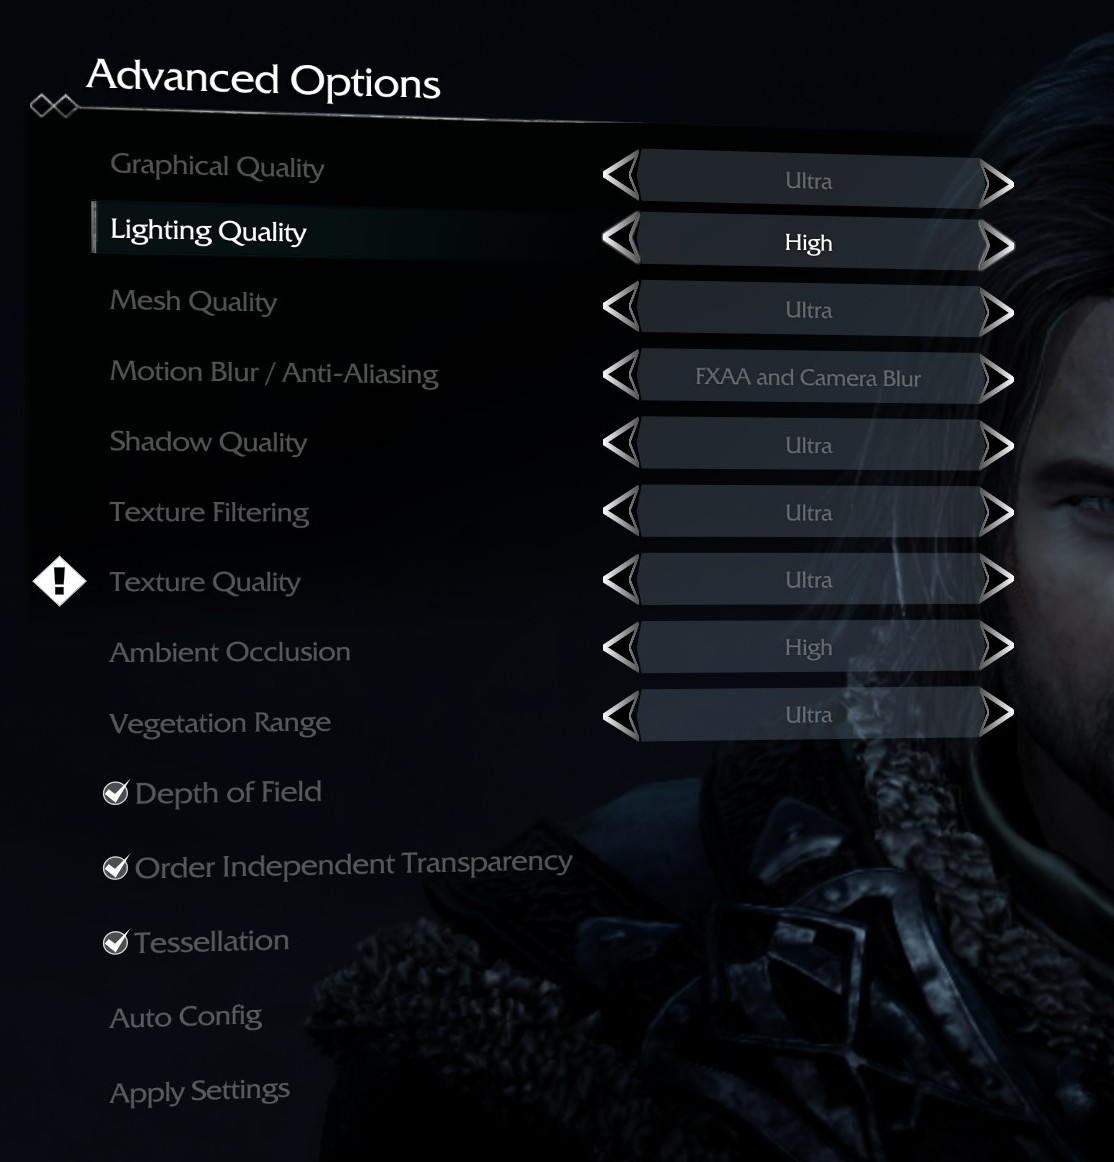
The title has an in-game benchmark, for which we run with an automated script implement the graphics settings, select the benchmark, and parse the frame-time output which is dumped on the drive. The graphics settings include standard options such as Graphical Quality, Lighting, Mesh, Motion Blur, Shadow Quality, Textures, Vegetation Range, Depth of Field, Transparency and Tessellation. There are standard presets as well.
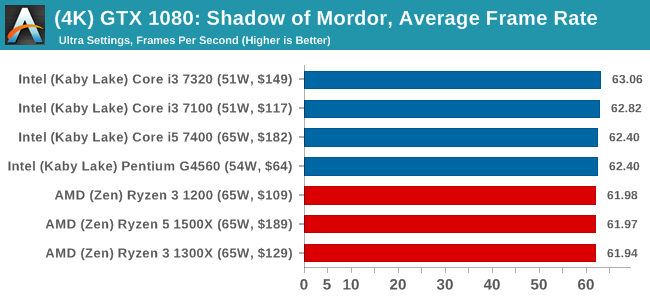
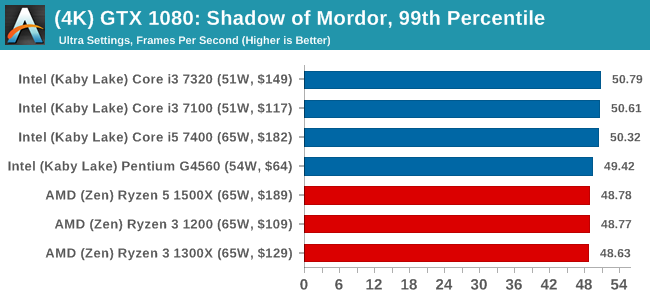
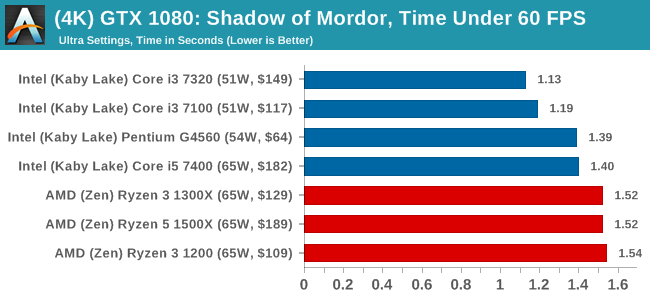
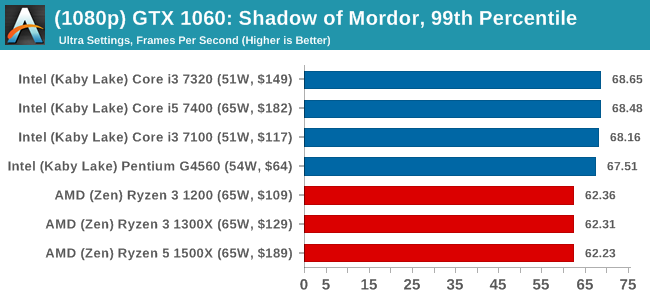
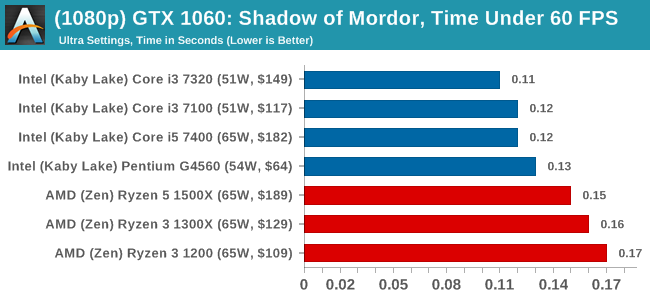
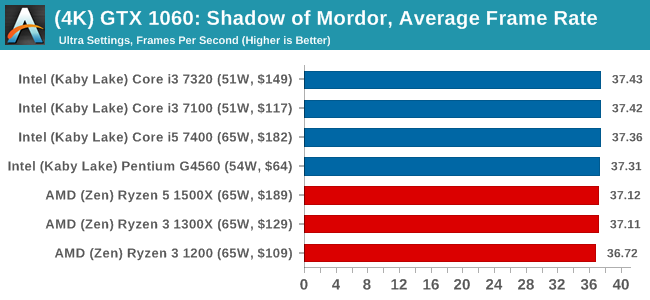
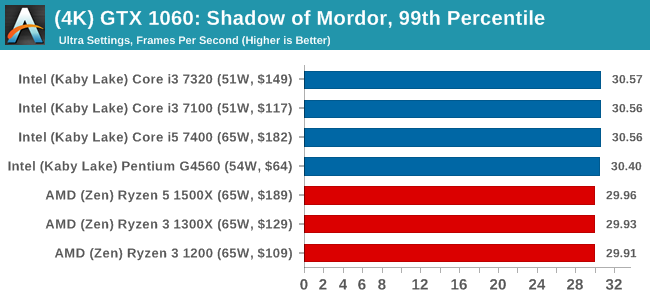
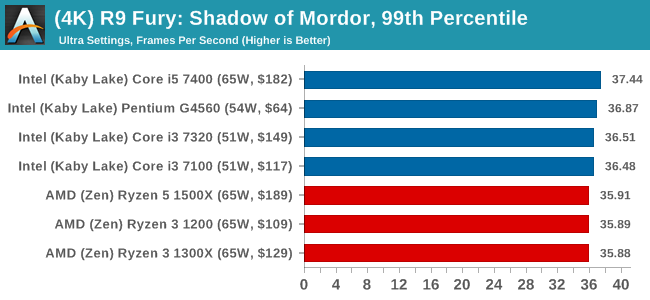
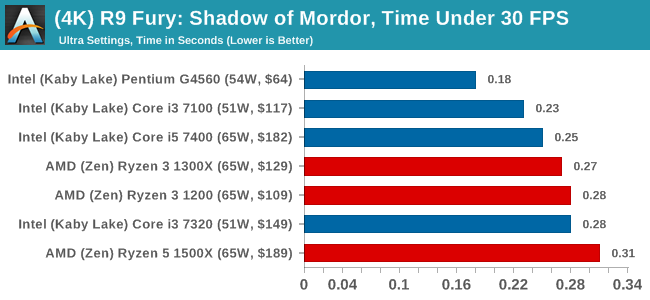
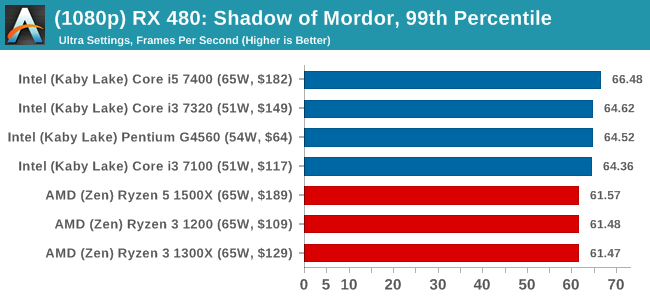
We run the benchmark at 1080p and a native 4K, using our 4K monitors, at the Ultra preset. Results are averaged across four runs and we report the average frame rate, 99th percentile frame rate, and time under analysis.
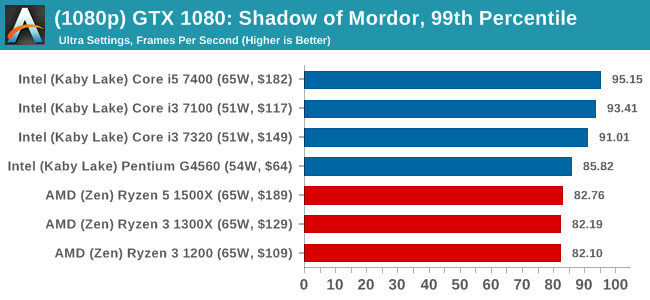
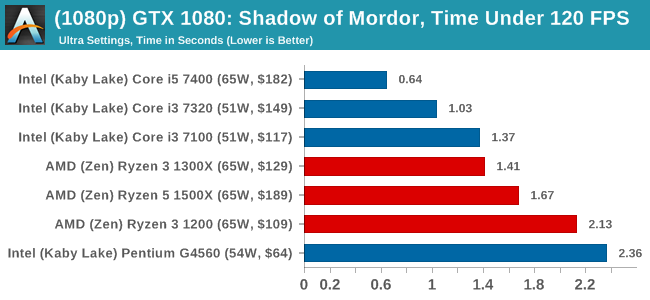
For all our results, we show the average frame rate at 1080p first. Mouse over the other graphs underneath to see 99th percentile frame rates and 'Time Under' graphs, as well as results for other resolutions. All of our benchmark results can also be found in our benchmark engine, Bench.
MSI GTX 1080 Gaming 8G Performance
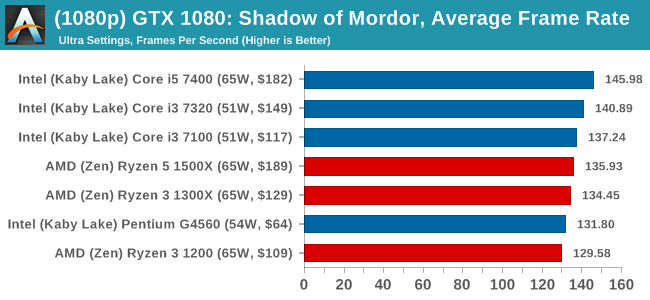
1080p
4K
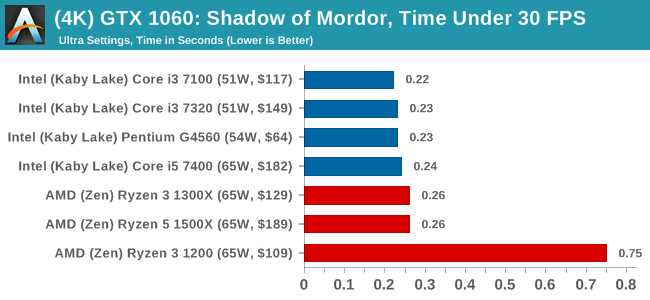
ASUS GTX 1060 Strix 6GB Performance
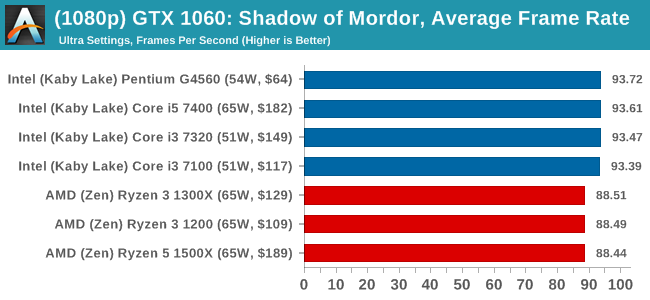
1080p
4K
Sapphire R9 Fury 4GB Performance
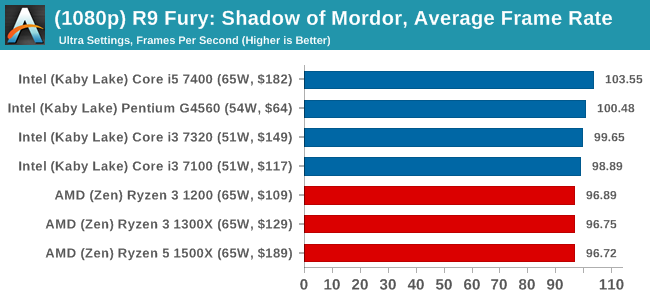
1080p
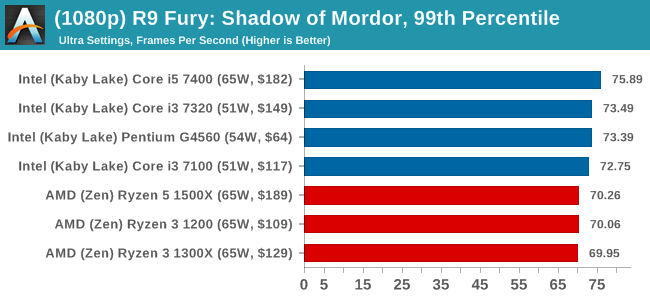
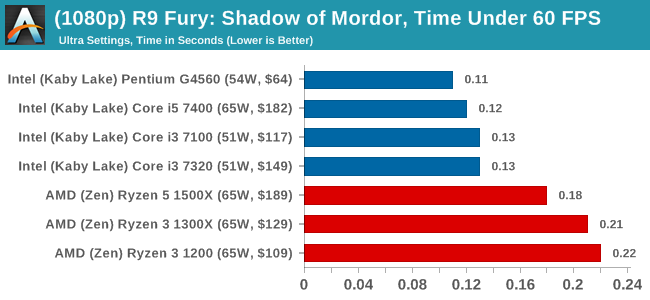
4K
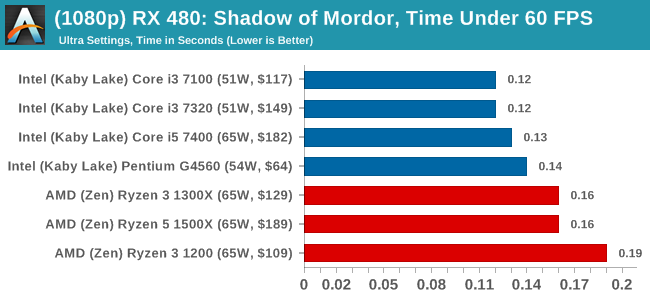
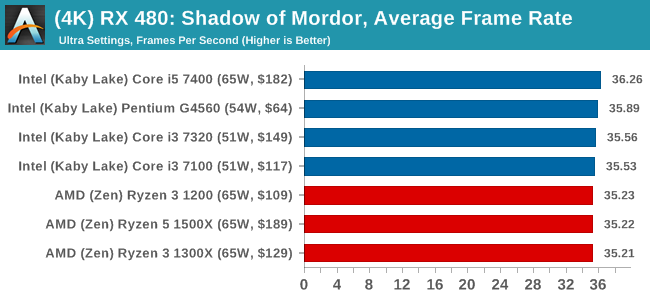
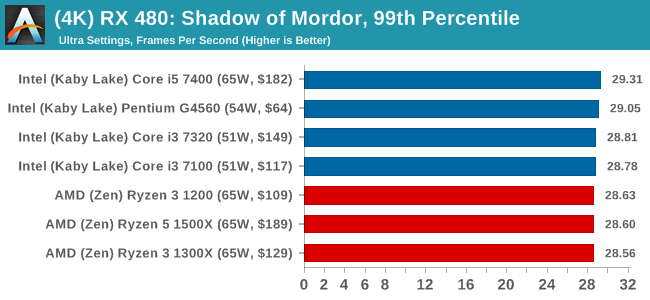
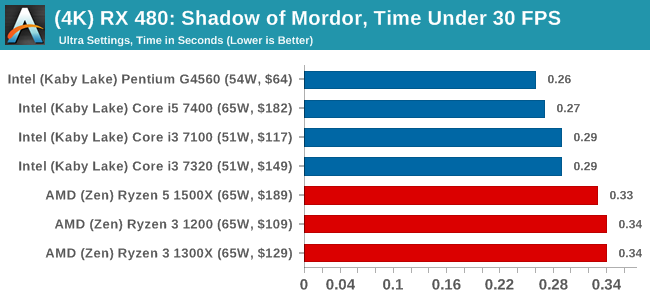
Sapphire RX 480 8GB Performance

1080p
4K


140 Comments
View All Comments
uibo - Thursday, July 27, 2017 - link
I thought you guys hated misleading scales on graphs.Looking at the performance per dollar graphs, I think the lowest point vertically should be -100%
lefenzy - Thursday, July 27, 2017 - link
That's silly. 0% is the zero on that graph, not some arbitrary -100%akrobet - Thursday, July 27, 2017 - link
Keep in mind that Intel is pulling the G4560 from the market, because it's "too good" for its price.MajGenRelativity - Thursday, July 27, 2017 - link
Source?MrCommunistGen - Thursday, July 27, 2017 - link
Not counting it as a "source" but I saw this pop up at wccftech. I didn't spend any time looking, but I haven't stumbled upon any corroboration on other sites in my tech reading.MajGenRelativity - Thursday, July 27, 2017 - link
I just found the article on wccftech. It actually said that Intel is NOT killing off the G4560T1beriu - Thursday, July 27, 2017 - link
wccftech....
....
BWHAHAHAHAHAHAH
GreenMeters - Thursday, July 27, 2017 - link
SHED does not exist. Ryzen 7 maps to the standard i7 market that has never been called HEDT. Threadripper is HEDT. The fact that it puts Intel's HEDT to shame doesn't mean it's a new segment. It means Intel better get with the program.Ian Cutress - Thursday, July 27, 2017 - link
Ryzen 7 was mapped against Intel's Broadwell-E HEDT platform at launch for core count, performance, and aggressive pricing. Threadripper is a stage above that, and isn't even called HEDT internally at AMD. Then we have the HCC core count silicon coming from Intel. SHED exists.DrKlahn - Thursday, July 27, 2017 - link
Ok I'm seriously beginning to wonder about the objectivity here. So your conclude this:"First is that the Ryzen 3 1200 does not look like an attractive option. It performs +2-3% of the Pentium but is $30 more expensive, and the Core i3-7100 beats it by 8% for only a sub-$10 cost."
But aren't mentioning that the Pentiums are locked parts and the 1200 isn't? Your competing sites do have overclocking data and the Pentiums are hopelessly outclassed. Granted not everyone overclocks, but on an enthusiast site that at least warrants a mention. Not everyone will read your followup(s) and that conclusion does not tell the full story. I know if I was building a machine a 1200 4 core that overclocks to 3.8-4GHz is well worth the $30.