The AMD Ryzen 3 1300X and Ryzen 3 1200 CPU Review: Zen on a Budget
by Ian Cutress on July 27, 2017 9:30 AM EST- Posted in
- CPUs
- AMD
- Zen
- Ryzen
- Ryzen 3
- Ryzen 3 1300X
- Ryzen 3 1200
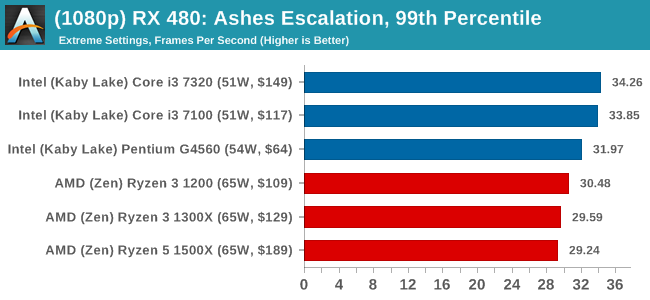
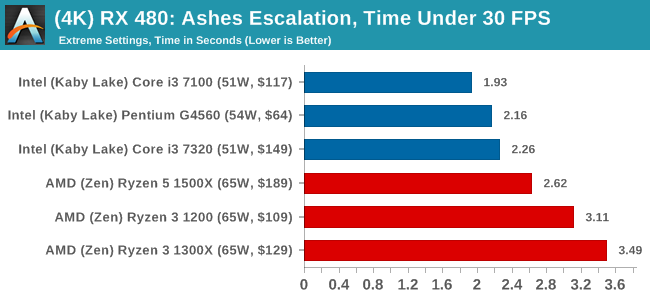
Ashes of the Singularity: Escalation
Seen as the holy child of DirectX12, Ashes of the Singularity (AoTS, or just Ashes) has been the first title to actively go explore as many of DirectX12s features as it possibly can. Stardock, the developer behind the Nitrous engine which powers the game, has ensured that the real-time strategy title takes advantage of multiple cores and multiple graphics cards, in as many configurations as possible.
As a real-time strategy title, Ashes is all about responsiveness during both wide open shots but also concentrated battles. With DirectX12 at the helm, the ability to implement more draw calls per second allows the engine to work with substantial unit depth and effects that other RTS titles had to rely on combined draw calls to achieve, making some combined unit structures ultimately very rigid.
Stardock clearly understand the importance of an in-game benchmark, ensuring that such a tool was available and capable from day one, especially with all the additional DX12 features used and being able to characterize how they affected the title for the developer was important. The in-game benchmark performs a four minute fixed seed battle environment with a variety of shots, and outputs a vast amount of data to analyze.
For our benchmark, we run a fixed v2.11 version of the game due to some peculiarities of the splash screen added after the merger with the standalone Escalation expansion, and have an automated tool to call the benchmark on the command line. (Prior to v2.11, the benchmark also supported 8K/16K testing, however v2.11 has odd behavior which nukes this.)
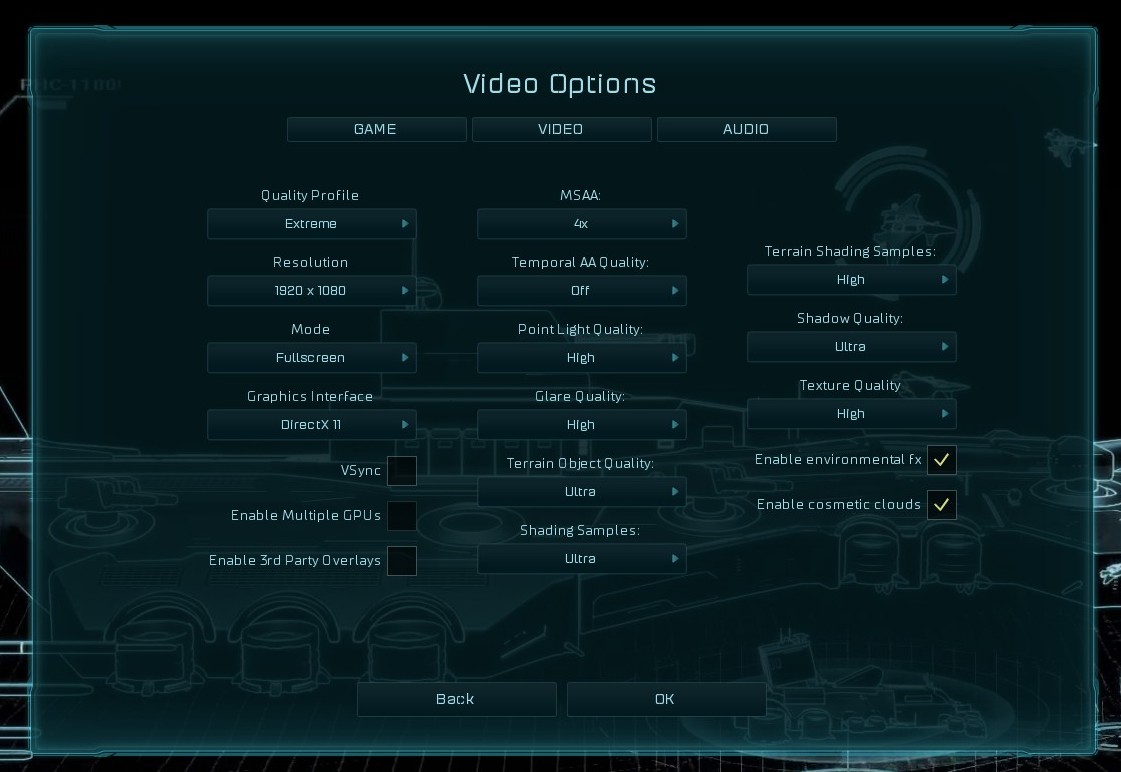
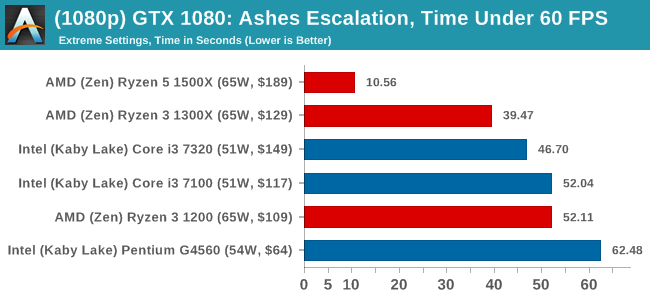
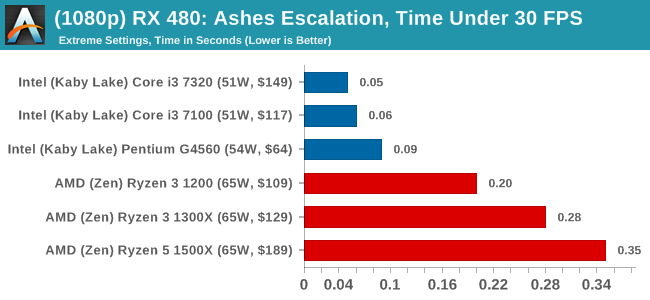
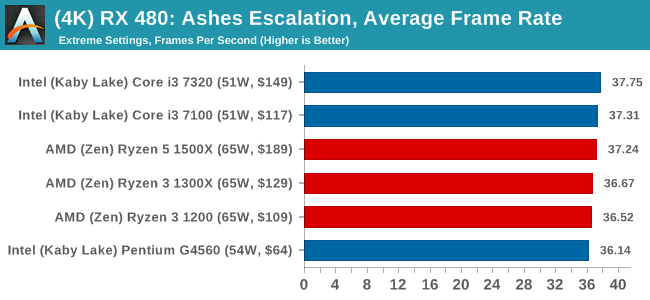
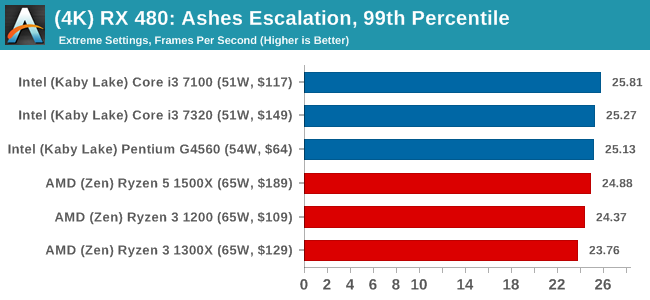
At both 1920x1080 and 4K resolutions, we run the same settings. Ashes has dropdown options for MSAA, Light Quality, Object Quality, Shading Samples, Shadow Quality, Textures, and separate options for the terrain. There are several presents, from Very Low to Extreme: we run our benchmarks at Extreme settings, and take the frame-time output for our average, percentile, and time under analysis.
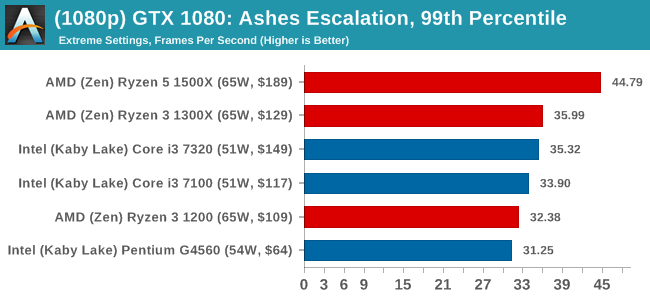
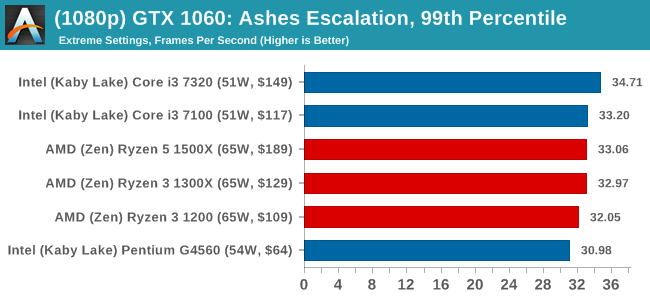
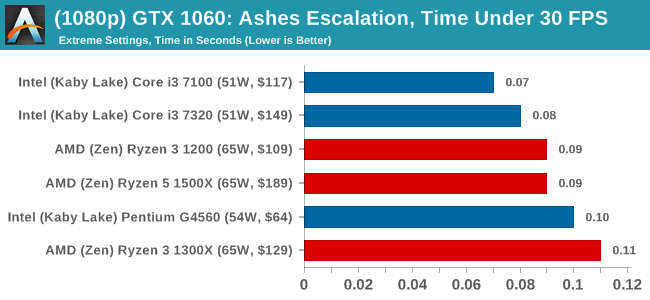
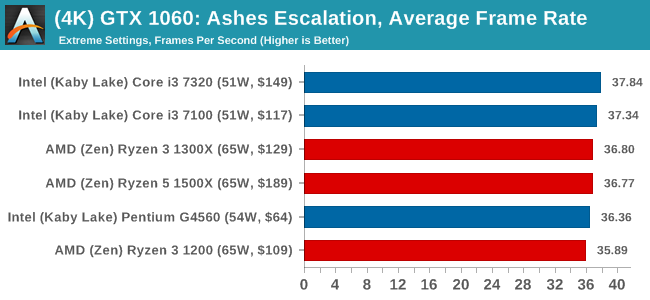
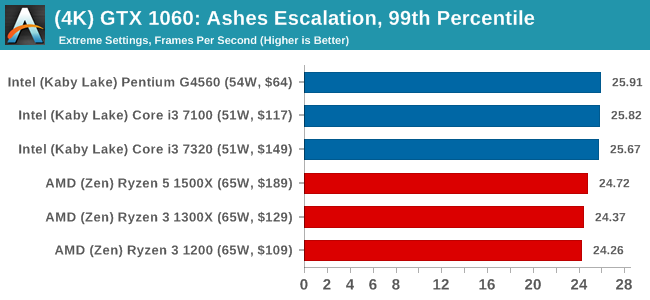
For all our results, we show the average frame rate at 1080p first. Mouse over the other graphs underneath to see 99th percentile frame rates and 'Time Under' graphs, as well as results for other resolutions. All of our benchmark results can also be found in our benchmark engine, Bench.
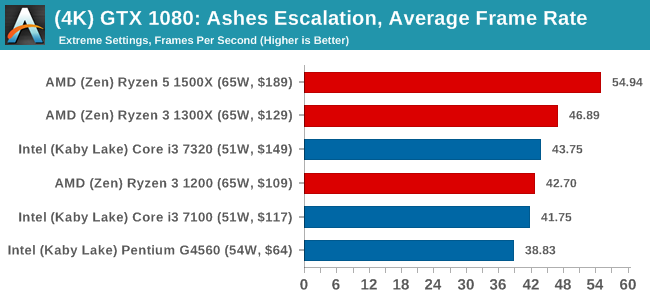
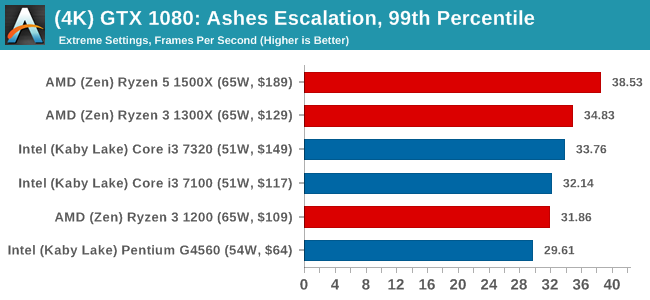
MSI GTX 1080 Gaming 8G Performance
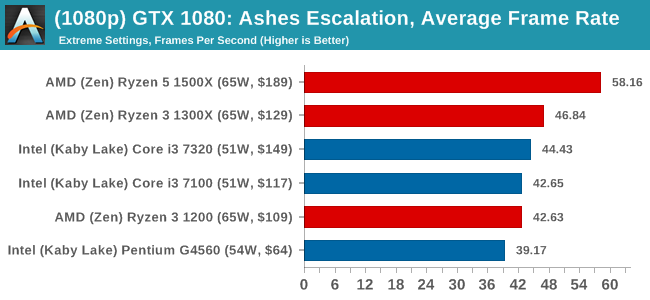
1080p
4K

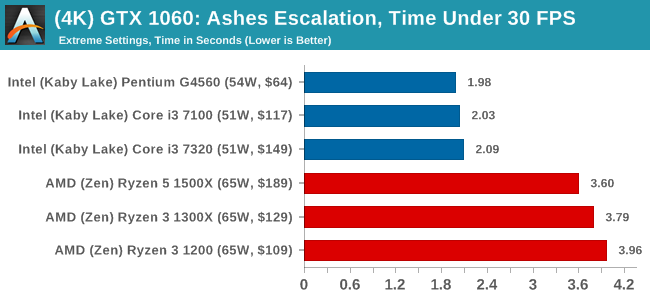
ASUS GTX 1060 Strix 6GB Performance
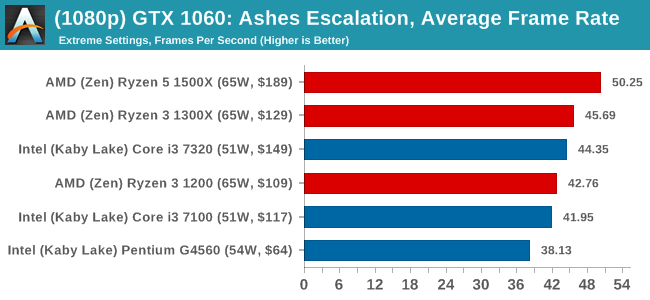
1080p
4K
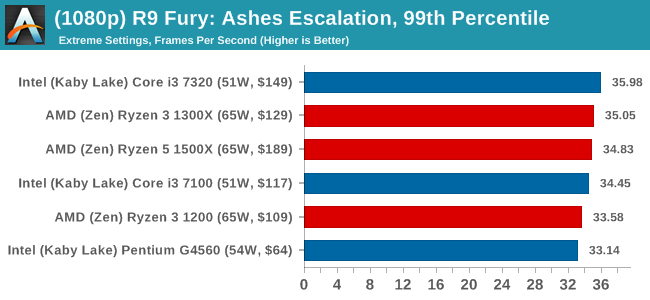
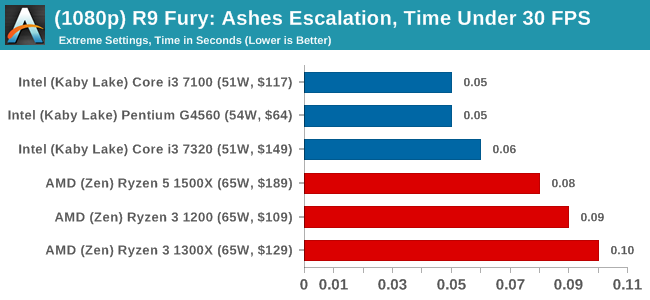
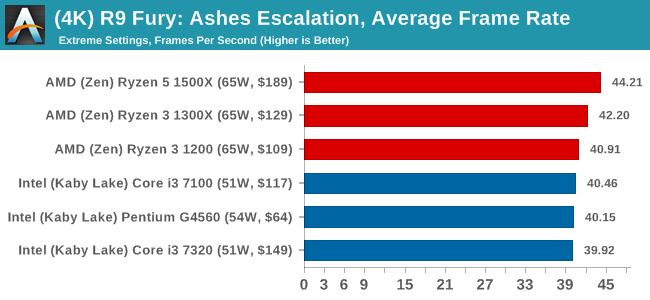
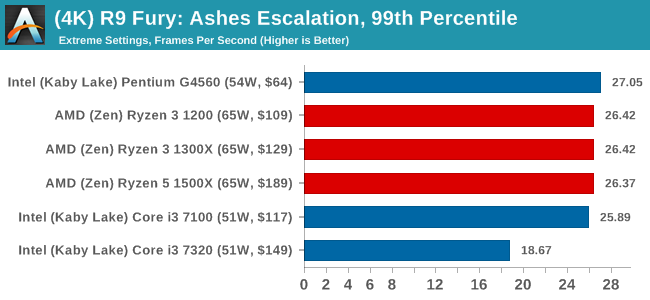
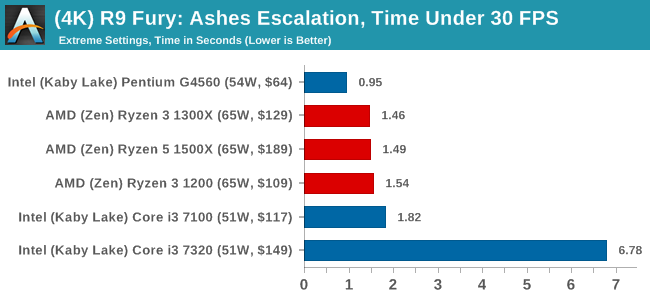
Sapphire R9 Fury 4GB Performance
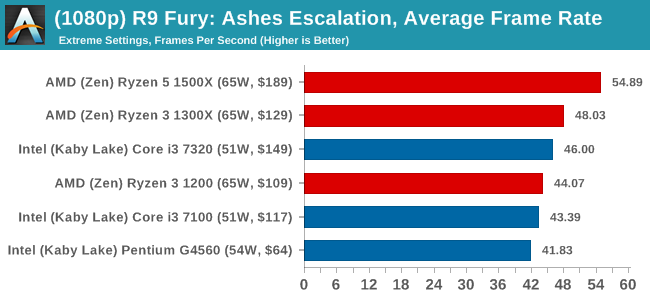
1080p
4K
Sapphire RX 480 8GB Performance
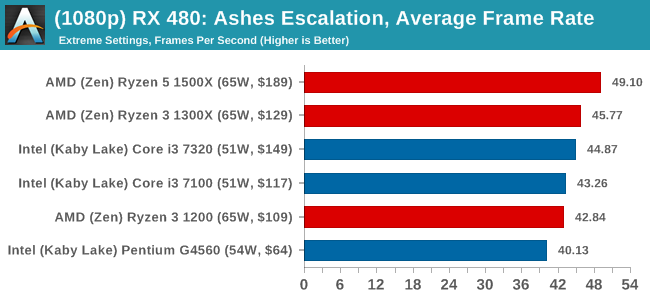
1080p
4K


140 Comments
View All Comments
Oxford Guy - Thursday, July 27, 2017 - link
"The Ryzen 3 1200 brings up the rear of the stack, being the lowest CPU in the stack, having the lowest frequency at 3.1G base, 3.4G turbo, 3.1G all-core turbo, no hyperthreading and the lowest amount of L3 cache."That bit about the L3 is incorrect unless the chart on page 1 is incorrect. It shows the same L3 size for 1400, 1300X, and 1200.
Oxford Guy - Thursday, July 27, 2017 - link
And this:"Number 3 leads to a lop-sided silicon die, and obviously wasn’t chosen."
Obviously?
Oxford Guy - Thursday, July 27, 2017 - link
"DDR4-2400 C15"2400, really — even though it is, obviously, known that Zen needs faster RAM to perform efficiently?
Joel Hruska managed to test Ryzen with 3200 speed RAM on his day 1 review. I bought 16 GB of 3200 RAM from Microcenter last Christmastime for $80. Just because RAM prices are nuts right now doesn't mean we should gut Ryzen's performance by sticking it with low-speed RAM.
Oxford Guy - Thursday, July 27, 2017 - link
"This is also typically run at JEDEC subtimings where possible. It is noted that some users are not keen on this policy"Maybe you guys should rethink your logic.
1) You have claimed, when overclocking, that it's not necessary to do full stability testing, like with Prime. Just passing some lower-grade stress testing is enough to make an overclock "stable enough".
2) Your overclocking reviews have pushed unwise levels of voltage into CPUs to go along with this "stable enough" overclock.
So... you argue against proof of true stability, both in the final overclock settings being satisfactorily tested and in safe voltages being decided upon.
And — simultaneously — kneecap Zen processors by using silly JEDEC standards, trying to look conservative?
Please.
Everyone knows the JEDEC standard applies to enterprise. Patriot is just one manufacturer of RAM that tested and certified far better RAM performance on B350 and A320 Zen boards. You had that very article on your site just a short time ago.
Your logic doesn't add up. It is not a significant enough cost savings for system builders to go with slow RAM for Zen. The only argument you can use, at all, is that OEMs are likely to kneecap Zen with slow RAM. That is not a given, though. OEMs can use faster RAM, like, at least, 2666, if they choose to. If they're marketing toward gamers they likely will.
Oxford Guy - Thursday, July 27, 2017 - link
"Truth be told I never actually played the first version, but every edition from the second to the sixth, including the fifth as voiced by the late Leonard Nimoy"You mean Civ IV.
Oxford Guy - Thursday, July 27, 2017 - link
And, yeah, we can afford to test with an Nvidia 1080 but we can't afford to use decent speed RAM.Yeah... makes sense.
Hixbot - Thursday, July 27, 2017 - link
Are you having a conversation with yourself? Try to condense your points into a single post.Oxford Guy - Friday, July 28, 2017 - link
I don't live in a static universe where all of the things I'm capable of thinking of are immediately apparent, but thanks for the whine.Manch - Friday, July 28, 2017 - link
Really snowflake? You're saying he is whining? How many rants have you posted? LOL The difference between 2400 and 3200 shows up more on the higher end processors bc bigger L3 & HT err SMT. The diff in CPU bound gaming is 5-10% at most with the Ryzen 7's. Smaller with the 5's. Even more so with the 3's. Small enough to the point that it would not change the outlook on the CPU's. Also consider that if Ian change the parameters of his test constantly it would also skew numbers more so and render bench unreliable. Test the Ryzen 7's with 2133 then the 5's with 2400 then the 3's with 3200? Obviously anandtechs test are not the definitive performance bench mark for the world. What it is, is a reliably consistent benchmark allowing you to compare diff cpus with as little changed as possible as too not skew performance. Think EPA gas mileage stickers on cars. Will you get that rating? maybe. What it does is it gives you comparative results. From there its fairly easy to extrapolate the difference. Now I'm sure they will as they have in the past update there baseline specs for testing. You're running off the rails about how much the memory effects are. Look at all the youtube vids and other reviews out there. Difference yes. A lot? meh I also believe anandtech has mentioned doing a write up on the latest agesa update since its had a significant impact(including memory) on the series.Oxford Guy - Friday, July 28, 2017 - link
"You're saying he is whining? How many rants have you posted?"Pot kettle fallacy.