The AMD Ryzen 3 1300X and Ryzen 3 1200 CPU Review: Zen on a Budget
by Ian Cutress on July 27, 2017 9:30 AM EST- Posted in
- CPUs
- AMD
- Zen
- Ryzen
- Ryzen 3
- Ryzen 3 1300X
- Ryzen 3 1200
Civilization 6
First up in our CPU gaming tests is Civilization 6. Originally penned by Sid Meier and his team, the Civ series of turn-based strategy games are a cult classic, and many an excuse for an all-nighter trying to get Gandhi to declare war on you due to an integer overflow. Truth be told I never actually played the first version, but every edition from the second to the sixth, including the fourth as voiced by the late Leonard Nimoy, it a game that is easy to pick up, but hard to master.

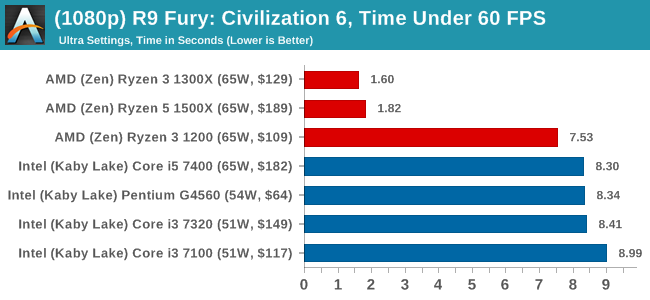
Benchmarking Civilization has always been somewhat of an oxymoron – for a turn based strategy game, the frame rate is not necessarily the important thing here and even in the right mood, something as low as 5 frames per second can be enough. With Civilization 6 however, Firaxis went hardcore on visual fidelity, trying to pull you into the game. As a result, Civilization can taxing on graphics and CPUs as we crank up the details, especially in DirectX 12.
Perhaps a more poignant benchmark would be during the late game, when in the older versions of Civilization it could take 20 minutes to cycle around the AI players before the human regained control. The new version of Civilization has an integrated ‘AI Benchmark’, although it is not currently part of our benchmark portfolio yet, due to technical reasons which we are trying to solve. Instead, we run the graphics test, which provides an example of a mid-game setup at our settings.
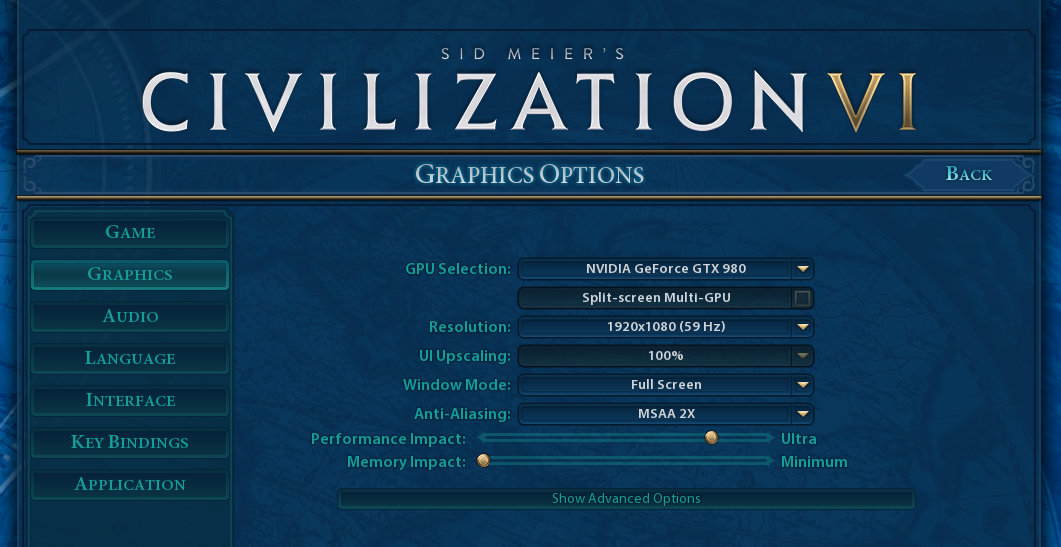
At both 1920x1080 and 4K resolutions, we run the same settings. Civilization 6 has sliders for MSAA, Performance Impact and Memory Impact. The latter two refer to detail and texture size respectively, and are rated between 0 (lowest) to 5 (extreme). We run our Civ6 benchmark in position four for performance (ultra) and 0 on memory, with MSAA set to 2x.
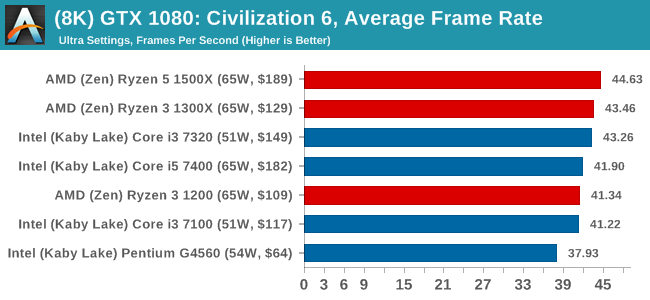
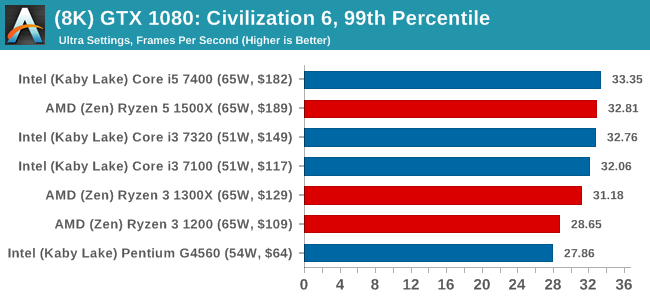
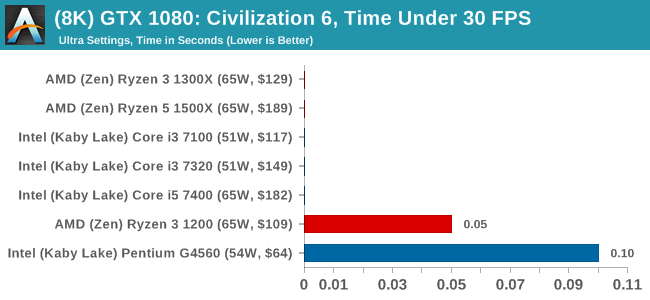
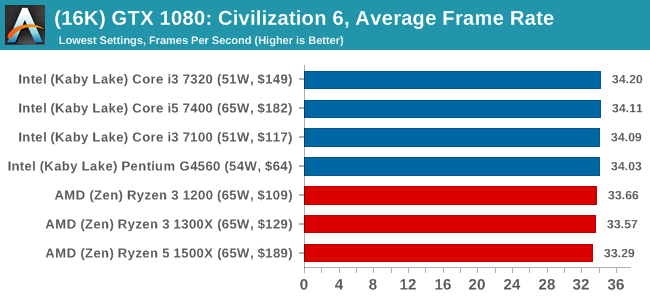
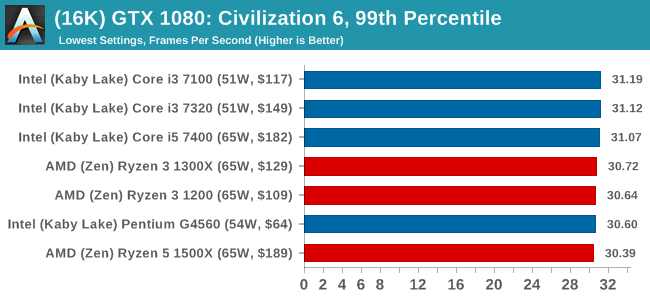
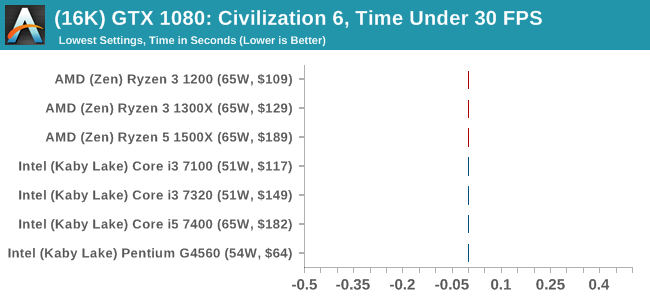
For reviews where we include 8K and 16K benchmarks (Civ6 allows us to benchmark extreme resolutions on any monitor) on our GTX 1080, we run the 8K tests similar to the 4K tests, but the 16K tests are set to the lowest option for Performance.
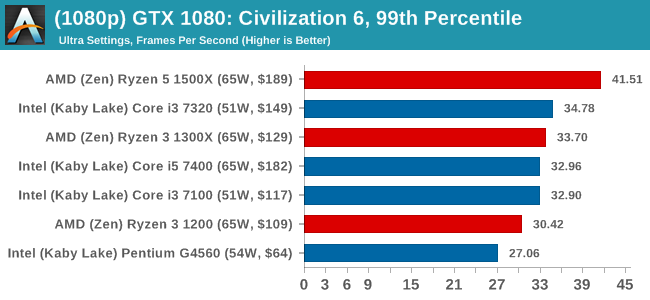
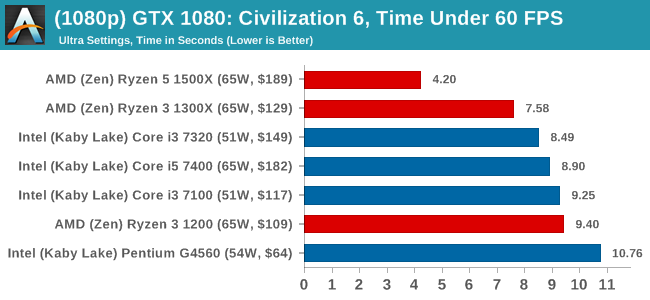
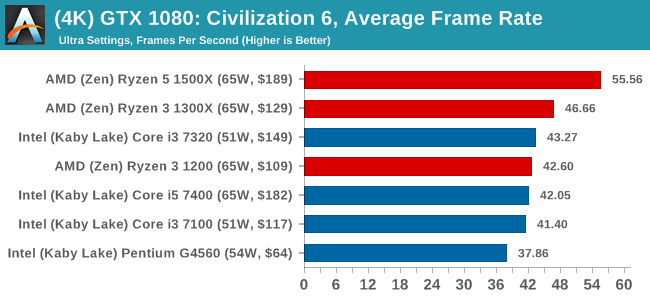
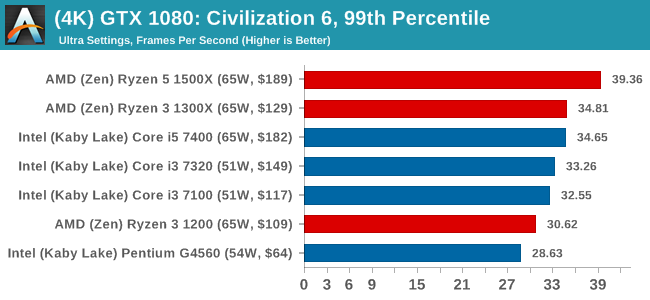
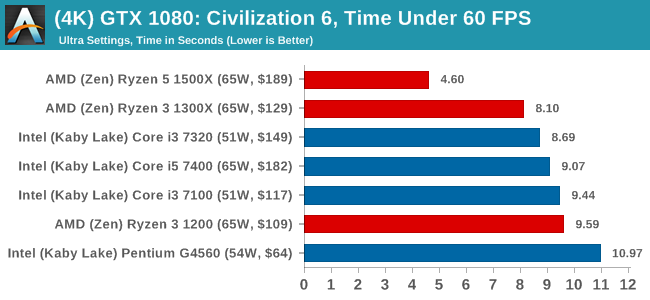
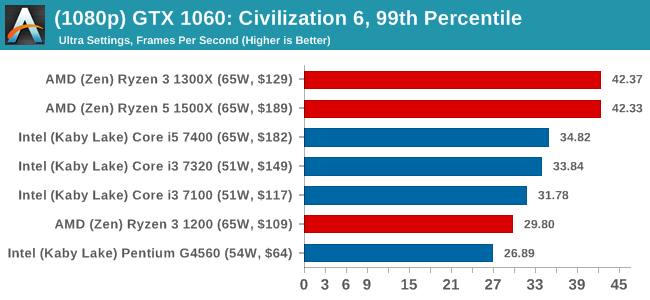
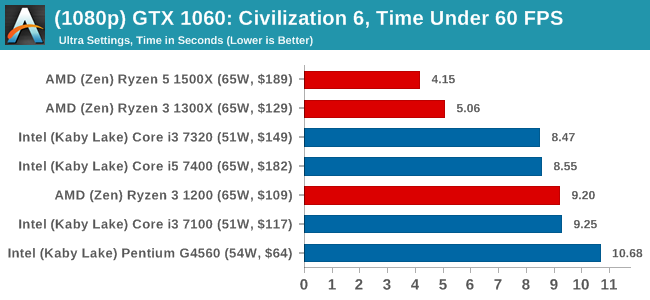
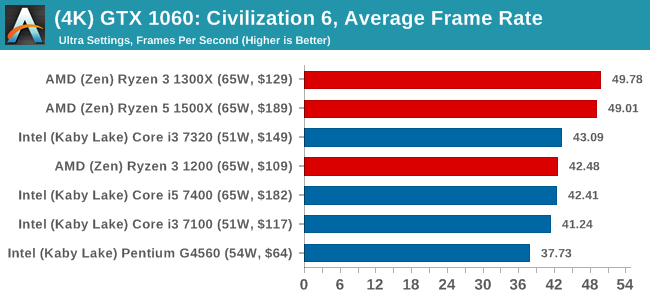
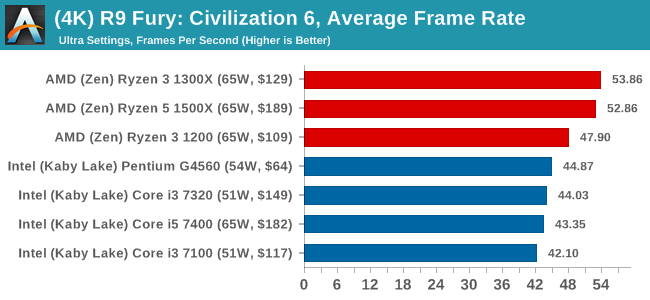
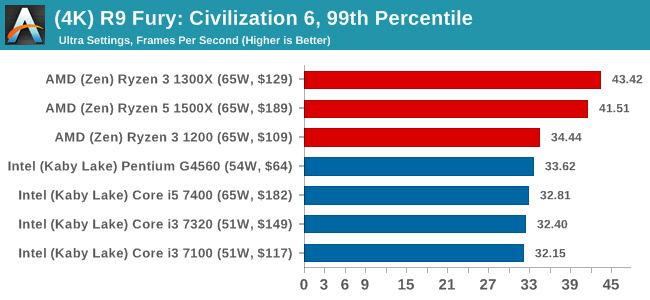
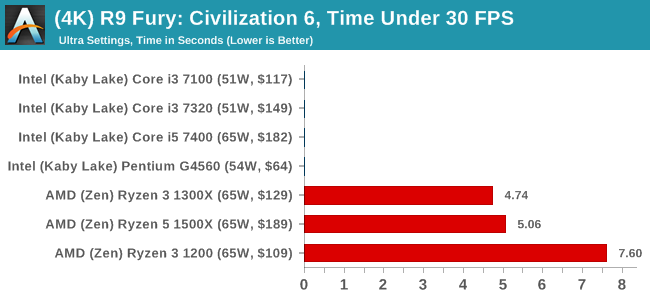
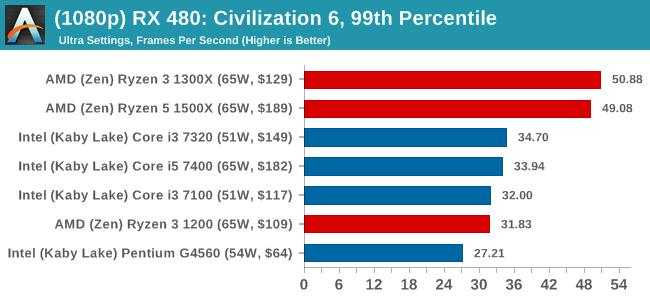
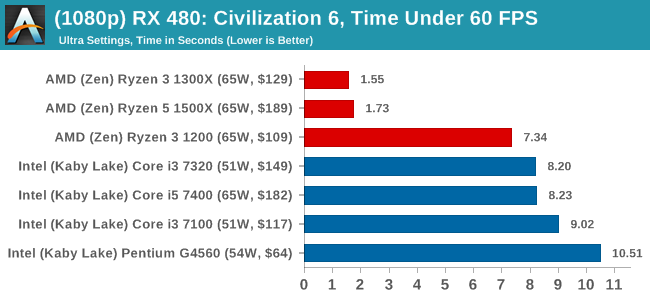
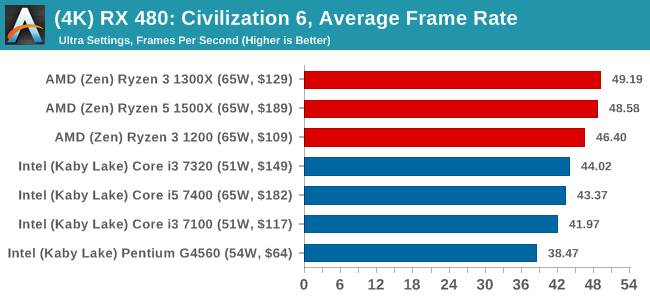
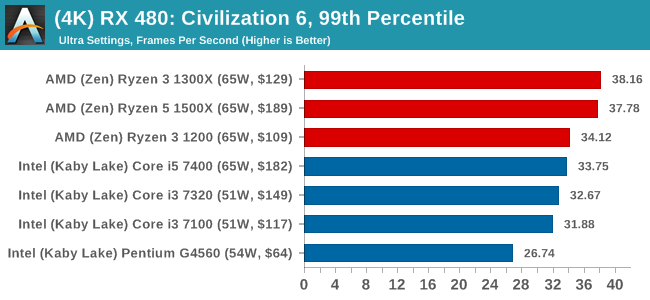
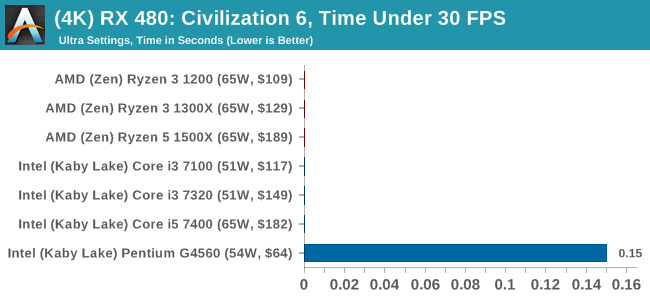
For all our results, we show the average frame rate at 1080p first. Mouse over the other graphs underneath to see 99th percentile frame rates and 'Time Under' graphs, as well as results for other resolutions. All of our benchmark results can also be found in our benchmark engine, Bench.
MSI GTX 1080 Gaming 8G Performance

1080p
4K
8K
16K
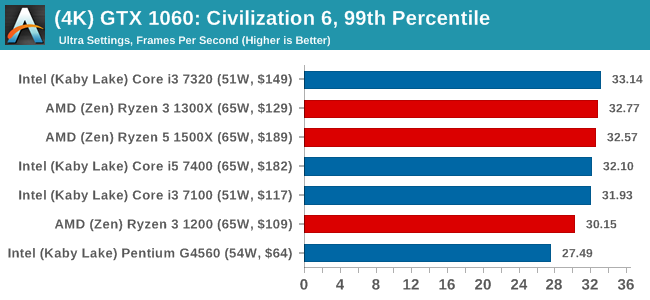
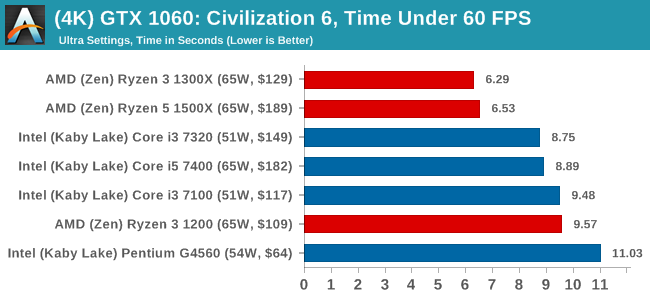
ASUS GTX 1060 Strix 6GB Performance
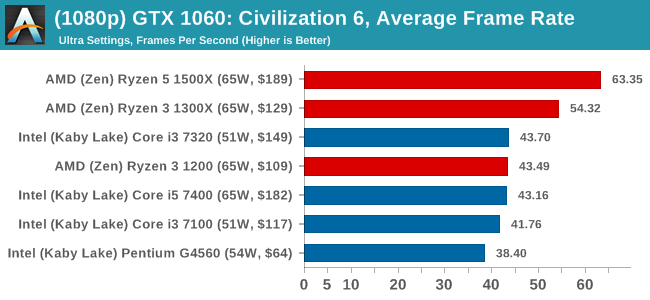
1080p
4K
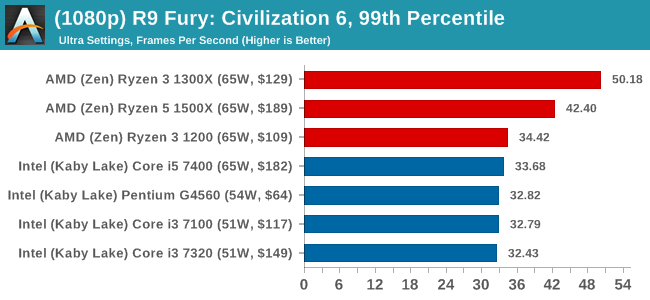
Sapphire R9 Fury 4GB Performance
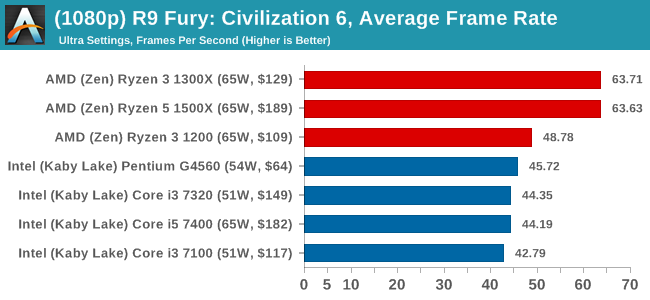
1080p
4K
Sapphire RX 480 8GB Performance
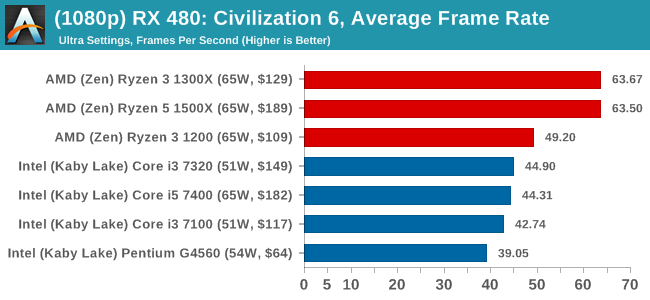
1080p
4K


140 Comments
View All Comments
HollyDOL - Thursday, July 27, 2017 - link
Ian hasn't failed us. Thorough review on day one. Now to read it whole :-)Ian Cutress - Thursday, July 27, 2017 - link
Results are still coming in for the 1300X, this will take another day or two and I'll add in the graphs but all the Ryzen 3 1200 data is in Bench.Each of the 3 GPUs still to go is about 5 hrs each to test, Chrome Compile and SYSMark is another 10 hr. I've still got results for the 7300 coming in as well on my second test-bed.
srkelley5 - Thursday, July 27, 2017 - link
Thank you! I know that it's more work, but is there any chance of getting charts that compare these results against Vishera cpu's?0ldman79 - Saturday, July 29, 2017 - link
Seconded.It is a shame that we still don't have a direct comparison between AMD's big CPU from last gen vs the current generation.
StevoLincolnite - Saturday, July 29, 2017 - link
Can't compare my Sandy-Bridge-E 3930K either.Or the Phenom 2 x6...
0ldman79 - Wednesday, August 2, 2017 - link
It looks like a lot of the information is already on the bench, just formatted differently.Shame.
Ian Cutress - Sunday, July 30, 2017 - link
I've got a regression testing project ongoing which is taking most of my regular time to get sorted. More details soon.AndrewJacksonZA - Thursday, July 27, 2017 - link
Thanks for your hard work, Ian (and team?) We appreciate it. I must say, I'm impressed with what this 1300X can do - and for only $130 too!Correction on the last graph: the X-axis title says, well, "Title." :-)
ddriver - Thursday, July 27, 2017 - link
You should do relative x scale for the price/performance charts. It will be more informative than absolute scale, besides, how many CPUs under 50$ are there, and how many go as low as 0$?coolhardware - Thursday, July 27, 2017 - link
Agreed, thank you for the review Ian! I've been waiting for a nice Ryzen close to the $100 price point, the 1300X is close enough in price for me and I like what I read in the review.Especially interested to see how performance in my daily work compares to my trusty 2500K and some more modern i7 mobile CPUs.
Excited to pick one of these up! :-)
NewEgg shows 7/31 release:
https://www.newegg.com/Product/Product.aspx?Item=N...
Amazon usually ships faster for me so I plan on ordering from them:
http://amzn.to/2v1fJqh (url shortened)
PS Does MicroCenter usually have CPUs in store on launch day?