Why an Overclockable Core i3 Might Not Exist: The Supermicro C7H170-M and Intel Core i3-6100TE Review
by Ian Cutress on March 17, 2016 10:30 AM EST- Posted in
- CPUs
- Intel
- Motherboards
- Core i3
- Supermicro
- Overclocking
System Performance
Not all motherboards are created equal. On the face of it, they should all perform the same and differ only in the functionality they provide - however this is not the case. The obvious pointers are power consumption, but also the ability for the manufacturer to optimize USB speed, audio quality (based on audio codec), POST time and latency. This can come down to manufacturing process and prowess, so these are tested.
Power Consumption
Power consumption was tested on the system while in a single MSI GTX 770 Lightning GPU configuration with a wall meter connected to the OCZ 1250W power supply. This power supply is Gold rated, and as I am in the UK on a 230-240 V supply, leads to ~75% efficiency > 50W, and 90%+ efficiency at 250W, suitable for both idle and multi-GPU loading. This method of power reading allows us to compare the power management of the UEFI and the board to supply components with power under load, and includes typical PSU losses due to efficiency. These are the real world values that consumers may expect from a typical system (minus the monitor) using this motherboard.
While this method for power measurement may not be ideal, and you feel these numbers are not representative due to the high wattage power supply being used (we use the same PSU to remain consistent over a series of reviews, and the fact that some boards on our test bed get tested with three or four high powered GPUs), the important point to take away is the relationship between the numbers. These boards are all under the same conditions, and thus the differences between them should be easy to spot.
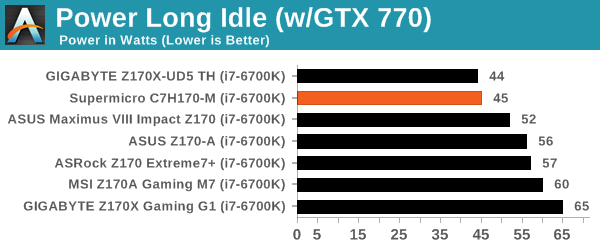
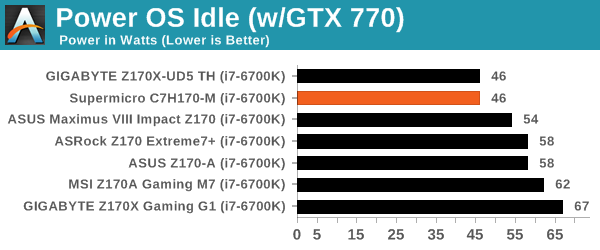
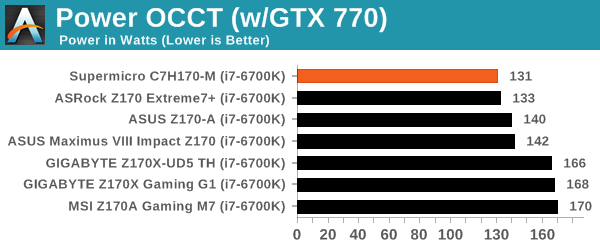
The C7H170-M pulled in some good low numbers for idling and load, which should be expected for a smaller motherboard without too many controllers. The power delta from long idle to load was 86W, which is one of the best of all the 100-series systems we’ve tested.
Non UEFI POST Time
Different motherboards have different POST sequences before an operating system is initialized. A lot of this is dependent on the board itself, and POST boot time is determined by the controllers on board (and the sequence of how those extras are organized). As part of our testing, we look at the POST Boot Time using a stopwatch. This is the time from pressing the ON button on the computer to when Windows 7 starts loading. (We discount Windows loading as it is highly variable given Windows specific features.)
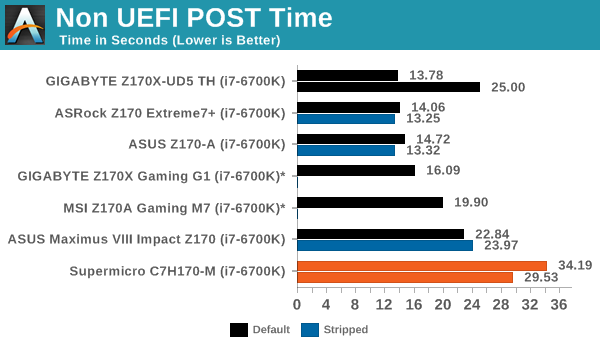
One drawback of systems outside of the normal big four vendors has historically been POST times, and the C7H170-M continues this trend, being over 30 seconds from power on to seeing Windows 7 being loaded. Cutting out the audio and network controllers for a stripped POST time reduced it to just under 30 seconds, but that is still twice as long as the best 100-series motherboards.
Rightmark Audio Analyzer 6.2.5
Rightmark:AA indicates how well the sound system is built and isolated from electrical interference (either internally or externally). For this test we connect the Line Out to the Line In using a short six inch 3.5mm to 3.5mm high-quality jack, turn the OS speaker volume to 100%, and run the Rightmark default test suite at 192 kHz, 24-bit. The OS is tuned to 192 kHz/24-bit input and output, and the Line-In volume is adjusted until we have the best RMAA value in the mini-pretest. We look specifically at the Dynamic Range of the audio codec used on board, as well as the Total Harmonic Distortion + Noise.
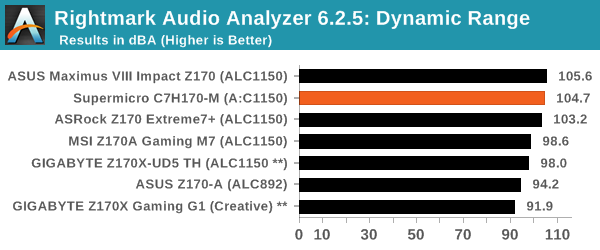
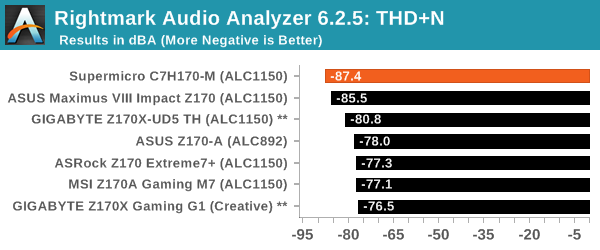
Using the ALC1150 codec means that the C7H170-M should have some potential, although the board comes without most of the enhancements we typically see with souped up versions of the codec. Perhaps surprisingly we get the best THD+N result out of any codec we’ve ever tested on 100-series motherboards.
USB Backup
For this benchmark, we transfer a set size of files from the SSD to the USB drive using DiskBench, which monitors the time taken to transfer. The files transferred are a 1.52 GB set of 2867 files across 320 folders – 95% of these files are small typical website files, and the rest (90% of the size) are small 30 second HD videos. In an update to pre-Z87 testing, we also run MaxCPU to load up one of the threads during the test which improves general performance up to 15% by causing all the internal pathways to run at full speed.
Due to the introduction of USB 3.1, as of June 2015 we are adjusting our test to use a dual mSATA USB 3.1 Type-C device which should be capable of saturating both USB 3.0 and USB 3.1 connections. We still use the same data set as before, but now use the new device. Results are shown as seconds taken to complete the data transfer.
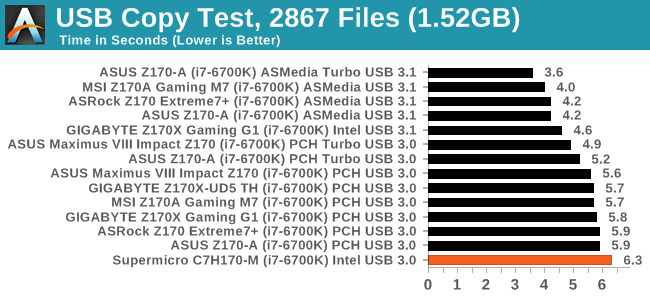
Using the default Intel drivers, the USB 3.0 ports for the C7H170-M gave our worst result so far. This may be down to some BIOS tuning which the other motherboard manufacturers have been doing for many years.
DPC Latency
Deferred Procedure Call latency is a way in which Windows handles interrupt servicing. In order to wait for a processor to acknowledge the request, the system will queue all interrupt requests by priority. Critical interrupts will be handled as soon as possible, whereas lesser priority requests such as audio will be further down the line. If the audio device requires data, it will have to wait until the request is processed before the buffer is filled.
If the device drivers of higher priority components in a system are poorly implemented, this can cause delays in request scheduling and process time. This can lead to an empty audio buffer and characteristic audible pauses, pops and clicks. The DPC latency checker measures how much time is taken processing DPCs from driver invocation. The lower the value will result in better audio transfer at smaller buffer sizes. Results are measured in microseconds.
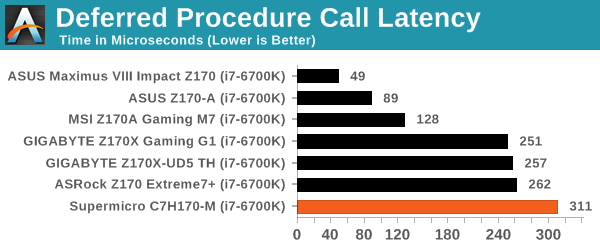
DPC Latency is still an odd discussion point on 100-series. We’ve seen ASUS get it right, MSI not too far behind but the others are playing catchup.


62 Comments
View All Comments
Y23KC - Tuesday, March 29, 2016 - link
Ah, the fun of overclocking. I used to overclock starting with an AMD Duron 800mhz to 1ghz. Stayed with multiple AMD processors (Thunderbird 1ghz to 1.4ghz, TBird 1.4 to 1.8, 1900+ XP to a real 1.9, etc.) Tried a few coppermine pentiums, but was disappointed. Then I went to the P4 Northwood processors. Favorite of those was a 2.53ghz to 3.06ghz overclock. Also had the 2ghz Celron that was a great overclocker to encode videos. Didn't move past them for a while since AGP switched to PCIE graphics card and ddr2 ram with the Core2Duo. Finally moved to Core2Quad 9400 and it was a dud overclocker. Got rid of it and moved to Mac computers. Kept a few Windows laptops and a HTPC but just recently went back to overclocking with a 4770k. It was also a dud overclocker. Recently I got a 5820k and overclocked to 4.5ghz. Been enjoying the tinkering but honestly beyond benchmarks and video encoding, I can't tell the difference between it and an i3-6100 that I currently use in my HTPC. I also like to tinker with the Hackintosh stuff these days, but Apple keeps screwing around with the imessage protocol that doesn't make it as fun anymore to meBulat Ziganshin - Saturday, May 7, 2016 - link
i wonder who can buy your argument about "half-way to i5". 65W parts like the http://ark.intel.com/products/90731/Intel-Core-i3-... has the same perfromance level out of box