The Battle of Bay Trail-D: GIGABYTE J1900N-D3V and ASUS J1900I-C Reviewed
by Ian Cutress on October 17, 2014 10:00 AM ESTSystem Benchmarks
Windows 7 POST Time
Different motherboards have different POST sequences before an operating system is initialized. A lot of this is dependent on the board itself, and POST boot time is determined by the controllers on board (and the sequence of how those extras are organized). As part of our testing, we look at the POST Boot Time using a stopwatch. This is the time from pressing the ON button on the computer to when Windows 7 starts loading. (We discount Windows loading as it is highly variable given Windows specific features.)
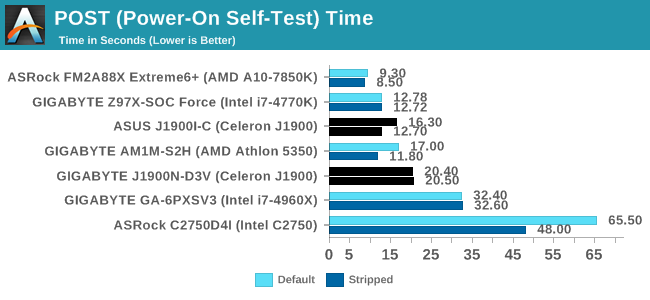
The ASUS gets the jump on POST time, even shaving almost 4 seconds off from disabling controllers. The GIGABYTE result stands around 20 seconds by comparison.
Rightmark Audio Analyzer 6.2.5
Rightmark:AA indicates how well the sound system is built and isolated from electrical interference (either internally or externally). For this test we connect the Line Out to the Line In using a short six inch 3.5mm to 3.5mm high-quality jack, turn the OS speaker volume to 100%, and run the Rightmark default test suite at 192 kHz, 24-bit. The OS is tuned to 192 kHz/24-bit input and output, and the Line-In volume is adjusted until we have the best RMAA value in the mini-pretest. We look specifically at the Dynamic Range of the audio codec used on board, as well as the Total Harmonic Distortion + Noise.
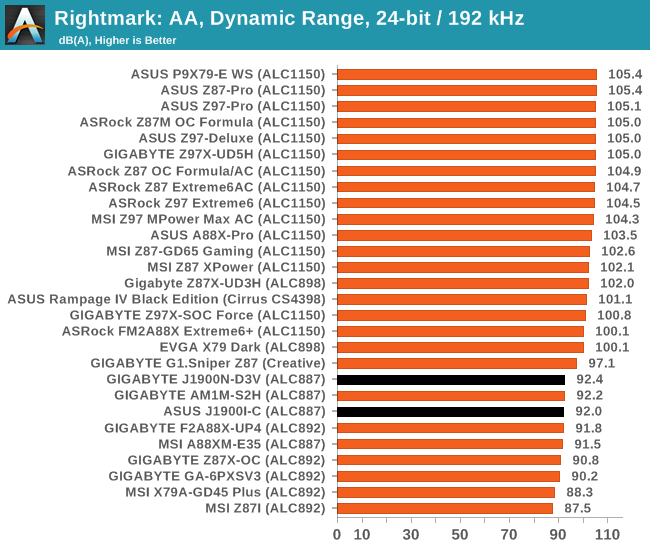
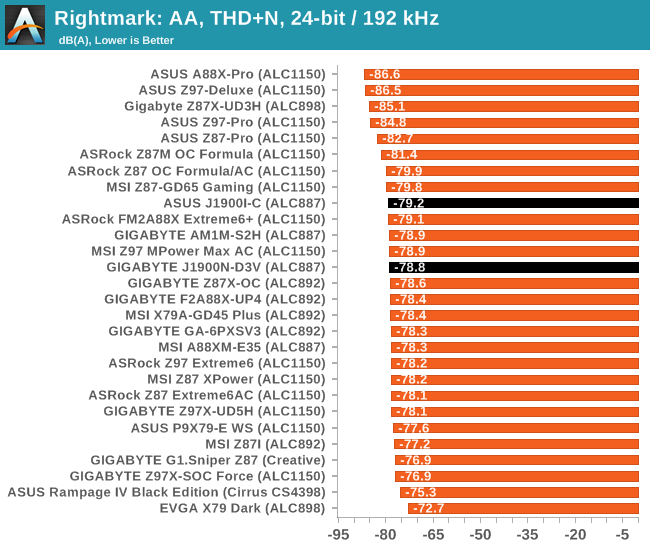
ALC887 is one of the top end 2.1 codec solutions, although here we balance SNR against cost compared to something like the ALC898.
USB Backup
For this benchmark, we transfer a set size of files from the SSD to the USB drive using DiskBench, which monitors the time taken to transfer. The files transferred are a 1.52 GB set of 2867 files across 320 folders – 95% of these files are small typical website files, and the rest (90% of the size) are small 30 second HD videos. In an update to pre-Z87 testing, we also run MaxCPU to load up one of the threads during the test which improves general performance up to 15% by causing all the internal pathways to run at full speed.
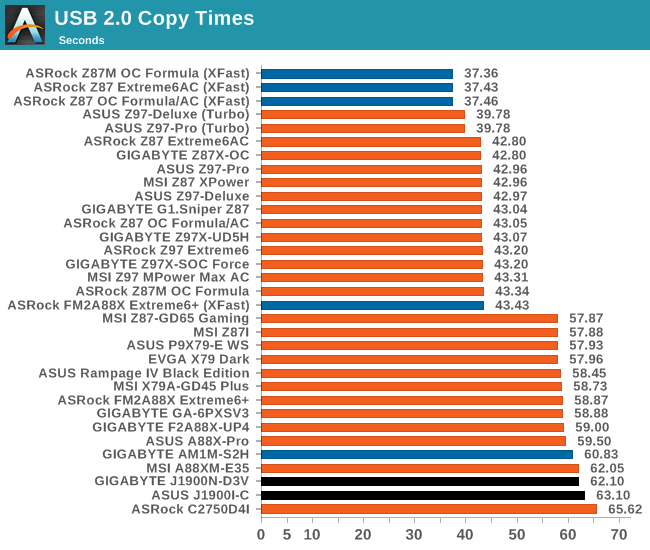
We actually had an odd issue with both of our motherboards in this review. Neither of them wanted to play ball properly with the USB 3.0 mode, which we think comes down to drivers. The latest drivers will need to be downloaded and installed for anyone purchasing these motherboards.
DPC Latency
Deferred Procedure Call latency is a way in which Windows handles interrupt servicing. In order to wait for a processor to acknowledge the request, the system will queue all interrupt requests by priority. Critical interrupts will be handled as soon as possible, whereas lesser priority requests such as audio will be further down the line. If the audio device requires data, it will have to wait until the request is processed before the buffer is filled.
If the device drivers of higher priority components in a system are poorly implemented, this can cause delays in request scheduling and process time. This can lead to an empty audio buffer and characteristic audible pauses, pops and clicks. The DPC latency checker measures how much time is taken processing DPCs from driver invocation. The lower the value will result in better audio transfer at smaller buffer sizes. Results are measured in microseconds.
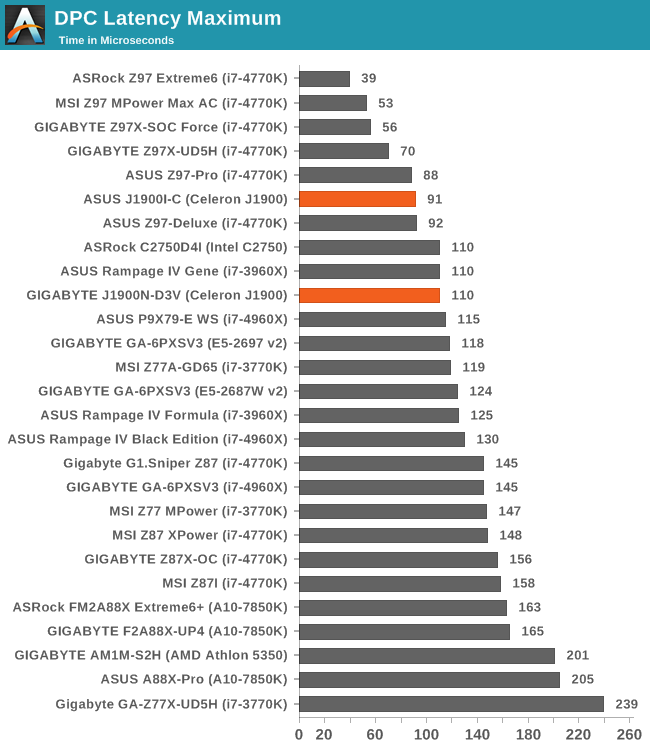
I was actually rather impressed with DPC Latency, with both motherboards hovering around the 100 microsecond mark. In the past, slower systems often tend to spike outside of the normal range, but both of these do rather well.
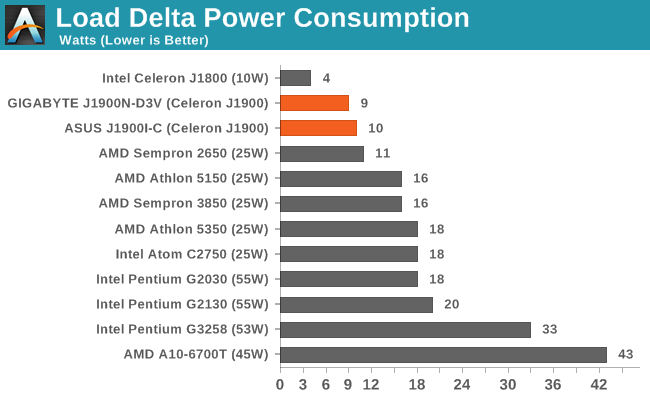
Load Delta Power Consumption


60 Comments
View All Comments
HiTechObsessed - Friday, October 17, 2014 - link
Should be a big hit with console users. That lower frame-rate for gaming should be super-cinematic then!XZerg - Friday, October 17, 2014 - link
The power consumption delta is something I do not like. I rather see the idle and load instead. The idle tells me how much my "nas/htpc" system will consume while doing nothing. the load tells me what is the absolute worse it will consume. this allows me to weigh the options better on power consumption basis, not the delta as that's not what is going to matter when the system is going to be idling for prolonged periods.looncraz - Friday, October 17, 2014 - link
+1In this light, one extra watt for the faster performing (barely, but true, and much more so in gaming) 25W AMD option looks to be the real winner. Cheaper, only an extra watt of power used (in the delta measure anyway), etc... But, in the real world, the AMD may idle at 16W and the intel will idle at 8W... which may matter if planning on running multiple systems and using UPS protection such as in an office/school/government environment.
jospoortvliet - Friday, October 17, 2014 - link
Good news is that most reviews I've seen put the AMD at a lower idle power than the Intel. The total load is closer than the difference graph makes it look, no idea why those are used...maco - Friday, October 17, 2014 - link
Agreed, I'd like to see idle and load graphs too. I tend to leave a computer on doing light server tasks, so idle power is an important metric for me.danzig - Saturday, October 18, 2014 - link
Same here concerning the power graphs. If there is a revision or edit of the page, could you please put more power consumption info up, if you have the data?KWIE - Monday, October 20, 2014 - link
I use mine as a NAS also, with FreeNAS/Plex. I haven't clocked it yet higher than 19W.Guspaz - Monday, October 20, 2014 - link
Agreed the delta numbers are useless. A system with an idle/load power consumption of 10W/20W would show up the same in the chart as a system with an idle/load power consumption of 500/510W, as admittedly contrived as that scenario is. But something like 10/20 versus 20/30 isn't so crazy.Guspaz - Monday, October 20, 2014 - link
Also, the graph says "lower is better", but that's not true at all. Given two processors with equal load power draw, the processor with the lower idle power draw "wins" that benchmark, but that means you want the processor with the *BIGGER* delta, not the smaller delta!AJSB - Friday, October 17, 2014 - link
AMD AM1 APUs based on Kabini simply CRUSH these abortions as for light gaming goes (and BTW, 1280x1024 is near 30% more pixels than of a 1366x768 monitor)....wait for AMD Beema AM1 ;)