Samsung SSD 845DC EVO/PRO Performance Preview & Exploring IOPS Consistency
by Kristian Vättö on September 3, 2014 8:00 AM ESTPerformance Consistency - Worst-Case IOPS
In the past we have only reported average IOPS in one second intervals, which gives us a good picture of overall performance. With modern SSDs, however, there are tens of thousands of IOs happening every second and the fundamental problem with averages is that they do not show how the performance varies and what the worst-case performance is.
Especially in enterprise environments, the worst-case performance can be more salient because the drives operate in an array, which scales the overall performance but also makes worst-case performance drops more significant. For example, if you have a 12-drive array of SSDs that each provide 50K IOPS on average, the theoretical maximum speed of that array would be 600K IOPS. However, if the worst-case performance of each drive is 5K IOPS, the worst-case performance of the array can suddenly drop to 60K IOPS, which can be significant enough to have an impact on user experience.
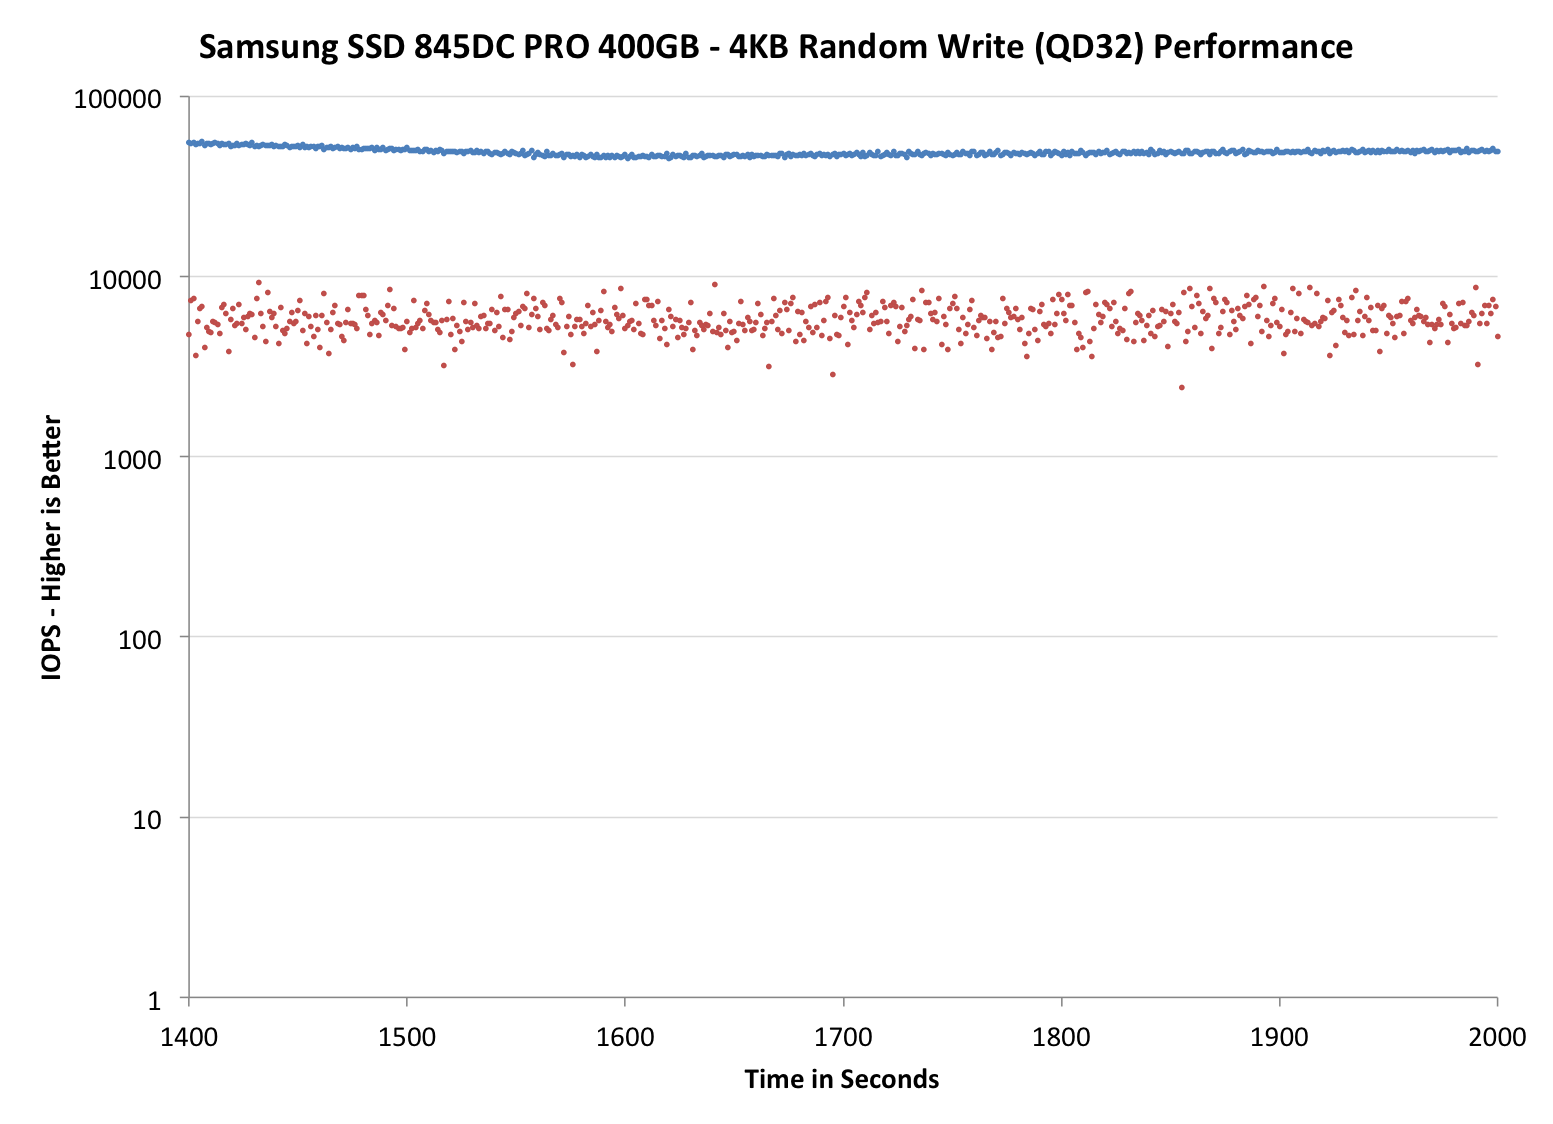
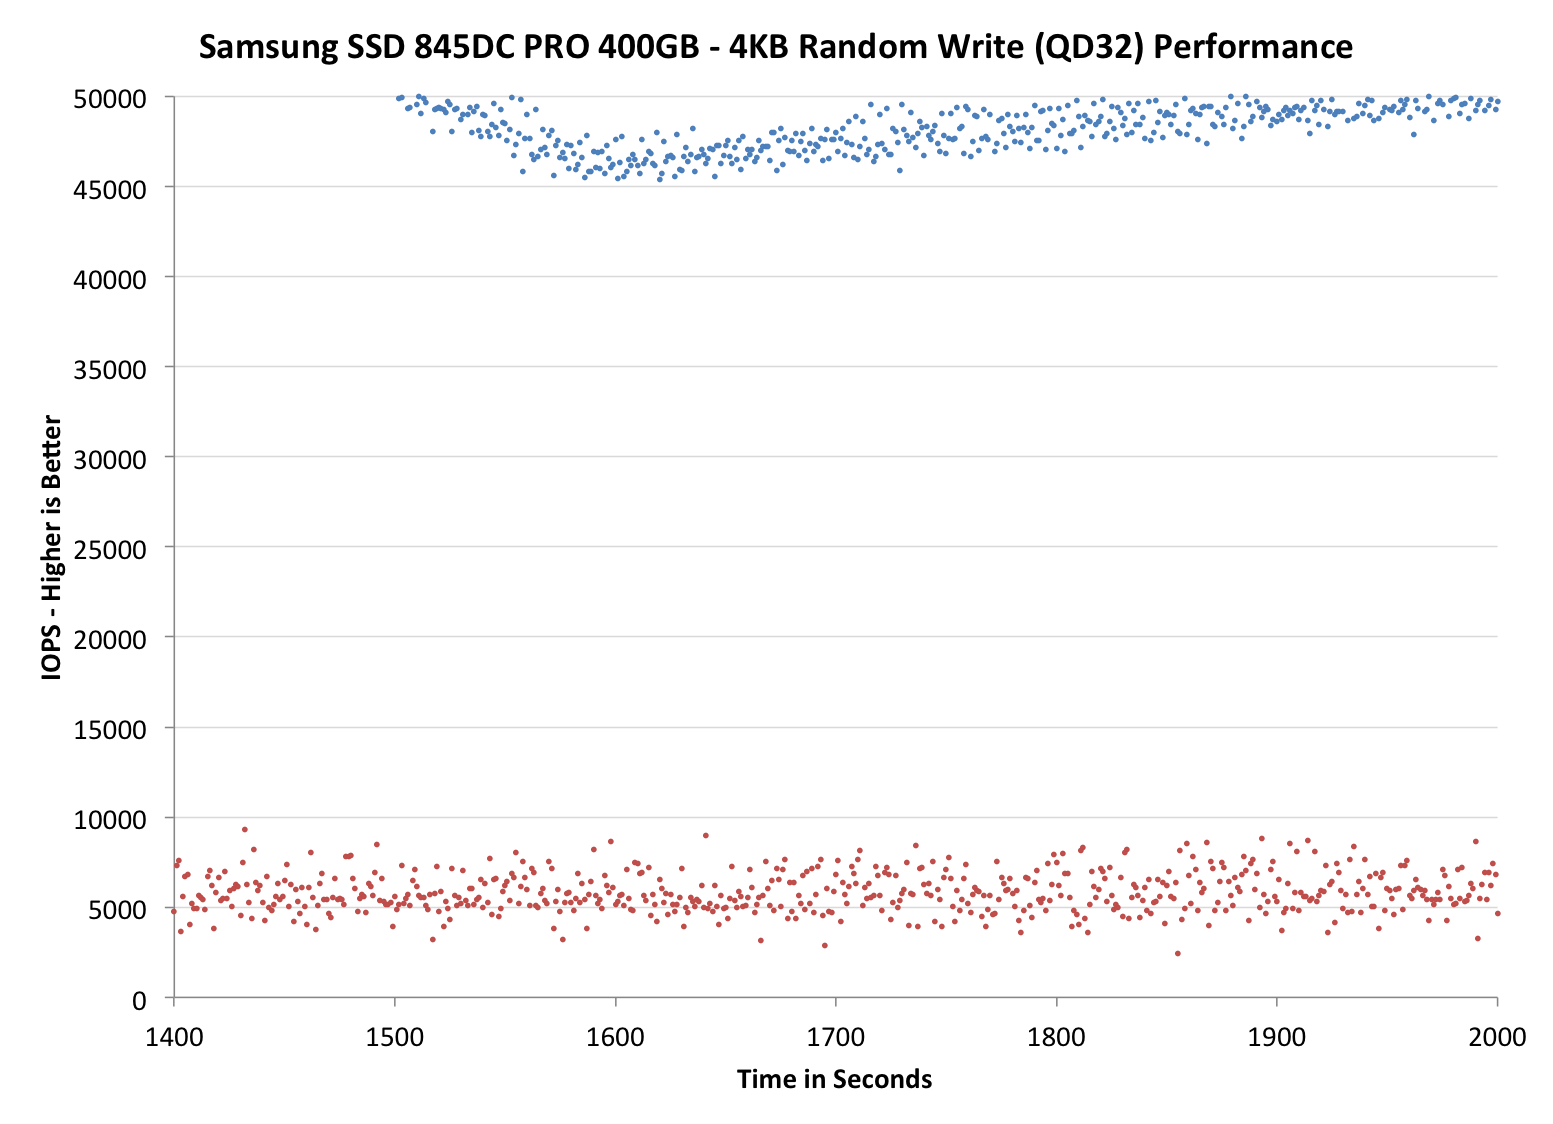
We are now reporting the worst-case IOPS in addition to the average IOPS. The blue dots in the graphs stand for average IOPS just like before, but the red dots show the worst-case IOPS for every second. Since worst-case IOPS is not reported by any benchmark by default, we had to derive it from maximum response time, which is reported by all the major storage benchmarks. Technically reporting the average and maximum latency would be more appropriate because IOPS cannot be calculated based on a single IO (and that is what the maximum latency is), but for the sake of consistency and compatibility with our old graphs we will be using IOPS for the time being. The end result is the same because IOPS is just queue depth over latency, so the graph itself would not be any different aside from the fact that with latency lower scores would be better.
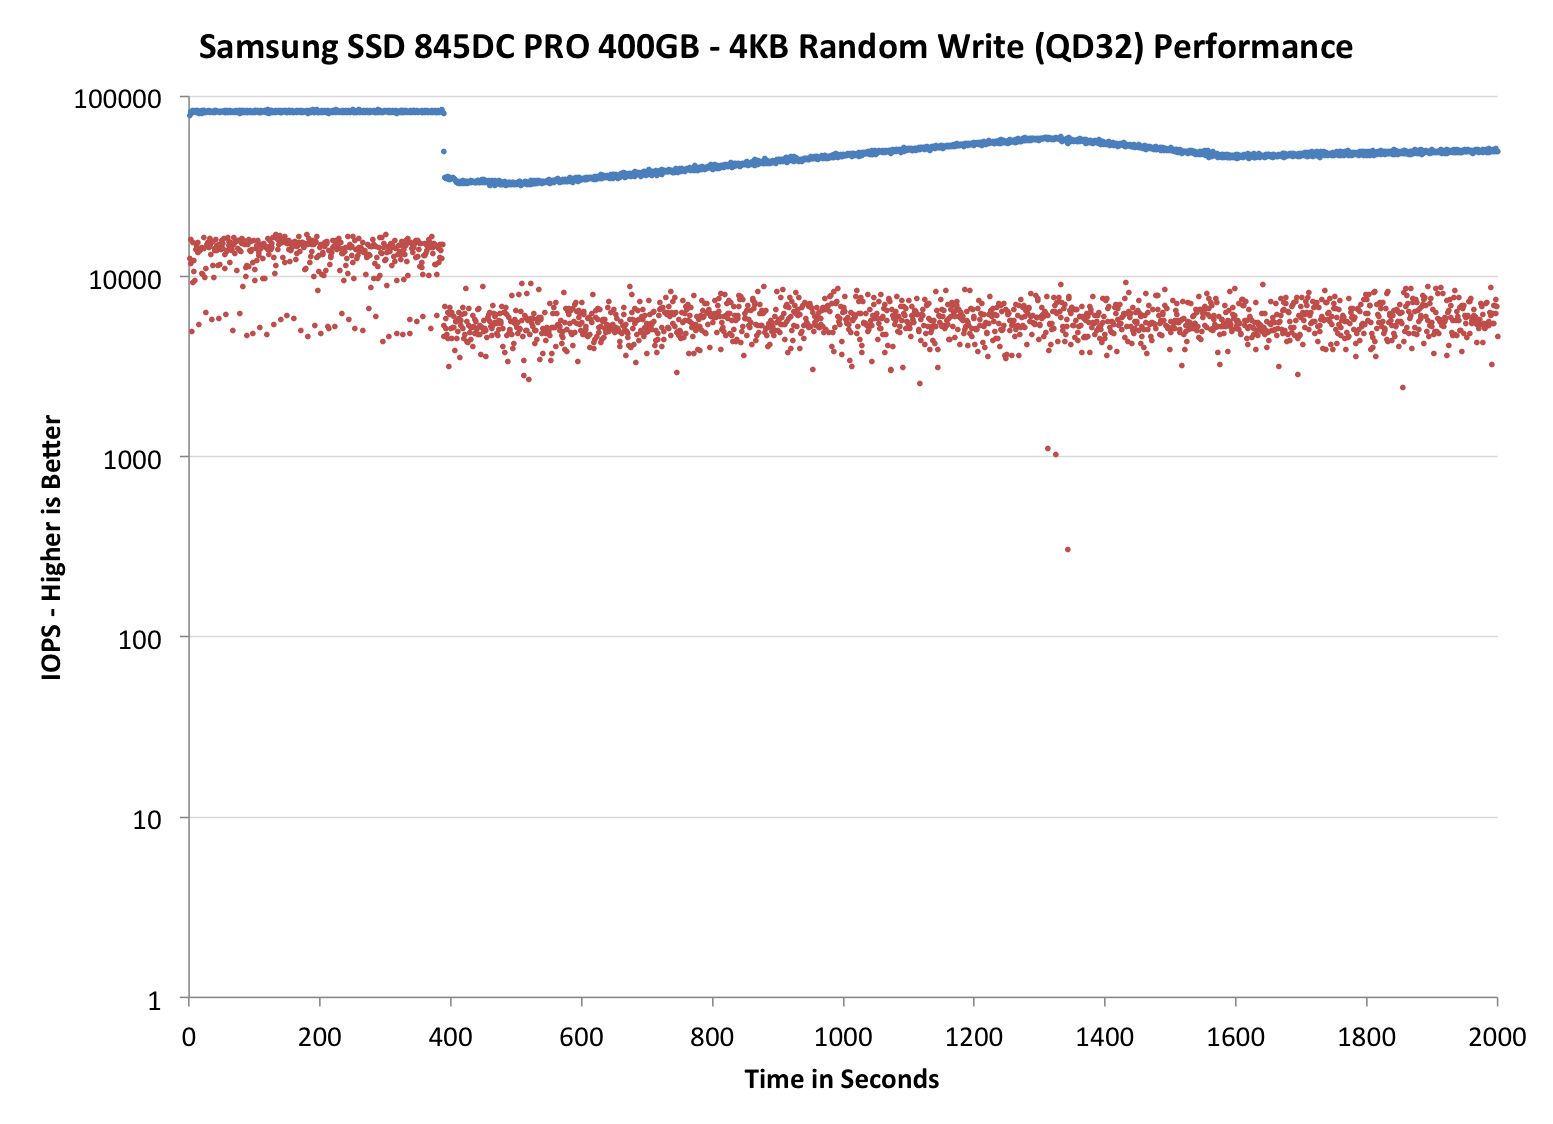
It appears that both the 845DC PRO and EVO have a worst-case IOPS of around 5K, which translates to latency of 6.4ms. Compared to other enterprise SSDs we have tested, that is excellent since for Intel's S3500/S3700, the worst-case IOPS varies between 3K and 5K, and for Micron's M500DC it is about 2K.


31 Comments
View All Comments
hojnikb - Wednesday, September 3, 2014 - link
Looks like, they ain't doing Turbowrite on TLC models :)Kristian Vättö - Wednesday, September 3, 2014 - link
TurboWrite wouldn't make any sense on an enterprise drive because all that matters is sustained performance. Client drives are a different case because IO activity tends to happen in bursts, so having a fast buffer is beneficial (and it makes the drive look better in benchmarks).hojnikb - Wednesday, September 3, 2014 - link
Yeah i figured as much. Aside from being more suited for short bursts (as you'd said) its really great for marketing department, since they can slap magical 500MB/s+ speeds, that every uninformed buyer is after. 500MB/s sure sells a lot better than 250MB/s (or even less, if we're dealing with lower capacities) :)Spirall - Wednesday, September 3, 2014 - link
Thanks for the article. Would suggest to make a $/manufacturer declared write endurance comparison (PB writen until manufacturer write warranty end). If there's a chance (due to the difficult on testing time) also make a $/tested write life (PB writen until tested dead).Kristian Vättö - Wednesday, September 3, 2014 - link
$/endurance is certainly something I will be looking at in the future. This was more of a preview than a full review and in the full review I will have more graphs and comparisons to support the conclusions :)As for actual endurance testing, that is something I will not do. It took me two weeks of continuos writing to get the rated endurance to drop by 1% in the 845DC PRO, so it would take way too long to wait for the drive to die.
hojnikb - Wednesday, September 3, 2014 - link
And there is a good chance, that thing would still go strong after rated endurance would drop to 0% (unless its hardcapped to die after that).Essence_of_War - Wednesday, September 3, 2014 - link
Another excellent article, Kristian.A question/comment, though, do you think it would make more sense to report the stdev measurements as an "error bar" attached to each data point rather than an additional graph with a 2nd y-axis? I think that might be more compact without having to worry about having multiple y-scales to read. Then it might even be possible to plot an average + error bars data set for multiple different SSDs on the same axis w/o having to worry about which curve is the avg, which curve is the stdev, etc.
hulu - Wednesday, September 3, 2014 - link
Another way to present the standard deviation data would be to draw it in two average +/- stdev graphs above and below the average graph. This would better allow visualizing the actual values the average minus stdev has.Kristian Vättö - Thursday, September 4, 2014 - link
Thanks for the suggestion. I will certainly look into alternative ways to present the standard deviation. I need to redo the graphs anyway for our new suite, so while I'm at it I can see if there is a better way to present the data.Essence_of_War - Thursday, September 4, 2014 - link
Best luck then, I'm sure you'll figure out a good way to do it.