Plextor Updates The Firmware on M5 Pro: Promises Increased Performance, We Test It
by Kristian Vättö on December 10, 2012 2:30 PM ESTPerformance Consistency
In our Intel SSD DC S3700 review we introduced a new method of characterizing performance: looking at the latency of individual operations over time. The S3700 promised a level of performance consistency that was unmatched in the industry, and as a result needed some additional testing to show that. The reason we don't have consistent IO latency with SSDs is because inevitably all controllers have to do some amount of defragmentation or garbage collection in order to continue operating at high speeds. When and how an SSD decides to run its defrag and cleanup routines directly impacts the user experience. Frequent (borderline aggressive) cleanup generally results in more stable performance, while delaying that can result in higher peak performance at the expense of much lower worst case performance. The graphs below tell us a lot about the architecture of these SSDs and how they handle internal defragmentation.
To generate the data below I took a freshly secure erased SSD and filled it with sequential data. This ensures that all user accessible LBAs have data associated with them. Next I kicked off a 4KB random write workload at a queue depth of 32 using incompressible data. I ran the test for just over half an hour, no where near what we run our steady state tests for but enough to give me a good look at drive behavior once all spare area filled up.
I recorded instantaneous IOPS every second for the duration of the test. I then plotted IOPS vs. time and generated the scatter plots below. Each set of graphs features the same scale. The first two sets use a log scale for easy comparison, while the last set of graphs uses a linear scale that tops out at 40K IOPS for better visualization of differences between drives.
The first set of graphs shows the performance data over the entire 2000 second test period. In these charts you'll notice an early period of very high performance followed by a sharp dropoff. What you're seeing in that case is the drive allocating new blocks from its spare area, then eventually using up all free blocks and having to perform a read-modify-write for all subsequent writes (write amplification goes up, performance goes down).
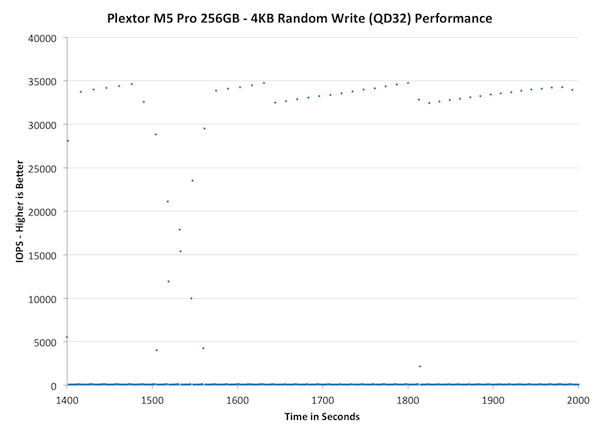
The second set of graphs zooms in to the beginning of steady state operation for the drive (t=1400s). The third set also looks at the beginning of steady state operation but on a linear performance scale. Click the buttons below each graph to switch source data.
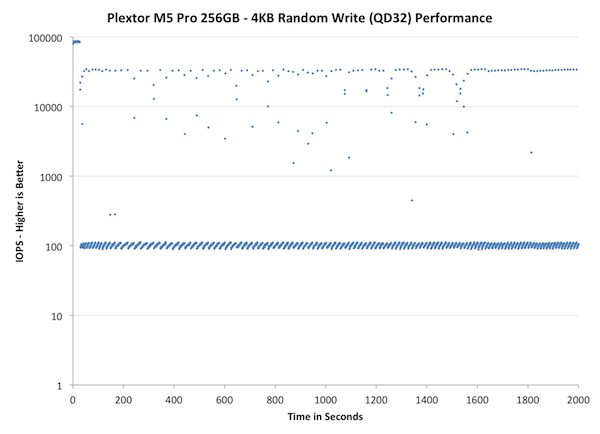
Wow, that's bad. While we haven't run the IO consistency test on all the SSDs we have in our labs, the M5 Pro is definitely the worst one we have tested so far. In less than a minute the M5 Pro's performance drops below 100, which at 4KB transfer size is equal to 0.4MB/s. What makes it worse is that the drops are not sporadic but in fact most of the IOs are in the magnitude of 100 IOPS. There are singular peak transfers that happen at 30-40K IOPS but the drive consistently performs much worse.
Even bigger issue is that over-provisioning the drive more doesn't bring any relief. As we discovered in our performance consistency article, giving the controller more space for OP usually made the performance much more consistent, but unfortunately this doesn't apply to the M5 Pro. It does help a bit as it takes longer for the drive to enter steady-state and there are more IOs happening in the ~40K IOPS range, but the fact is that most IO are still handicapped to 100 IOPS.
The next set of charts look at the steady state (for most drives) portion of the curve. Here we'll get some better visibility into how everyone will perform over the long run.
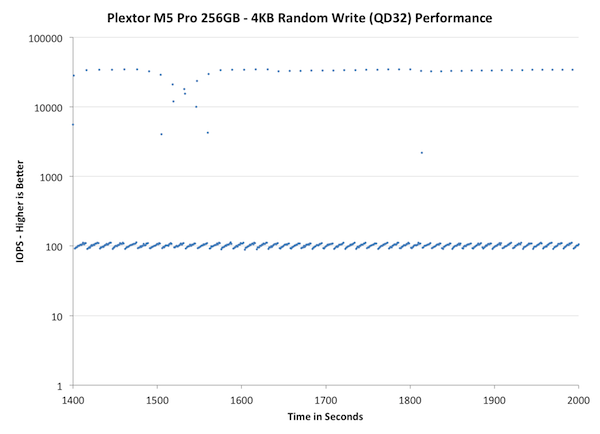
Concentrating on the final part of the test doesn't really bring anything new because as we saw in the first graph already, the M5 Pro reaches steady-state very quickly and the performance stays about the same throughout the test. The peaks are actually high compared to other SSDs but having one IO transfer at 3-5x the speed every now and then won't help if over 90% of the transfers are significantly slower.


46 Comments
View All Comments
JonnyDough - Monday, December 10, 2012 - link
I'm a bit sad the Intel 520 isn't represented here.Kristian Vättö - Monday, December 10, 2012 - link
I only included Intel SSD 335 240GB because it's newer and actually a bit faster. You can always use our Bench tool to compare any SSD, here's M5 Pro versus 520:http://www.anandtech.com/bench/Product/731?vs=529
JonnyDough - Monday, December 10, 2012 - link
I got a 240GB drive from a forum guy for $160 shipped. Seemed like a great deal on a solid drive. Besides, I thought that a lot of people have the 520.mckirkus - Monday, December 10, 2012 - link
This drive scores well in the Anandtech Storage Benchmarks. So my question is whether it means your test doesn't measure impact of IO consistency or if it simply doesn't matter in the real world?Kristian Vättö - Monday, December 10, 2012 - link
Our Storage Suites are run on an empty drive, whereas in the IO consistency test the drive is first filled with sequential data before being hammered by 4KB random writes. The Storage Suites also consist of various IOs with different transfer sizes, queue depths and data patterns and as we have shown before, sequential writes recover performance with most SSDs. The SSD is also not being subjected to IO load all of the time, there are lots of idle periods where the SSD can do GC to recover performance.So, our Storage Suites don't fully ignore IO consistency but it's hard to say how much of an impact the M5 Pro's IO consistency has on its scores.
TemjinGold - Monday, December 10, 2012 - link
Curious as to why this metric HASN'T been reviewed yet? I'm sure a lot of us would be curious as to how all the major SSDs do in this.skytrench - Monday, December 10, 2012 - link
The test is hitting the drive so hard, that cleanup operations don't have time to improve matters. More testing is needed. Few usage patterns would resemble indefinite 4KB random writes.jwilliams4200 - Monday, December 10, 2012 - link
You need to examine the latency for this SSD to see what it is doing. Like you, I was surprised when I first saw the M5P dropping down to such low IOPS under sustained heavy load. Basically, the M5P is rapidly switching between two modes -- a slow throughput mode (presumably doing GC) and a high throughput mode. It certainly does not look pretty when you plot it out.But there are two (possibly) mitigating factors:
1) The average throughput isn't terrible, especially with at least 20% OP. The more OP, the greater percentage of time the SSD spends in the high throughput mode, thus raising the average throughput. The average throughput still is not as good as the Vector, Neutron, or 840 Pro, but it is not as bad as it looks on the graph.
M5P with 0% OP (avg 7MB/s):
http://i.imgur.com/30ZDE.png
M5P with 20% OP (avg 75MB/s):
http://i.imgur.com/yj0cF.png
2) Importantly, Plextor appears to put an ABSOLUTE cap on worst-case latency. I have never seen the latency go over 500ms, no matter what you throw at it. For comparison, with the Samsung 840 Pro, with no OP and a very heavy load, the latency will, very occasionally, go over even 1000ms. You can easily see the bimodal distribution of latencies for the Plextor if you look at the normal probability scale CDF plot. It seems that Plextor has tuned the firmware so that whenever it is in the slow mode doing GC, it has an absolute limit of 500ms before any IO returns. I guess the price to be paid for that absolute latency cap is that the average and worst-case throughput is lower than the competition -- but not so much lower that nobody could consider it an acceptable trade-off in order to gain the absolute cap on worst-case latency.
M5P with 0% OP, worst-case latency 500ms:
http://i.imgur.com/pVmWQ.png
Samsung 840 Pro with 0% OP, worst-case latency >1000ms:
http://i.imgur.com/fjA7N.png
Personally, I would still choose the 840 Pro over the Plextor for sustained heavy workloads (I would overprovision either SSD by at least 20%) because the 840 Pro has much better average latency. But I can imagine that some applications might benefit from the absolute 500ms cap on worst-case latency that the Plextor provides.
Note that none of this really matters for the consumer workloads most people would put an SSD under. Under most consumer workloads, neither the Plextor nor any of the others would have performance drops anywhere near as bad as shown in these sustained heavy workload conditions.
Kevin G - Monday, December 10, 2012 - link
This makes me wonder Plextor has optimized their firmware for more consumer oriented loads. They typically have a lower queue depthckevin1 - Tuesday, December 11, 2012 - link
Great analysis, thank you!The max latency constraint is very clear from the graphs you generated. It's not that the firmware is "bad" necessarily, it is just optimizing for a different performance measurement, one that Anandtech doesn't cover.
I think an analysis of whether max latency is ever important than max throughput would be interesting, along with some data on how the Plextor compares to other drives in this alternate metric.