ASUS Silent Square Pro: Compact Embedded-Fan Heatpipe Tower
by Wesley Fink on April 16, 2007 2:30 AM EST- Posted in
- Cases/Cooling/PSUs
CPU Cooling Test Configuration
The standard test bed for cooling tests uses an EVGA NVIDIA 680i SLI motherboard. This is primarily based on the consistent test results on this board and the excellent NVIDIA Monitor temperature measurement utility, which is part of the nTune program. The 680i chipset is also one of the better options for socket 775 CPU overclocking, and it provides great flexibility in our standard cooler tests which overclock to the failure limit with each cooler tested.
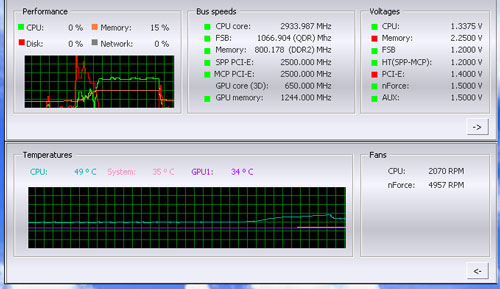
NVIDIA Monitor has a drop-down pane for temperature measurement which reports CPU, System, and GPU results. Reviews at this point will concentrate primarily on CPU temperature. In addition to the real-time temperature measurement, NVIDIA Monitor also has a logging feature which can record temperature to a file in standard increments (we selected every 4 seconds). This allows recording of temperatures during testing and play back, for example, of stress test results that can then be examined when the stress tests are completed. There is also the handy reference of speeds and voltages in the top pane to confirm the test setup.
NVIDIA Monitor was compared to test results from the Intel TAT (Thermal Analysis Tool). Intel TAT CPU portions do function properly on the EVGA 680i motherboard, but the chipset-specific features do not operate as they should. Idle temperatures in TAT were in line with measured Idle temps with NVIDIA Monitor. The CPU stress testing with TAT pushing both cores showed TAT stress temps at 80% CPU usage roughly corresponded to temps reported in our real-world gaming benchmark.
Other components in the cooling test bed are generally the same as those used in our motherboard and memory test bed:
All cooling tests are run with the components mounted in a standard mid-tower case. The idle and stress temperature tests are run with the case closed and standing as it would in most home setups. We do not use auxiliary fans in the test cooling case, except for the Northbridge fan attached to the 680i for overclocking.
Since ASUS provided a small syringe of a premium thermal compound, we tested with the ASUS thermal compound. In our experience the thermal compound used makes little to no difference in cooling test results. This is particularly true now that processors ship with a large manufacturer-installed heatspreader. Our only control on thermal compound is that we use the manufacturer-supplied product if they supply a premium product, or a standard high-quality thermal paste if a premium brand is not supplied.
We first tested the stock Intel cooler at standard X6800 speed, measuring the CPU temperature at idle and while the CPU was being stressed. We stressed the CPU by running continuous loops of the Far Cry River demo. The same tests were repeated at the highest stable overclock we could achieve with the stock cooler. Stable in this case meant the ability to handle our Far Cry looping for at least 30 minutes.
The same tests were then run on the cooler under test at stock, highest stock cooler OC speed (3.73GHz), and the highest OC that could be achieved in the same setup with the cooler being tested. This allows measurement of the cooling efficiency of the test unit compared to stock and the improvement in overclocking capabilities, if any, from using the test cooler.
Noise Levels
In addition to cooling efficiency and overclocking abilities, users shopping for CPU cooling solutions may also be interested in the noise levels of the cooling devices they are considering. Noise levels are measured with the case open on its side and are measured using a C.E.M. DT-8850 Sound Level meter. This meter allows accurate sound level measurements from 35b dB to 130 dB with a resolution of 0.1 dB and an accuracy of 1.5 dB. This is sufficient for our needs in these tests, as measurement starts at the level of a relatively quiet room. Our own test room, with all computers and fans turned off, has a room noise level of 36.4 dB.
Our procedures for measuring cooling system noise are described on the page reporting measured noise results comparing the stock Intel cooler and recently tested CPU coolers to the ASUS Silent Square Pro.
The standard test bed for cooling tests uses an EVGA NVIDIA 680i SLI motherboard. This is primarily based on the consistent test results on this board and the excellent NVIDIA Monitor temperature measurement utility, which is part of the nTune program. The 680i chipset is also one of the better options for socket 775 CPU overclocking, and it provides great flexibility in our standard cooler tests which overclock to the failure limit with each cooler tested.
NVIDIA Monitor has a drop-down pane for temperature measurement which reports CPU, System, and GPU results. Reviews at this point will concentrate primarily on CPU temperature. In addition to the real-time temperature measurement, NVIDIA Monitor also has a logging feature which can record temperature to a file in standard increments (we selected every 4 seconds). This allows recording of temperatures during testing and play back, for example, of stress test results that can then be examined when the stress tests are completed. There is also the handy reference of speeds and voltages in the top pane to confirm the test setup.
NVIDIA Monitor was compared to test results from the Intel TAT (Thermal Analysis Tool). Intel TAT CPU portions do function properly on the EVGA 680i motherboard, but the chipset-specific features do not operate as they should. Idle temperatures in TAT were in line with measured Idle temps with NVIDIA Monitor. The CPU stress testing with TAT pushing both cores showed TAT stress temps at 80% CPU usage roughly corresponded to temps reported in our real-world gaming benchmark.
Other components in the cooling test bed are generally the same as those used in our motherboard and memory test bed:
| Cooling Performance Test Configuration | |
| Processor | Intel Core 2 Duo X6800 (x2, 2.93GHz, 4MB Unified Cache) |
| RAM | 2x1GB Corsair Dominator PC2-8888 (DDR2-1111) |
| Hard Drive(s) | Hitachi 250GB SATA2 enabled (16MB Buffer) |
| Video Card: | 1 x EVGA 7900GTX - All Standard Tests |
| Platform Drivers: | NVIDIA 9.53 |
| NVIDIA nTune: | 5.05.22.00 (1/16/2007) |
| Video Drivers: | NVIDIA 93.71 |
| CPU Cooling: | ASUS Silent Square Pro Scythe Ninja Plus Rev. B OCZ Vindicator Thermalright Ultra 120 Extreme Thermalright Ultra 120 Scythe Infinity Zalman CNS9700 Zalman CNS9500 Cooler Master Hyper 6+ Vigor Monsoon II Lite Thermalright MST-9775 Scythe Katana Tuniq Tower 120 Intel Stock HSF for X6800 |
| Power Supply: | OCZ PowerStream 520W |
| Motherboards: | EVGA nForce 680i SLI (NVIDIA 680i) |
| Operating System(s): | Windows XP Professional SP2 |
| BIOS | Award P24 (1/12/2007) |
All cooling tests are run with the components mounted in a standard mid-tower case. The idle and stress temperature tests are run with the case closed and standing as it would in most home setups. We do not use auxiliary fans in the test cooling case, except for the Northbridge fan attached to the 680i for overclocking.
Since ASUS provided a small syringe of a premium thermal compound, we tested with the ASUS thermal compound. In our experience the thermal compound used makes little to no difference in cooling test results. This is particularly true now that processors ship with a large manufacturer-installed heatspreader. Our only control on thermal compound is that we use the manufacturer-supplied product if they supply a premium product, or a standard high-quality thermal paste if a premium brand is not supplied.
We first tested the stock Intel cooler at standard X6800 speed, measuring the CPU temperature at idle and while the CPU was being stressed. We stressed the CPU by running continuous loops of the Far Cry River demo. The same tests were repeated at the highest stable overclock we could achieve with the stock cooler. Stable in this case meant the ability to handle our Far Cry looping for at least 30 minutes.
The same tests were then run on the cooler under test at stock, highest stock cooler OC speed (3.73GHz), and the highest OC that could be achieved in the same setup with the cooler being tested. This allows measurement of the cooling efficiency of the test unit compared to stock and the improvement in overclocking capabilities, if any, from using the test cooler.
Noise Levels
In addition to cooling efficiency and overclocking abilities, users shopping for CPU cooling solutions may also be interested in the noise levels of the cooling devices they are considering. Noise levels are measured with the case open on its side and are measured using a C.E.M. DT-8850 Sound Level meter. This meter allows accurate sound level measurements from 35b dB to 130 dB with a resolution of 0.1 dB and an accuracy of 1.5 dB. This is sufficient for our needs in these tests, as measurement starts at the level of a relatively quiet room. Our own test room, with all computers and fans turned off, has a room noise level of 36.4 dB.
Our procedures for measuring cooling system noise are described on the page reporting measured noise results comparing the stock Intel cooler and recently tested CPU coolers to the ASUS Silent Square Pro.


24 Comments
View All Comments
Avalon - Tuesday, April 17, 2007 - link
Good review. Useless cooler.I'm still going to throw my vote out there for you guys possibly reviewing the Coolermaster HyperTX. That thing is supposed to cool extremely well while providing awesome mosfet cooling.
poohbear - Monday, April 16, 2007 - link
thanks for the review as heatsink reviews are always good to see! however, could u start using bar graphs in your reviews as they're MUCH easier to read then the ones u choose to use. Much simpler to view the info instead of sifting through all the names on the side and numbers on the right. please and thank u.Wesley Fink - Monday, April 16, 2007 - link
The bar graph idea sounds good, but the charts are trend line charts with 4 or 5 points for each cooler and fan configuration. It would take at least 5 bar graphs to replace each chart, and then the trend would also be lost. We have added a "click to enlarge" feature to the charts to make them more usable for those who closely scrutinize the temperature data.Frumious1 - Monday, April 16, 2007 - link
Every now and then some whiner will come along and dislike the scaling graphs, Wes. Just ignore them! Anyone that can't understand the intent of a scaling graph needs a lesson in reading comprehension anyway. My only thought is maybe some sorting of the data in the scaling graphs would be useful. They crurently seem to be sorted by when you reviewed the coolers, and most people probably could care less about the chronological aspects.At some point, you're going to need to start dropping coolers from those scaling graphs as well. That's my opinion at least - they're already very crowded! Maybe select the "best" coolers (or just a reasonable baseline group) and just leave those in the scaling graphs, with the complete list of coolers in the other charts? You could have the Thermalright Ultra 120 Extreme (is that out yet!?), Tuniq 120, Cooler Master Hyper 6+, Monsoon Lite II, Scythe Ninja B, and the lowly Intel retail. Then just add the specific cooler being tested. Right now there's definitely an "information overload" aspect ot the scaled charts, and it will only get worse with time as more HSFs are added.
/$0.02
strikeback03 - Monday, April 16, 2007 - link
Or possibly the best few coolers in each price bracket, along with the tested cooler, and a link to a large image of all of the tested coolers. Something interactive, where you could turn individual coolers on and off, whould be nice, though I don't know if there is software that would allow these to be easily made.JarredWalton - Monday, April 16, 2007 - link
I know our graphing engine is currently undergoing some development/design work, but when that will be complete and what it will offer I do not yet know. If we could get something interactive, that would be pretty cool. Right now, our engine doesn't handle scaling graphs at all, which is why we just use Excel to generate those manually. We can hope, though! :)NARC4457 - Monday, April 16, 2007 - link
It feels like the noise measurement methodology needs a tweak since there are many coolers that are sitting right at the noise floor. I know that you are testing these in real-world conditions, with components that enthusiasts are likely to use. But I guess it just feels like the test is becoming less meaningful if the results are the same across many coolers.I don't really have a suggestion here, because I don't think people would like it either if you simply stated that the cooler was not louder than ambient without showing the method and
Wesley Fink - Monday, April 16, 2007 - link
We will be revamping our test bed when we do the 120mm fan roundup. We are currently evaluatig components to find a little lower noise floor and to priduce some consistent test methods that don't get spoofed by variable speed PS fans. Thanks for your comments.flipmode - Monday, April 16, 2007 - link
Thanks for another HSF article - these are valuable contributions to the enthusiast scene. But I have to ask if you can start cropping and upscaling your graphs - they're darn near unreadable now that you've made such a wonderful effort to test 20 coolers. I want to actually be able to read what you've take the time to present.Scythe Ninja Fanboy
crimson117 - Monday, April 16, 2007 - link
Or provide a link to a larger version of each graph.